An initial estimate of the value of ecosystem services in Bhutan
Ida Kubiszewski
a,n, Robert Costanza
a, Lham Dorji
b, Philip Thoennes
c, Kuenga Tshering
b aAustralian National University, Crawford School of Public Policy, Canberra, Australia b
National Statistics Bureau, Royal Government of Bhutan, Thimphu, Bhutan cNorthwest Power and Conservation Council, Portland OR, USA
a r t i c l e
i n f o
Article history: Received 7 July 2012 Received in revised form 25 November 2012 Accepted 27 November 2012 Available online 25 December 2012
Keywords: Valuation
Royal Government of Bhutan Ecosystem services Benefit transfer Well-being
Gross National Happiness (GNH)
a b s t r a c t
We estimated the value of ecosystem services in Bhutan using benefit transfer methodology in order to determine an initial assessment of their overall contribution to human well-being . The total estimated value was approximately $15.5 billion/yr (NU760 billion/yr), significantly greater than the gross domestic product (GDP) of $3.5 billion/yr.
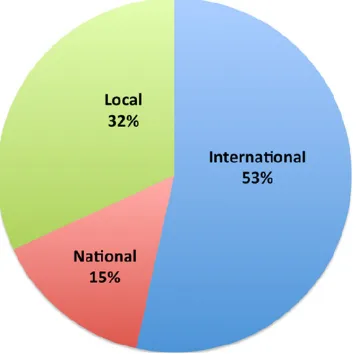
We also estimated who benefits from Bhutan’s ecosystem services. 53% of the total benefits accrue to people outside Bhutan. 47% of the benefits accrue to people inside the country—15 % at the national level, and 32% at the local level. Based on this and a population of 700,000 we estimated Bhutan’s combined per capita annual benefits at $15,400/capita/yr. Of this $5000 is from goods and services captured in GDP and $10,400 is from ecosystem services. This is only a partial estimate that leaves out other sources of benefits to people, including social and cultural values.
This study is the first phase of a larger, multiyear project and ongoing effort in Bhutan. Subsequent phases will apply more sophisticated methods to further elaborate the value of Bhutan’s ecosystem services, who benefits from them, how they can best be integrated into national well-being accounting, and how best to manage them.
&2012 Elsevier B.V. All rights reserved.
1. Introduction
Bhutan is a small (population approximately 700,000) Hima-layan country whose Fourth King declared that the goal of his country’s policy was ‘‘Gross National Happiness’’ (GNH) rather than ‘‘Gross Domestic Product’’ (GDP). GNH aims to integrate sustainable and equitable economic development across nine domains: psychological wellbeing, health, education, culture, time use, good governance, community vitality, ecological diver-sity and resilience, and living standards.
After a very interesting and unique transition to democracy initiated by the Fourth King, Bhutan is now a constitutional monarchy—much like Britain—where the King has mainly cere-monial duties. The first democratically elected Prime Minister, Lyonchoen Jigme Y. Thinley, and the elected government have set up a ‘‘Gross National Happiness Commission’’ (GNHC)the former Planning Commissionto develop the country in accord with GNH principles. The Commission has developed a GNH policy screen based on GNH indicators, measures, and surveys developed by the Centre for Bhutan Studies, Bhutan’s primary think-tank .
More than half of Bhutan’s land area is under environmental protection (Ministry of Agriculture and Forest, 2012), and national policies include the goal to become the first country to produce only organic food, to be a net carbon dioxide sink in perpetuity, and to have a pedestrian Tuesday, where no cars are allowed in any major city on Tuesdays.
The Bhutanese recognize the need to move beyond GDP due to its well-known limitations as a national welfare measure and policy goal. GDP is the total market value of all final goods and services produced in a country in a given period. But GDP was never intended as a measure of well-being or progress. It is based on current prices, which are not appropriate measures of scarcity, especially of natural and social capital. It also only measures national income or economic activity and only includes those goods and services traded in markets. It also adds all economic activities together, without differentiating between those that enhance well-being and those that reduce from it. An oil spill, for example, increases GDP because of the clean up work required, but it obviously detracts from well-being . More crime, sickness, war, pollution, fires, storms, and pestilence are all potentially positives for GDP because they increase economic activity. GDP also takes no account of how the national income is distributed among the population, ignoring the fact that a dollar’s worth of income produces more well-being for a poor person than a rich one.
GDP is precise but not accurate. It is precise because it is replicable; it is inaccurate (as a measure of welfare) because it
Contents lists available atSciVerse ScienceDirect
journal homepage:www.elsevier.com/locate/ecoser
Ecosystem Services
2212-0416/$ - see front matter&2012 Elsevier B.V. All rights reserved. http://dx.doi.org/10.1016/j.ecoser.2012.11.004
n
Correspondence to: Australian National University, Crawford School for Public Policy, Crawford Building (132), Canberra 0200, Australia.
E-mail address:[email protected] (I. Kubiszewski).
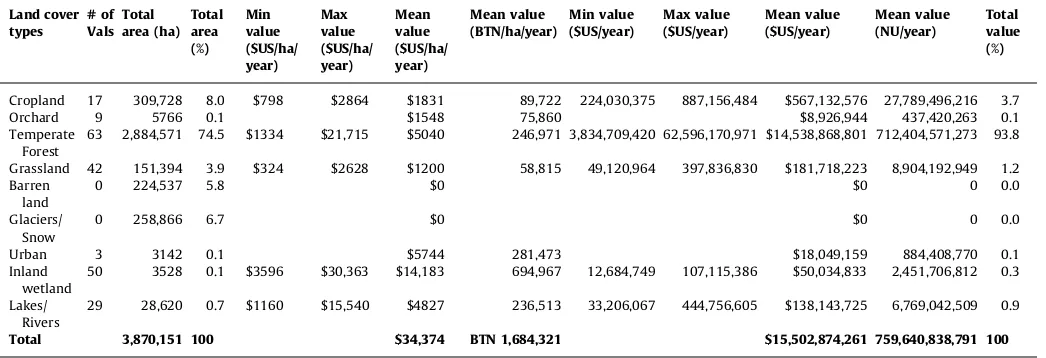
Table 1
Ecosystem service values (ranges and means) for 9 land-cover types.
Ref Total area (ha) Total area (%) Min value ($US/ha/year)
Max value ($US/ha/year)
Mean value ($US/ha/year)
Min value ($US/year)
Max value ($US/year)
Mean value ($US/year)
Total value (%)
Cropland 17 309,728 8.0 $798 $2864 $1831 $224,030,375 $887,156,484 $567,132,576 3.7
Provisioning services $145 $181 $163 $45,059,914 $56,045,822 $50,552,868
Food 2 $71 $106 $89 $21,981,621 $32,967,530 $27,474,576
Raw materials 1 $11 $3,296,412
Water 1 $64 $19,781,880
Regulating services $651 $2649 $1650 $201,718,432 $820,338,334 $511,028,383
Air quality 1 $53 $16,482,062
Biodiversity protection 2 $76 $1930 $1003 $23,405,209 $597,718,604 $310,561,907
Biological control 1 $28 $8,734,320
Climate regulation 1 $95 $29,340,795
Erosion prevention 2 $51 $135 $93 $15,734,164 $41,793,874 $28,764,019
Pollination 1 $19 $5,822,880
Soil formation 2 $155 $214 $185 $48,131,708 $66,378,506 $57,255,107
Water purification 1 $175 $54,067,294
Cultural services $1 $35 $18 $330,322 $10,772,327 $5,551,325
Recreation 2 $1 $35 $18 $330,322 $10,772,327 $5,551,325
Orchard 9 5766 0.1 $1548 $8,926,944 0.1
Provisioning services $375 $2,163,441
Food 1 $21 $122,738
Raw materials 1 $141 $813,200
Water 1 $213 $1,227,503
Regulating services $1103 $6,358,456
Air quality 1 $229 $1,319,556
Biodiversity protection 1 $232 $1,334,899
Climate regulation 1 $192 $1,104,766
Soil formation 1 $311 $1,795,228
Water purification 1 $139 $804,008
Cultural Services $70 $405,047
Recreation 1 $70 $405,047
Temperate forest 63 2,884,571 74.5 $1334 $21,715 $5040 $3,834,709,420 $62,596,170,971 $14,538,868,801 93.8
Provisioning Services $67 $888 $475 $191,975,096 $2,561,771,497 $1,371,053,030
Bioprospecting 1 $8 $24,184,245
Food 4 $0 $432 $242 $599,779 $1,247,000,114 $697,379,641
Genetic resources 1 $19 $54,229,938
Timber 2 $39 $50 $44 $112,821,440 $143,623,952 $128,222,696
Water 5 $0 $379 $162 $139,695 $1,092,733,248 $467,036,510
Regulating Services $1264 $13,671 $3524 $3,633,654,443 $39,394,646,032 $10,165,400,181
Air quality 1 $852 $2,457,834,607
Biodiversity protection 8 $7 $5192 $969 $19,706,381 $14,976,693,482 $2,795,708,992
Biological control 2 $5 $14 $9 $27,277,513
Climate regulation 15 $2 $6999 $1220 $6,007,590 $20,188,808,099 $3,518,000,805
Erosion prevention 2 $2 $115 $58 $5,000,654 $330,802,621 $167,901,637
Pollination 1 $376 $1,084,598,758
Soil formation 1 $11 $32,537,963
Water purification 5 $0 $102 $28 $151,152 $295,553,161 $81,000,079
Water regulation 1 $0 $539,827
Cultural Services $3 $7155 $1041 $9,079,880 $20,639,753,443 $3,002,415,591
Cultural values 1 $2 $5,422,994
Education 1 $0 $1,279,944
Science/Research 1 $0 $21,620
Tourism/Recreation 11 $1 $7153 $1039 $2,355,322 $20,633,028,885 $2,995,691,033
Grassland 42 151,394 3.9 $324 $2628 $1200 $49,120,964 $397,836,830 $181,718,223 1.2
Provisioning services $70 $758 $340 $10,543,718 $114,688,284 $51,526,905
I.
Kubiszewski
et
al.
/
Ecosystem
Services
3
(2013)
e11
–e21
Bioprospecting 1 $0 $35,729
Food 4 $38 $152 $88 $5,756,888 $23,055,760 $13,267,460
Genetic resources 1 $0 $2,030
Raw materials 2 $6 $33 $20 $959,481 $4,975,597 $2,967,539
Water 3 $25 $572 $233 $3,789,589 $86,619,168 $35,254,147
Regulating services $220 $1831 $824 $33,333,349 $277,223,781 $124,700,792
Air quality 1 $101 $15,353,685
Biodiversity protection 3 $0 $138 $46 $1,590 $20,918,280 $6,975,674
Biological control 1 $29 $4,405,559
Climate regulation 9 $0 $642 $137 $9084 $97,123,566 $20,670,672
Erosion prevention 4 $35 $120 $65 $5,265,476 $18,167,254 $9,860,318
Pollination 1 $30 $4,553,925
Soil formation 2 $7 $247 $127 $996,171 $37,423,739 $19,209,955
Water purification 4 $13 $166 $107 $2,036,309 $25,140,791 $16,246,738
Water regulation 2 $5 $358 $181 $711,551 $54,136,980 $27,424,265
Cultural Services $35 $39 $36 $5,243,897 $5,924,766 $5,490,526
Attractive landscapes 1 $34 $5,157,578
Recreation 3 $1 $5 $2 $86,320 $767,189 $332,949
Barren land 0 224,537 5.8 $0 $0 0.0
Glaciers/Snow 0 258,866 6.7 $0 $0 0.0
Urban 3 3142 0.1 $5744 $18,049,159 0.1
Climate regulation 1 $780 $2,451,448
Recreation 1 $4950 $15,553,407
Water regulation 1 $14 $44,303
Inland wetland 50 3528 0.1 $3596 $30,363 $14,183 $12,684,749 $107,115,386 $50,034,833 0.3
Provisioning services $2244 $5470 $3623 $7,916,161 $19,298,764 $12,782,686
Food 5 $0 $914 $167 $777 $3,225,092 $590,860
Genetic resources 1 $9 $32,808
Raw materials 7 $0 $85 $19 $995 $299,180 $67,581
Water 3 $2234 $4462 $3427 $7,881,581 $15,741,683 $12,091,437
Regulating services $1305 $19,560 $8561 $4,602,781 $69,004,200 $30,202,285
Biodiversity protection 5 $9 $1,584 $452 $32,352 $5,586,426 $1,593,363
Biological control 1 $13 $45,007
Climate regulation 3 $51 $292 $140 $178,432 $1,031,317 $492,745
Erosion prevention 1 $72 $252,779
Disturbance regulation 5 $204 $8495 $3070 $719,601 $29,967,893 $10,831,941
Pollination 1 $14 $48,913
Soil formation 2 $25 $209 $117 $89,176 $737,726 $413,451
Water purification 3 $489 $1947 $1002 $1,726,428 $6,867,711 $3,535,826
Water regulation 2 $428 $6935 $3682 $1,510,094 $24,466,428 $12,988,261
Cultural Services $47 $5333 $1998 $165,807 $18,812,422 $7,049,862
Cultural values 5 $9 $2067 $774 $33,161 $7,292,176 $2,732,112
Tourism/Recreation 6 $38 $3266 $1,224 $132,645 $11,520,246 $4,317,750
Lakes/Rivers 29 28,620 0.7 $1160 $15,540 $4827 $33,206,067 $444,756,605 $138,143,725 0.9
Provisioning services $494 $11,855 $3,060 $14,145,105 $339,305,925 $87,586,099
Energy 4 $56 $6534 $1723 $1,599,729 $187,003,916 $49,319,774
Food 3 $13 $53 $38 $362,769 $1,520,554 $1,097,144
Raw materials 1 $1 $36,352
Water 10 $34 $2586 $1297 $984,449 $74,011,981 $37,132,829
Regulating Services $390 $2681 $1178 $11,161,807 $76,733,122 $33,722,564
Biodiversity protection 1 $316 $9,033,995
Climate regulation 1 $58 $1,668,812
Water purification 3 $16 $2307 $804 $458,999 $66,030,315 $23,019,756
Cultural Services $276 $1003 $588 $7,899,155 $28,717,558 $16,835,061
Recreation 6 $276 $1003 $588 $7,899,155 $28,717,558 $16,835,061
Total 3,870,151 $15,502,874,261
I.
Kubiszewski
et
al.
/
Ecosystem
Services
3
(2013)
e11
–e21
ignores the contributions of natural capital and many other factors (such as the other domains of GNH). The benefits transfer method applied in this paper is not very precise, but it improves the accuracy of monetary measures of economic welfare.
Alternative measures of progress, like the Index of Sustainable Economic Welfare (ISEW) or a variant called the Genuine Progress Indicator (GPI) take account of economic, social, and environ-mental realities that are ignored in GDP accounting to arrive at a better approximation of ‘‘National Well-being .’’ ISEW and GPI start with personal consumption expenditures, but weigh them by income distribution to account for the fact that a dollar’s worth of additional income produces far more welfare for a poor person than a rich one. It then adds positive activities that are left out of GDP like volunteer work and household labor, and subtracts activities that are included in GDP but are negatives, like the costs of crime, commuting, pollution, and natural capital deple-tion (Daly and Cobb, 1989;Lawn, 2005). Results show that while the United States’ GDP has steadily increased since 1950 (with the occasional recession), GPI peaked around 1975 and has been relatively flat or declining ever since (Beddoe et al., 2009).
So what do the Bhutanese mean by GNH? Bhutan has recently completed a survey of 8000 of its citizens, asking them over 200 questions about various aspects of their lives. The survey includes measures of ‘‘subjective well-being’’ or SWB—an area of research that is getting increasing attention in many quarters of science and policy as part of the emerging ‘‘science of happiness’’ (Easterlin, 2003; Layard, 2005). In the US, for example, SWB surveys show flat or dropping scores over the last several decades, consistent with the flattening and declining GPI estimates (Herna´ndez-Murillo and Martinek, 2010).
But the GNHC and others in Bhutan recognize that there are other, more objective elements that are also important in assessing their country’s overall well-being . For example, ecosystem ser-vices, an important aspect of one of the nine domain used in GNH, are the often un-accounted for benefits that people derive from nature—clean air, water, soil, a stable climate, recreational, and spiritual opportunities to connect with nature, and many more. A previous study (Costanza et al., 1997) estimated that globally these services were worth, in aggregate, more than all of global GDP combined. But these services do not yet adequately appear in any country’s national accounts. Bhutan sees itself as a leader in rectifying this situation. It hosted a workshop in Thimphu, the capital in March 2011 with over seventy representatives from several government agencies, universities, and others, to discuss
how best to do this. The contribution of natural capital in the GNH framework is ultimately its contribution to overall sustainable human well-being as expressed by the nine domains of GNH.
As a first step in this process, we have estimated the value of ecosystem services in Bhutan using a simple benefit transfer methodology based on land use. This initial estimate sets the stage for further work. However, estimating monetary values of ecosystem services is only an initial step in estimating its contribution to GNH. The fact that this study only estimated the benefits from natural capital does not imply that natural capital is the only or the most important contribution to GNH. Using monetary valuation also does not imply that these are exchange values, where one dollar’s worth of any other commodity is a perfect substitute for one dollar’s worth of natural capital. Most ecosystem services are best viewed a public goods that cannot (or should not) be commodified or exchanged in markets. Never-theless, estimating their value in terms of their contribution to human well-being expressed in monetary units, is important for policy decision-making and national accounting.
2. Methods
Ecosystem service valuation (ESV) is the process of assessing the contributions of ecosystem services to sustainable human well-being (Costanza and Folke, 1997). One application of ESV is natural capital accounting, that is, to provide for comparisons of natural capital to physical and human capital in regard to their contributions to human welfare (Liu et al., 2010).
Various methods have been used to estimate both the market and non-market components of the value of ecosystem services (Farber et al., 2006). In this study, benefit transfer was used to value the various ecosystems within the country of Bhutan. Benefit transfer is the process of utilizing existing valuation studies or data to estimate the value of ecosystem services in one location and transfer them to value ecosystem services in a similar location (Costanza et al., 1997). The transfer method involves obtaining an economic estimate for the value of market and nonmarket services through the analysis of a single study, or group of studies, that have been previously carried out to value similar services. Benefit transfer is often used when resources and/or time is unavailable to do a more detailed, on-the-ground, data collection study (Wilson and Hoehn, 2006). However, there are limitations to the use of benefit transfer including data
Table 2
Summary table of ecosystem services values for the 9 land-cover types.
Land cover types # of Vals Total area (ha) Total area (%) Min value ($US/ha/ year) Max value ($US/ha/ year) Mean value ($US/ha/ year) Mean value (BTN/ha/year) Min value ($US/year) Max value ($US/year) Mean value ($US/year) Mean value (NU/year) Total value (%)
Cropland 17 309,728 8.0 $798 $2864 $1831 89,722 224,030,375 887,156,484 $567,132,576 27,789,496,216 3.7
Orchard 9 5766 0.1 $1548 75,860 $8,926,944 437,420,263 0.1
Temperate Forest
63 2,884,571 74.5 $1334 $21,715 $5040 246,971 3,834,709,420 62,596,170,971 $14,538,868,801 712,404,571,273 93.8
Grassland 42 151,394 3.9 $324 $2628 $1200 58,815 49,120,964 397,836,830 $181,718,223 8,904,192,949 1.2 Barren
land
0 224,537 5.8 $0 $0 0 0.0
Glaciers/ Snow
0 258,866 6.7 $0 $0 0 0.0
Urban 3 3142 0.1 $5744 281,473 $18,049,159 884,408,770 0.1
Inland wetland
50 3528 0.1 $3596 $30,363 $14,183 694,967 12,684,749 107,115,386 $50,034,833 2,451,706,812 0.3
Lakes/ Rivers
29 28,620 0.7 $1160 $15,540 $4827 236,513 33,206,067 444,756,605 $138,143,725 6,769,042,509 0.9
Total 3,870,151 100 $34,374 BTN 1,684,321 $15,502,874,261 759,640,838,791 100 I. Kubiszewski et al. / Ecosystem Services 3 (2013) e11–e21
Table 3
Distribution table of who benefits from the 22 ecosystem services present in Bhutan.
Min value ($US/ha/year)
Max value ($US/ha/year)
Mean value ($US/ha/year)
Min value ($US/year)
Max value ($US/year)
Mean value ($US/year)
Percent of total benefits (%) Total value ($US/year)
International National Local International National Local
Provisioning services
Bioprospecting $9 $24,219,974 90 10 21,797,976 2,421,997 0
Energy $56 $6534 $1723 $1,599,729 $187,003,916 $49,319,774 100 0 49,319,774 0
Food $122 $1658 $645 $28,701,834 $1,307,769,050 $739,932,418 100 0 0 739,932,418
Genetic resources $28 $54,264,776 50 50 27,132,388 27,132,388 0
Other Raw materials $7 $118 $192 $960,477 $5,274,777 $7,181,085 100 0 0 7,181,085
Timber $39 $50 $44 $112,821,440 $143,623,952 $128,222,696 50 50 0 64,111,348 64,111,348
Water $2294 $7999 $5396 $12,795,314 $1,269,106,080 $572,524,306 80 20 458,019,445 114,504,861 0
Regulating services
Air quality $1236 $2,490,989,911 100 0 0 2,490,989,911
Biodiversity protection $92 $8844 $3017 $43,145,531 $15,600,916,792 $3,125,208,830 50 50 1,562,604,415 1,562,604,415 0
Biological control $5 $14 $80 $40,462,399 20 40 40 8,092,480 16,184,959 16,184,959
Climate regulation $53 $7933 $2621 $6,195,105 $20,286,962,983 $3,573,730,043 100 3,573,730,043 0 0
Erosion prevention $87 $370 $288 $26,000,294 $390,763,749 $206,778,753 25 75 0 51,694,688 155,084,065
Disturbance regulation $204 $8495 $3070 $719,601 $29,967,893 $10,831,941 5 25 70 541,597 2,707,985 7,582,359
Pollination $439 $1,095,024,476 100 0 0 1,095,024,476
Soil formation $187 $671 $752 $49,217,055 $104,539,971 $111,211,704 50 25 25 55,605,852 27,802,926 27,802,926
Water purification $519 $4522 $2256 $4,372,888 $393,591,979 $178,673,700 80 10 10 142,938,960 17,867,370 17,867,370
Water regulation $433 $7293 $3877 $2,221,645 $78,603,409 $40,996,657 25 50 25 10,249,164 20,498,328 10,249,164
Cultural services
Attractive landscapes $34 $5,157,578 20 80 0 1,031,516 4,126,062
Cultural values $9 $2067 $776 $33,161 $7,292,176 $8,155,106 50 50 0 4,077,553 4,077,553
Education $1,279,944 50 50 0 639,972 639,972
Science/Research $21,620 80 10 10 17,296 2162 2162
Tourism/Recreation $316 $11,462 $7891 $10,803,765 $20,684,806,205 $3,038,686,572 80 10 10 2,430,949,258 303,868,657 303,868,657
Total $15,502,874,261 53 15 32 $8,291,678,874 $2,266,470,901 $4,944,724,486
I.
Kubiszewski
et
al.
/
Ecosystem
Services
3
(2013)
e11
–e21
availability and reliability, distribution of data on services and values over biomes, difference in socio-economic context, spatial heterogeneity, and others (de Groot et al., 2012). The transfer itself refers to the application of values and other information from the original study site to a new site (Brookshire and Neill, 1992;Desvouges et al., 1998).
In order to estimate the total value of ecosystem services, we needed estimates of the total extent of the ecosystems themselves. The National Land Commission of Bhutan was able to provide a land cover classification scheme with 51 categories to represent land use in Bhutan. These 51 categories were aggregated into nine land cover categories (cropland, orchard, temperate forest, grass-land, barren grass-land, glacier/snow, inland wetgrass-land, and lakes/rivers) to correlate them with previously valued land uses.
The Ecosystem Services Valuation Database (ESVD), compiled by the international Ecosystem Services Partnership (ESP—www. es-partnership.org), was used to determine the values for each of the land cover types similar to those that are located in Bhutan. We selected studies valuing similar goods or services to those found in Bhutan and in locations at similar latitudes as Bhutan. We converted all estimates into 2005 U.S. dollars per hectare per year, and organized the values corresponding to the services within each of the land cover types (Table 1). From this we were able to determine the minimum, maximum, and mean of the economic values for most services in each land cover (Rosenberger and Loomis, 2003). We then multiply the mean values per hectare by the area of each land cover. The results showed the estimated total value each service provides from each land cover within Bhutan in $US 2005 per year. That result was also converted to Ngultrum, the Bhutan currency, which is pegged to the Indian rupee and, at the time of writing (February 2012), had an exchange rate to the $US of 49 to 1. A summary of these results is shown inTable 2.
To estimate who benefits from these services, regardless of which land cover produced them, an expert panel estimated what percentage of each service was utilized internationally, nationally, or locally (Table 3). This panel’s estimates were a rough first
approximation based on their knowledge and expertise of the ecosystem services involved.
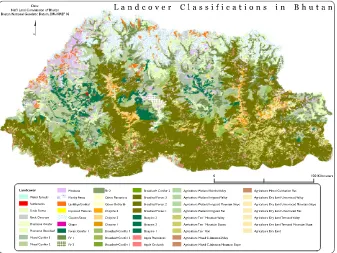
3. Results
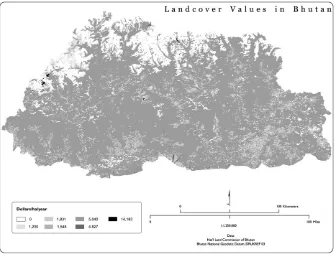
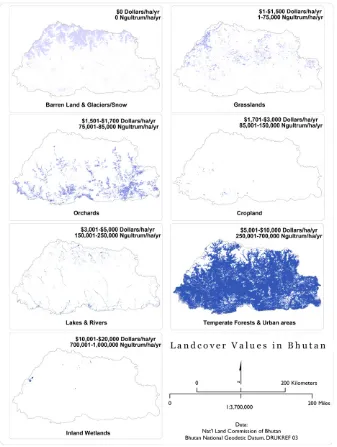
The accompanying maps show the location of valued ecosys-tems and their services.Fig. 1shows a map of the 51 categoriza-tions of the land cover classification scheme. By knowing the location and area of each of the land cover types and the dollar values per hectare per year, we are able to overlay the values and the land cover types to estimate the total values for each area of Bhutan based on prior studies of similar land types and the ecosystem services they provide (Fig. 2). These values were split up into six categories, with values ranging from $0 to $20,000/ha/ yr. As a way to better show the location of the different values, Fig. 2 was split up into six individual maps (Fig. 3), each one showing one of the six value categories.
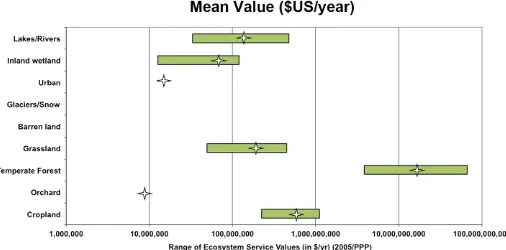
There is considerable variability in ecosystem service values delivered by different land cover types. On a per hectare basis, inland wetlands are estimated to provide the highest annual values ($14,183/ha/yr), followed by urban areas ($5,744/ha/yr). Urban has a significantly higher per hectare value then many of the other land cover types due to the close proximity to human populations. However, both of these land-cover types represent a small percentage of the total land area in Bhutan. At the other end of the value spectrum, grasslands ($1,200/ha/yr) and orchards ($1,548/ha/yr) provide the lowest annual values, disregarding barren land and glacier/snow (Fig. 4).
Bhutan covers approximately 3.9 million hectares in land area (39,000 square kilometers). Looking at the land cover map (Fig. 1) we see that the majority (74.5%) is covered in forest, followed by cropland at 8%. Taking into account the total area of each land cover type and the value of that land cover, we find that the Bhutan forests have the greatest value of $14.5 billion/yr, making up 93.8% of the total value of Bhutan’s ecosystem services (Table 1,Fig. 5). Cropland, covering only 8% of land area, has the
Fig. 1.Landcover classification in Bhutan. A map of the 51 categorizations of the land cover classification scheme. I. Kubiszewski et al. / Ecosystem Services 3 (2013) e11–e21
second largest value of $567 million/yr, amounting to 3.7% of the total value of the ecosystem services in Bhutan. This value is comparable to the contribution of agriculture to the Bhutanese GDP of about $640 million in 2003 (Tobgay, 2005). The total value of market and nonmarket ecosystem services in Bhutan is estimated at $15.5 billion/yr.1
For each land cover type, multiple studies were used to estimate the value provided by the various ecosystem services. A minimum and maximum value for each of the services from the studies, and the number of studies used for each service can be seen inTable 2.
Fig. 2shows that a significant portion of northern Bhutan has little value associated with the ecosystem services. These areas are mainly glaciers/snow and barren land, a land use type whose ecosystem service values have not been well researched yet. Such ecosystems likely have significant values both as water sources and also due to their high tourist/recreation value in countries like Bhutan. For example, by estimating the number of trekkers and how much time they spend trekking in the high mountains, a recreation value for Bhutan’s glaciers/snow and barren land could be determined. But this has not been done yet. For this and many other reasons, the $15.5 billion estimate for the value of Bhutan’s ecosystem services is almost certainly an under-estimate .
Because forests make up such a large portion of Bhutan’s land cover, the majority of the value visible on the map is due to forests, between $5001 and $10,000 per hectare per year (250,001–700,000 Ngultrum/ha/yr). However, there are areas of Bhutan with far higher ecosystem services values on a per hectare basis. There are also areas, in the western part of the country, primarily inland wetlands, where the ecosystem services values
are between $10,001 and $20,000 per hectare per year (700,000– 1,000,000 NU/ha/yr). This is the location of the majority of the inland wetlands, which are valued at around $14,183/ha/yr.
It should be emphasized that these estimates are merely first approximations and are not extremely precise. However they are much more accurate that no estimates at all, or default estimates of zero. As has often been said, it is better to be approximately right than precisely wrong. It should also be noted that GDP estimates are themselves also just approximations and should not be given more precision than they deserve.
Determining who benefits from these services is also a critical aspect, addressed inTable 3. An expert panel estimated that 53% of the value of the 22 ecosystem services that existed in Bhutan benefited people outside the country, with the largest service being climate regulation ($3.5 billion) followed by tourism/ recreation ($2.4 billion). Fifteen percent of services benefited Bhutan as a whole, and 32% benefited local people, most of that being through air quality regulation ($2.5 billion), followed by pollination ($1.1 billion), and food ($740 million) (Table 3,Fig. 6).
4. Discussion
There are various direct and indirect methods to estimate the value of ecosystem services,. Many of these vary in the resources, both financial and human, that they require, but also in the accuracy and precision of the results that are produced.
As noted before, the majority (74.5%) of Bhutan is covered in forest. Bhutan’s constitution mandates ‘‘a minimum of 60% of the total land under forest cover for all times to come.’’ Today 43% of the total land area is contained within the Protected Areas system with an additional 7 percent of the total designated as biological corridors (Royal Government of Bhutan, 2010). Cropland is the other critical land cover, as 69% of the population lives in rural settings (Royal Government of Bhutan, 2010).
Utilizing a geographical information system (GIS) allows us not only to determine the value of ecosystem services in the country as a whole but also the specific locations of the most Fig. 2.Ecosystem service values in Bhutan. An overlay of the values and the land cover types, estimating total values for each area of Bhutan.
1
One previous estimate of the value of ecosystem services in Bhutan was part of a global analysis (Sutton and Costanza, 2002). This estimate was based on much less precise global land use data and a less complete data set of per hectare values. Converted to $US2005, this estimate was $3.5 billion/yr. This is consistent with our expectation that as more and better data is accumulated, the estimated value of ecosystem services will increase, all else being equal. Therefore, our current estimate is almost certainly still a conservative one.
valuable ecosystems. For example, we see in Fig. 3that inland wetlands, mostly located in the eastern part of the country, are very valuable. Such knowledge allows for appropriate policies to ensure that those ecosystems are conserved.
Fig. 6 shows that the majority (53%) of ecosystem services created within Bhutan benefit people outside the country of Bhutan. As of today, very few successful institutions or mechan-isms have successfully captured compensation for values that flow across political boundaries. One recommendation is that, as a start, Bhutan enters these values in their government’s accounts as foreign aid. Such forms of aid, especially to developing countries, is more valuable than military aid.
While this analysis provides much information about the approximate value and location of ecosystem services in Bhutan, more elaborate analyses are necessary to define more accurate values and more precise locations and influences of the services. It will also be necessary to determine the condition of the ecosys-tems and the change in their state over time. The condition of an ecosystem determines the amount of services it can provide. This condition may vary across a single ecosystem. Benefit transfer
assumes a constant average condition of the ecosystems as it integrates multiple values from multiple studies, which have varying conditions. Such qualitative changes will affect the value of the services the ecosystems provide.
Further analysis is necessary and will require multiple phases, utilizing various techniques and requiring increasing resources. With each level, the values become more precise and accurate, but also more data intensive and expensive to estimate. Four levels of ecosystem service analysis have been defined as follows:
4.1. Level 1: basic value transfer
Value transfer is the process of utilizing societies’ stock of knowledge rather then doing original research to determine the ecosystem service values (Loomis and Rosenberger, 2006). The process transposes the monetary values of ecosystem services estimated at one site, through market-based or non-market-based economic valuation techniques, to another site (Roy, 2000).
Although this form of analysis is used in studies at all scales (Costanza et al., 1997;Liu et al., 2010;Troy and Wilson, 2006), Fig. 3.Ecosystem service values in Bhutan in various value ranges.Fig. 2split up into six individual maps, each one showing one of the six value categories.
basic value transfer has both significant limitations and advan-tages. The greatest advantage is its cost-effectiveness (Navrud and Ready, 2007). Because it utilizes previously completed ecosystem service valuations, the transferring of these values takes minimal time and effort since it assumes that the values are constant over the ecosystem type. This assumption presents a potential mis-calculation since most ecosystems are different and the popula-tions that the services benefit vary greatly as well.
Basic value transfer, which is used in this preliminary study, is usually used as an initial, crude means of determining the value of the ecosystem services in a given area to an approximate order
of magnitude. It is the least expensive and also the least precise analysis type.
4.2. Level 2: expert modified value transfer
Although similar to a basic value transfer analysis, this analysis requires experts, with knowledge of the local ecosystem condi-tions, to adjust the transposed values to apply to the local site more directly. Such an analysis is more expensive than the basic value transfer, but does provide values that are more accurate and precise than just a basic value transfer. It does not, however, Fig. 5.Ranges of ecosystem service for nine ecosystems in Bhutan, in US dollars per year. Stars show means.
Fig. 4.Ranges of ecosystem service values per hectare per year. Stars show means.
require primary data collection and is less expensive than on the ground original research. One example of this approach isBatker et al. (2008).
4.3. Level 3: statistical value transfer
By compiling valuation studies into a meta-analysis and build-ing a statistical model of spatial and other dependencies in valuation studies, more accurate and precise values can be deter-mined. Such statistical models are used to identify which land-scape characteristics, valuation methods, study sites, etc. have the greatest effect on the estimated ecosystem services it provides. By knowing the contribution of these characteristics to the value of the ecosystem service, the variance can be better attributed to different sources, and more accurate values thereby obtained. One example of this approach isLiu and Stern (2008).
4.4. Level 4: spatially explicit functional modeling
The modeling of ecosystems allows for a more complete accounting of the interconnected factors that contribute to the value of ecosystem services along with their spatial patterns and dynamics. These factors must include the human population density and the society that benefits from the ecosystem services. For example, modeling allows for the quantification of the effects of varying environmental conditions derived from land use change over time. These models can be presented in multiple forms, including statistical (Costanza et al., 2008) and as dynamic systems simulations (Boumans et al., 2002).
Spatially explicit functional modeling is the most time con-suming and expensive of the four levels of analysis. However, it provides temporal information, spatially detailed information, and the ability to run scenarios to improve management.
Ultimately, determining the contribution of ecosystem ser-vices to sustainable human well-being is the end goal of valua-tion. Bhutan, utilizing GNH as their measure of well-being, has begun the process of such integration. Environment is one out of the nine domains in GNH making it critical to determine how natural capital and ecosystems services contribute both directly and in interaction with the other eight domains, to sustainable human well-being .
The next steps in Bhutan are to undertake more accurate valuations of the country’s ecosystem services. This will require on-the-ground data collection by the various ministries, agencies, and offices in the Bhutan government. Such data collection and
valuation can be done through various approaches including revealed-preference, stated-preference, and cost-based methods (Farber et al., 2006). In the hopes of incorporating the value of ecosystem services into the yearly national accounts, regular data collection will have to be done to assess the changes in the condition and quality of the country’s ecosystem services.
5. Conclusions
Our initial estimates of the value of ecosystem services using simple benefit transfer techniques have shown that these benefits are a significant contributor to human well-being in Bhutan. Forests represent by far the largest contributor to ecosystem services, and Bhutan has pledged to be a global carbon dioxide sink in perpetuity by preserving its forest cover. Other ecosys-tems, like lakes and rivers and inland wetlands are very valuable per ha, but occupy fairly small areas of the country.
These initial estimates highlight the value of ecosystem services in Bhutan, and set the stage for more elaborate and precise estimates to follow.
Acknowledgments
We would like to acknowledge the government of Bhutan, and specifically the National Statistics Bureau, for its assistance in providing data and background information. We thank Dr. Ronald Colman for his inspiration and assistance in bringing this project about. We also thank Dr. Joshua Farley for all his reviews and feedback on the paper.
References
Batker, D., Swedeen, P., Costanza, R., Torre, I.de la Boumans, R., Bagstad, K., 2008. A new view of the Puget Sound Economy: the economic value of nature’s services in the Puget Sound basin. Earth Economics, Tacoma, WA. /http://
www.eartheconomics.org/projects/PugetSound/index.htmlS.
Beddoe, R., Costanza, R., Farley, J., Garza, E., Kent, J., Kubiszewski, I., Martinez, L., McCowen, T., Murphy, K., Myers, N., Ogden, Z., Stapleton, K., Woodward, J., 2009. Overcoming systemic roadblocks to sustainability: The evolutionary redesign of worldviews, institutions, and technologies. Proceedings of the National Academy of Sciences 106 (8), 2483–2489.
Boumans, R., Costanza, R., Farley, J., Wilson, M.A., Portela, R., Rotmans, J., Villa, F., Grasso, M., 2002. Modeling the dynamics of the integrated earth system and the value of global ecosystem services using the GUMBO model. Ecological Economics 41 (3), 529–560.
Brookshire, D.S., Neill, H.R., 1992. Benefit transfers—conceptual and empirical issues. Water Resources Research 28, 651–655.
Costanza, R., Folke, C., 1997. Valuing ecosystem services with efficiency, fairness, and sustainability as goals. In: Nature’s Services: Societal Dependence on Natural EcosystemsG. C. Daily, Island Press, Washington D.C.
Costanza, R., d’Arge, R., de Groot, R., Farber, S., Grasso, M., Hannon, B., Naeem, S., et al., 1997. The value of the world’s ecosystem services and natural capital. Nature 387, 253–260.
Costanza, R., Pe´rez-Maqueo, O., Martinez, L.M., Sutton, P., Anderson, S.J., Mulder, K., 2008. The value of coastal Wetlands for Hurricane Protection. Ambio. 37 (4), 241–248.
Daly, H.E., Cobb, C., 1989. For the common good. Beacon Press.
de Groot, R., Brander, L., van der Ploeg, S., Costanza, R., Bernard, F., Braat, L., Christie, M., Crossman, N., Ghermandi, A., Hein, L., Hussain, S., Kumar, P., McVittie, A., Portela, R., Rodriguez, L.C., Brink, P. ten, van Beukering, P., 2012. Global estimates of the value of ecosystems and their services in monetary units. Ecosystem Services 1 (1), 50–61.
Desvouges, W., Johnson, F., Banzhaf, H., 1998. Environmental policy analysis with limited information: Principles and applications of the transfer method. Edward Elgar Publishing, Northampton, MA.
Easterlin, R., 2003. Explaining Happiness. Proceedings of the National Academy of Sciences 100, 11,176–11,183.
Farber, S., Costanza, R., et al., 2006. Linking ecology and economics for ecosystem management. BioScience 56 (2), 121–133.
Herna´ndez-Murillo, R., Martinek, C.J., 2010. The dismal science tackles happiness data. The Regional Economist, 14–15.
Lawn, P.A., 2005. An Assessment of the Valuation Methods Used to Calculate the Index of Sustainable Economic Welfare (ISEW), Genuine Progress Indicator Fig. 6.Distribution of who benefits from services provided by Bhutan’s ecosystems.
(GPI), and Sustainable Net Benefit Index (SNBI). Environment, Development, and Sustainability 7, 185–208.
Layard, R., 2005. Happiness: lessons from a new science. Penguin, pp. 309. Liu, S., Stern, D.I., 2008. A meta-analysis of contingent valuation studies in coastal
and near-shore marine ecosystems. Socio-Economics and the Environment in Discussion, CSIRO Working Paper Series.
Liu, S., Robert, C., Stephen, F., Austin, T., 2010. Valuing ecosystem services. Annals of the New York Academy of Sciences 1185, 54–78.
Loomis, J.B., Rosenberger, R.S., 2006. Reducing barriers in future benefit transfers: Needed improvements in primary study design and reporting. Ecological Economics 60 (2), 343–350.
Ministry of Agriculture and Forest, 2012. National Forest Policy of Bhutan. Thimphu. Navrud, S., Ready, R., 2007. Lessons learned for environmental value transfer. In: Navrud, S., Ready, R. (Eds.), Environmental value transfer: issues and methods. Springer, Dordrecht, The Netherlands, pp. 283–290.
Rosenberger, R.S., Loomis, J.B., 2003. Benefit transfer. In: Champ, P.A., Boyle, K.J., Brown, T.C. (Eds.), A primer on nonmarket valuation. Kluwer Academic Publishers, Dordrecht, The Netherlands, pp. 445–483.
Roy, B., 2000. Environmental value transfer: state of the art and future prospects. Ecological Economics 32 (1), 137–152.
Royal Government of Bhutan, 2010. National Forest Policy of Bhutan. Ministry of Agriculture and Forests.
Sutton, P.C., Costanza., R., 2002. Global estimates of market and non-market values derived from nighttime satellite imagery, land use, and ecosystem service valuation. Ecological Economics 41, 509–527.
Tobgay, S., 2005. Small Farmers and the Food System in Bhutan. Ministry of Agriculture, Royal Government of Bhutan.
Troy, A., Wilson, M.A., 2006. Mapping ecosystem services: Practical challenges and opportunities in linking GIS and value transfer. Ecological Economics 60 (2), 435–449.
Wilson, M.A., Hoehn, J.P., 2006. Valuing environmental goods and services using benefit transfer: the state-of-the art and science. Ecological Economics 60, 335–342.