Nociesed jyv fire U. S. -i.4parrie. ,x1
girraCtis4"41.1
Reprinted from AGRONOMY JOURNAL Vol. 68, January-February 1976, p. 49-55
Sugarbeet Yield and Quality as Affected by Nitrogen Level
Sugarbeet Yield and Quality as Affected by Nitrogen Lever
J. N. Carter, D. T. Westermann, and M. E. Jensen 2
ABSTRACT
Thii study was conducted, under several climatic and soil conditions, to determine the effect of N level on
beet yield and quality and to further develop and me both soil and tissue test methods for predicting N
fertilizer needs for efficient refined sucrose production. Previous studies indicate that N fertilizer needs for
=Wm= sucrose production may be predicted by con.
sidering yieldpotential and all N sources.
SuFarbeets (Beta vulgaris L.) were grown under field
conditions at N fertilizer levels varying from 0 to 448 kg N/ha on six sites throughout southern Idaho to de. termine root yield, sucrose percentages, sucrose yield, purity index, and plant N uptake in relation to the
re-sidual NO•N, mineralizable N, fertilizer N, and petiole
NOr N. These experiments demonstrated that the N fer• tither needs of sugarbeets can be determined by relating the root yield potential to the measured residual NOrN plus a measured or estimated mineralizable N level for an area. Optimum N level from all available soil and fertilizer sources has been found to vary between 5 to 6 kg/metric ton of beet roots produced. Using data from the current experiment and a previous study, N fertilizer could be predicted within 56 kg N/ha of that needed for maximum sucrose yield in 85% of the sites using measured NOrN and mineralizable N levels, 67% using measured NO•N and average mineralizable N levels, and only 12.5% using recommendations by fieldmen. Linear cow+ relations were found between the total available N, total -plant N uptake, other -plant N variables, and root quality factors, like percentage sucrose and imErti7 in-dex. These relationships confirm previous fin and will be useful for predicting root quality, optimum arrest date, and for verifying recommended fertilization prat. tiers. The use of the proposed soil and tissue test will improve root quality and sucrose production, as well as production rigs:1mq, that will economically benefit the consumer, producer, and manufacturer.
Additicomi index words: N test, Petiole analysis, N uptake.
N
ITROGEN has the greatest influence of all the mineral elements on root quality and sucrose production of sugarbeets (Beta vulgarts L.). Sugar-beets grown with inadequate N generally have a high sucrose percentage and low impurities, but root and sucrose production are limited. Too much N increases root impurities while reducing sucrose percentage and, consequently, limits refined sucrose production (7). Optimum amounts of soil and fertilizer N are desir-able for adequate top and root growth, while main-taining sufficiently high sucrose percentage and purity for profitable sucrose extraction and yield. •
Soils vary widely in their ability to supply N for plant growth. This N-supplying potential varies with soil type, past fertilization. and cropping history, as well as rainfall received and the irrigation water ap-plied that affects the extent of N loss by leaching from soils (6, 13).
'Contribution from the Western Reeon, ARS-USDA; Univ. of Idaho College of Agriculture Research and Extension Center cooperating. Received 25 Apr. 1975.
*Soil scientists and agricultural engineer, respectively, Snake River Conservation Research Center, Kimberly, It) 83341.
Most N fertilizer recommendations are based on past fertilization and cropping histories. Although some of these recommendations are reliable, many have been found to be excessive in southern Idaho (6). There is need for using both soil and tissue testing procedures for accurate fertilizer recommendations for maximum sucrose production and profits.
Methoils have been developed for predicting N fer-tilizer needs for sugarbeets based on the amount of NO3-N in the root zone (8, 11). However, mineraliz-able N has been found to be a major supplier of N for plant growth and to vary widely from one area to an-other (6, 13). For a N fertilizer prediction procedure based on a soil test to be applicable over a wide area with many soil types and management conditions, an estimate or measurement of mineralizable N is also needed. Recently, methods have been proposed (3) for more accurate recommendations that consider both the mineralizable N and NO8-N. The objective of these experiments, under several climatic and soil condi-tions, was to further develop and refine these methods for predicting N fertilizer needs for maximum refined sucrose production.
THEORY AND BASIC RELATIONS
Previous studies have shown that for maximum sucrose yields, the N- requirement is 5.5 0.5 kg/metric ton of beet roots (3,
6). The upper limit of 6 kg N/metric ton of fresh beet roots was used in this study because farm managers generally apply more irrigation water than needed for maximum production, causing N loss below the root zone. At this rate, the potential yield, Y (metric ton/ha), for a sugarbeet field, if limited by N, will be:
Y = Nr/6, NT/6 < Yz [la]
or Y/YI, = NTAYso NT t 6Y5 [lb]
Where Ys is the expected maximum yield under a given man-agement level and climatic zone when N is not limiting (ob-tained from individual farm records), NT (kg/ha) is the total
net N available to the crop, determined as follows:
N
T=
E iN t a.N. a..N. N,where E, = efficiency of applied N fertilizer (NO. crop extractable NOrN
NOEN in the soil depth sampled N. = soil NO.-N in the soil depth sampled
crop extractable mineralizable N
a„, X
field mineralizable N in soil depth sampled field Min. N
lab. Min. N
N,, = mineralizable N in the soil depth sampled, as determined by the laboratory mineralization tests N, = N immobilized or added by residue incorporated, N, (n — n.)R, where n = N content of the residue when incorporated, n, = expected N con-tent in the residue at the end of the season, and R = residue added.
Detailed studies have indicated that when a Portneuf siIt loam
soil in southcentral Idaho near Twin Falls was sampled to the cemented zone, E t = 0.65, a. = 1.2, and a., = 0.95 (3). These values were used throughout this study.
[2]
90 PO Lat0t1 60 Beans 55 Peas 45 Barleyt 50 Potatoes 38 Beets Previous mop Root zone. Initial N application
Surface soil properties (0-15 cm)
PH OH N
Designation Subgroup and Family Soil classification
an • —
Bahem vfsl
Power sil
Pormeuf iii Por tneur sil
Portneuf se Pancheti
Southwestern Xerollic Calciorthid* Xerollic Haplargid §
South Central Xcrollic Calciorthidi Xerollic Calciorthidi Southeastern
Xerollic Calciorthidi Xerollic CaIcier thid II
8.0 0.7 0.05 7.7 1.3 0.10
7.7 1.4 0.09 7.7 1.4 0.10
7.8 1.5 0.08 8.0 1.5 0.10 Site
no. Approximateelevation
m 20 730 21 750 110 1,220 111 1,190 220 1,570 222 1,460 Spring Spring Fall Fall Spring Spring
Table I. Classification, previous crop, and soil properties of experimental sites used in the N study in southern Idaho.
§ Fine-silty, mixed, mesic. • Soil depth to hardpan or 150 cm. t Straw burned. 4. Coarse-silty, mixed, mask:
Coarse•loamy, mixed, =sic. II Coarse-silty, mixed, frigid.
The change in the N content of the residue during the grow-ing season, (n n.), combined with the efficiency of fertilizer N to compensate for this change, (n n.)/Et, was reported as —7.5 kg N/metric ton of straw (R.) in southern Idaho (12). If El is also assumed to be 0.65 when N fertilizer is added to
compensate for the incorporated straw and (ce.Nn a.N. — 5 R.) < 6Y., the N fertilizer needed to make up the deficit for maximum sucrose yields, 6 (Y. — Y), will be:
6Y. — (o.N. cr.N. — 5 R,)
where Nt is the N fertilizer/ha needed, Et is the expected N fertilizer efficiency (expressed as a fraction), and R. is straw in metric tons/ha. After harvest, the yield response to N. can be evaluated by substituting Y„,.. for Y. in equation lib),
MATERIALS AND METHODS
Six experiments were established throughout southern Idaho during the late fall of 1971 and early spring of 1972 (Table 1). The experimental sites, each with two replications, were lo-cated midway between the upper and lower ends of irrigated sugarbeet fields. The plots were fertilized with Ca (NO,)1 at rates of 0, 112, and 224 k N/ha at two sites in the fall (fall plots), and at four other sites in the spring (spring plots). Fall plots were split by adding 0, 112, and 224 kg N/ha as NI-1,NO. _in late spring of 1972, while spring plots were split with 0, 56,
and 112 kg N/ha. The irrigation variable mit Site No. 111 re-ceived 0, 112, and 224 kg N/ha of spring-applied, N only. The dimensions of the split plots were 6.1 by 10 m. Phosphorus was applied at a blanket rate of 50 kg P/ha at each location. Other nutrients, except N, were considered adequate for sugarbeet growth. All cultural operations were uniform for each site, and fertilizer was broadcast and disked into the surface 8 to 10 cm after application.
Each fail and spring plot was sampled to a 150-cm depth or to the hardpan in the late spring before planting and again in the fall, of 1972. Twenty-four cores per treatment were corn-posited by 15-cm depth increments to the 60-cm depth and by 30-cm depth increments below that depth. In addition, one 5-cm diameter auger sample was taken for each fertilizer treat-ment from the 45- to 150-cm depth. The soil samples were air dried, ground, and stored until analyzed. The potentially avail-able soil N was determined as previously described (3, 6).
Part of the soil samples. taken in the spring following the initial fertilizer application were inadvertently contaminated with ammonium during drying. Essentially no difference was found in the mineralization capacity between the uncontami-nated samples taken in the spring and those taken in the fall. For this reason, total available N for sugarbeet growth was de-termined by combining the initial NO.-N level found in the spring sampling with the mineralization capacity of the fall samples.
An irrigation variable on three rates of applied N was added to Site No. 111 only. Approximately 45 cm-of irrigation water was applied in mid-July and water was applied to every furrow instead of alternate furrows during the remainder of the season. Irrigations of all other experiments, including the main part of
Site No. 111, were applied to alternate furrows and were the same as those applied by the farm manager.
Twenty-four of the youngest, fully mature petioles were ran• domly sampled from each plot several times during the season. The petioles were cut into 0.5 cm sections, dried at 65C, ground to pass through a 40-mesh sieve, subsampled, and analyzed for NO.-N using a nitrate specific ion electrode (10).
The beet tops, crowns, and roots from six uniform S•m sections of row were harvested from each treatment at the end of the season to determine root yield, sucrose percentage, sucrose yield, impurity index, and total N uptake. Impurity index (2) and sucrose content were determined on two samples (14 kg each) of randomly selected roots from each plot by a sugar company, using their standard procedures. The beet pulp (collected dur-ing sucrose analysis), tops, and crowns were dried at 65C and their dry matter was determined. The dried samples were ground to pass a 40-mesh sieve, and total N in the samples was determined by the semimicro-Kjeldahl procedure modified to in-clude nitrate (I). Nitrogen uptake was determined by assuming that the percentage N was the same in the fibrous and storage roots, and that the fibrous roots constituted 25% of the total harvested root weight (9).
The field numbers, location, soil classifications, previous crop, and surface soil properties of the six experimental sites are given in Table 1. Soil pH was determined using a glass elec-trode measurement in a soil-water saturated paste, percentage organic matter (OM) by a modified method of Walkley and Black (15), and percent total soil N by the Kjeldahl procedure modified to include nitrate.
RESULTS AND DISCUSSION
Considerable difficulty was encountered in relating the change in the preplant soil NO 3•N test to the amount of fertilizer N applied either in the fall or early spring. This was believed to be due partially to soil samplin* problems caused by the movement of the fall-applied N into the hardpan and the uneven distribution with depth of the early spring•applied N. For this reason, the average and anN 0 levels from the entire untreated area, pIus 65% of the added fertilizer N, were assumed to represent total available N (N T). In addition, data from similar fall and spring treatments were combined, since there were no signifi-cant differences between times of N application and plant response (low—winter rainfall).
Results from the current and previous studies in southern Idaho, and other sugarbeet producing areas (3, 4, 6, 8, 11), have shown that sugarbeet root yield is increased by adding N fertilizer when N is limiting, and sometimes the yield may be decreased when ex-cessive N is used, which was probably caused by the increased top growth (Fig. 1). These results also clear-ly show that the percentage sucrose decreases linearly N1
SITE 20 •-• 51TE 21
I I
51TE HO SITE III
11
425 571 279 425
304 450 158 304
NT (kg Who) 340
n 34 404 202 494 202 340 494
with NT. Sucrose yield followed a production pattern
similar to root yield with maximum sucrose yield and profits at a NT value slightly less than that required for maximum root yield.
The results obtained in this study show that the
NT needed for maximum root and sucrose yields can
be predicted over a wide range in climatic condi-tions with corresponding large differences in yield potentials. Growing degree days [GDD = (max. temp. ,C 25C + min. temp. 4.44)/2 — 4.44C] a
3 D. 0. Everson. ]975. Growing degree day system for Idaho. Mimeographed. Univ. of Idaho, Moscow.
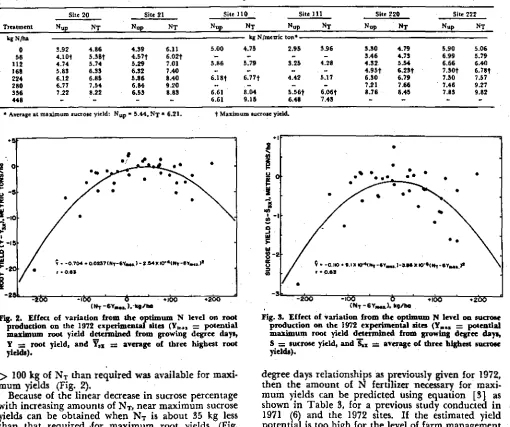
ranged from 2,040 to 2,450C-days (accumulated from March 1 to Oct. 24) in this study and maximum sugar-beet root yields were linearly related to GDD in 1972 (Y„,„ =. —83.3 0.063 GDD, r = 0.99). These data indicate that in southern Idaho where solar radiation levels are similar, temperature and length of growing season caused by elevation differences seem to govern the yield potential. Therefore, when assuming 6 kg/ ha of NT are required per metric ton of beet roots, and using the linear equation for obtaining maximum root yield in 1972, the data clearly indicate that root yield is limited when NT is less than required for maximum yield, and root yield may decrease when
Fig. 1. Effect of N level on root yield, percentage sucrose, sucrose yield, total N uptake, and dollar value of sugarbeets in southern Idaho. (Dollar value of crop was based on sucrose yield from the regression line at $0.55/14 of sucrose minus the fertilizer cost at
•
• • •
• • • • •
• • • •
• n
•
-0.704.0.0837(N T-6y...}-3.84xicr0111,-6V...,12
r • 0.48
-16o
-'so
6
flOo
.2009 • -0.10 41.1*erno.,-6v....1-assxo-t1 t1T -6y,..01
Table 2. The effect of N fertilizer level and location on N uptake (N„,) and total available N (NO/metric ton of beet roots.
Treatment
Site 20 Site 21 Site 310 Site 111 Site 220 Site 222
Nup NT Nup NT Nup NT Nur, NT Nup NT Nup NT
kg 14/ha kg Nimetric ton*
0
3.92 4.86 4.39 6.11 5.00 4.75 2.95 3.96 5.30 4.79 5.99 5.0656 4.101 5.3e4 4.57t 6.02t - - - - 3.46 4.73 6.99 5.79
112 4.74 5.74 5.29 7.01 5.86 5.79 3.25 4.28 4.32 5.54 6.66 6.40
168 5.83 6.33 6.32 7.40 - - - - 4.95t 6.23t 7.50t 6.781
224 4.12 6.85 5.86 8.40 6.181 6.771. 4.42 5.17 6.30 6.79 7.30 7.57
280 6.77 7.54 6.84 9.20
-- - 7.21 746 7.46 9.27
356 7.22 8.22 6.53 8.83 6.61 8.04 5.56t 6.061 8.76 8.45 7.83 9.82
448 - - - 6.61 9.15 6.48 7.43 - - -
-n Average at maximum sucrose yield: N 0 - 5.4-4. NT • 6.21. I Maximum sucrose yield.
).•119/ha
Fig. 2. Effect of variation from the optimum N level on root production on the 1972 experimental sites (Y„,„ = potential maximum root yield determined from growing degree days, Y = root yield, and V„z = average of three highest root yields).
> 100 kg of
NTthan required was available for
maxi-mum yields (Fig. 2).
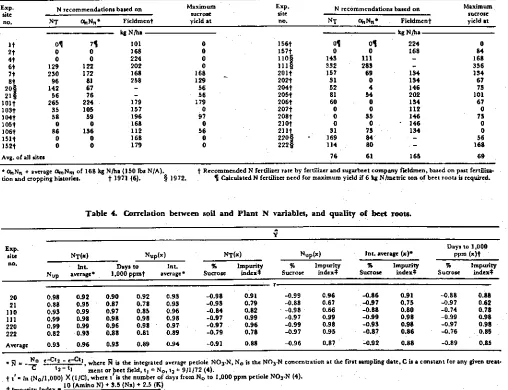
Because of the linear decrease in sucrose percentage
with increasing amounts of
NT,near maximum sucrose
yields can be obtained when
NTis about 35 kg less
than that required -for maximum root yields (Fig.
3). Thus, if the grower is paid for gross sucrose
pro-duction (root yield x % sucrose), he will obtain his
greatest net return by applying slightly less than that
amount of N fertilizer required for maximum root
yield. But he will rarely obtain this return if excess
N
fertilizer is applied because of increased fertilizer
cost and decreased sucrose yield (Fig.
1).The
fer-tilizer application cost and other cultural operations
will remain essentially constant.
The total N uptake (Nup) by the sugarbeet
dropwas linearly related
to NTat each of the six sites
(Fig. 1) with the amount of N., and
NT/Inetricton
of fresh beet roots varying with site and treatment
gable 2). Less N/metric ton was taken up under
deficient N conditions and more N with excess
avail-able N. The total plant N
upaveraged 5.4 kg and
NTaveraged 6.2 kg/metric ton of fresh roots at
maxi-mum sucrose yield. These values were approximately
the same as those reported previously (3, 6).
If the root yield potential for any sugarbeet field
is known from previous production records or can
be estimated from average maximum yield-growing
Fig. 3. Effect of variation from the optimum N level on sucrose production on the 1972 experimental sites (Y,.,.. = potential maximum root yield determined from growing degree days,
S = sucrose yield, and Sax = average of three highest sucrose yields).
degree days relationships as previously given for /972,
then the
amountof N fertilizer necessary for
maxi-mum yields can be predicted using equation [31 as
shown in Table 3, for a previous study conducted in
1971 (6) and the 1972 sites. If the estimated yield
potential is too high for the level of farm management
involved, or the root yield is limited due to insect
damage, disease, poor stands, other nutrient
defi-ciencies, or adverse climatic factors; then the N
fer-tilizer recommended and applied will be greater than
necessary and may reduce sucrose production.
Actu-ally, as shown in Fig. 2 and 3, maximum sucrose
production is obtained if
NTis slightly less than that
required for maximum root yields.
NT(S) Nup(x) nix)
Days to 1,000 131),0 (x)t Nupfr) Int. average (x)•
• 04.,N,, + average %prim of 168 kg Whit (150 Ibe N/A). t Recommended N fertilizer rate by fertilizer and sugarbeet company fieldmen, based on past fertiliza-tion and cropping histories. t 1971 (6). § 1972. 1 Calculated N fertilizer need for maximum yield if 6 kg IV/metric ton of beet roots is required.
Table 4. Correlation between soil and Plant N variables, and quality of beet roots.
Nup average' 1,000 ppm[ average n Sucrose index* Sucrose index* Sucrose index* Sucrose Impurityindex* Exp.
site
no. Int. Days to Int. 96 Impurity Impurity Impurity
Exp. site no.
N recommendations based on
NT Tickirnen$ It 2$ 4$ kg Nth' 01 0 0 71 0 0 101 168 224
6$ 129 122 202
7$ 230 172 168
96 81 258
81
20 142 67
-21 56 76
-101t 265 224 179
1031' 35 105 157
104$ 58 59 196
1051 0 0 168
106$ 86 136 112
151$ 0 0 16B
152$ 0 0 179
Avg. of all sites
Maximum sucrose yield at
O 156$ 01
O 157$ 0
0 110 143
O 111 § 232
168 201$ 157
129 202$ 31
56 204$ 52
• 56 205$ 81
179 206$ 60
. 0 2071. 0
97 208# • 0
0 210$ 0
56 0
O
2111 31
220 222 169 114 Exp. site
TO. NT a,,Ne • Fieldrnen$
4 54 0 0 35 0 73 84 80
76 61
N recommendations based on
111 283 69 0 01 0 kg N/ha 224 168 134 134 146 202 134 112 146 146 134 168 Maximum sucrose yield at 84 168 356 134 67 73 101 67 0 73 56 168 69 0 0 0
Table B. Available N, N fertilizer recommendations, and N fertilizer level at maximum sucrose yield on the 1971 and 1972
experi-mental sites.
--0.98 0.91 -0.99 0.96 -0.86 0.91 -0.88 0.88 -0.95 0.79 -0.88 0.67 -0.97 0.75 -0.97 0.62 -0.64 0.82 -0.98 0.66 -0.88 0.80 -0.74 0.78 -0.97 0.99 -0.97 0.99 -0.99 0.96 -0.99 0.98 -0.97 0.96 -0.99 0.98 -0.93 0.98 -0.97
09 -0,79 0.78 -0.97 0.95 -0.87 0.86 -0.76 0.8: -0.91 0.88 -0.96 0.87 -0.92 0.88 -3.89 0.85
No t-Ct2 - c-t1,
-• 171 12 _ t_ , where N is the integrated average pepetioleNO3.1,1, No is the Nn3-N concentration at the first sampling date, C is a constant for any given treat. ment or beet field, t, = No, t2 r 9/1/72 (4).
t (No/1,000) X (1/C), where I' is the number of days from No to 1,000 ppm petiole NO3-N (4). 10 (Amino N) + 3.5 (Na) + 2.5 (K)
4 impurity index = Sucrose %
20 0.98 0.92 0.90 0.92 0.93
21 0.88 0.95 0.87 0.78 0.93
110 0.93 0.99 0.97 0.85 0.96 111 0.99 0.98 0.9B 0.98 0.98 220 0.99 0.99 0.96 0.98 0.97 222 0.82 0.93 0.88 0.81 0.89
Average 0.93 0.96 0.93 0.89 0.94
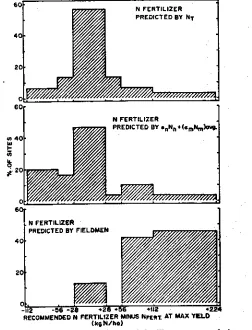
data shown in Fig. 4 include the results from this study in addition to those from a similar previous study conducted in 1971 (6). Predictions were within 56 kg N/ha of that needed for maximum sucrose yield in 83% of the sites using NT, 67% using
anNn
the
average amNm, and only 12.5% using recommenda-tions by fieldmen. Using an average mineralization value was nearly as accurate as using the measured value for most sites. The largest deviation in predict-ing N needs by the average value occurred where there were large variations from the average mineralization capacity of the soil involved.The frequency distribution of differences in increas-ed returns from sucrose production using N fertilizer . recommendations based on NT as compared to those
made by fieldmen for the 1971 study (6) is given in Fig. 5. The average gain by the use of NT would
be $280/ha ($113/acre) with an average decrease of N fertilizer of 110 kg/ha (98 lbs/acre). If these 24 experimental sites are representative of the sugarbeet fields, and if N fertilization practices • on sugarbeets have not changed substantially since 1972, then the
overall annual gain by use of NT as proposed would be near $19 million in southern Idaho alone (69,230 ha). The cost of soil sampling and testing would de-pend upon field size and soil variability but in most cases would be minimal in comparison with the bene-fits. There would also be a furdier gain in the return to the grower by using NT since he is normally paid for the refined sucrose produced. Excess N, that is normally applied without a soil test, reduces the ex-tractable sucrose because of high root impurities. Potential increase in returns to the grower is so large that an investment in a soil test for NO 3-N and min-eralizable N, utilizing a representative soil sample from the field in question, would usually return many-fold profits to the growers in southern Idaho.
N FERTILIZER
PREDICTED BY onNektrhNtdow.
N FERTILIZER
PREDICTED BY FIELDMEN
40
2
r
o
-112 -s6 -z6 426 46 +112 n224
RECOMMENDED N FERTILIZER MINUS knit AT MAX VELD
isa Niko)
Fig. 4. Frequency distribution of N fertilizer recommendations when compared to that required for maximum sucrose yield on 24 'Sites in 1971 and 6 sites in 1972.
are also apparent. Plant tissue analyses are used to monitor the current status of N available to the plant and the scheduling of harvesting operations. There is also a high degree of correlation on, most sites be-tween these N variables and quality factors of sugar-beets, like percentage sucrose and impurity index. These data further support the conclusions of other studies in southern Idaho which showed that both yield and quality of sugarbeets could bepredicted using these soils and plant variables (3, 4, 6).
Previous publications indicated that excessive irri-gation water applied early in the season significantly influences the yield when N was limited (4); but excess irrigation water applied late in the season, when the NO3-N concentration in the soil was lowest, had little effect on sucrose percentage (5). In this study, excess irrigation water was applied in midseason, but it also had very little effect on yield or plant N variables. Apparently, on this site, the NO3-N con-centration in the soil was sufficiently depleted on all treatments so that very little NO TN was leached below the root zone where it could not be recovered by the roots. This is further verified by previous unpublished data which showed that the concentration of NO3-N in the soil solution at the 1-m depth was < 0.03 mg/ml by August 1. The majority of the potentially avail-able N for the balance of the season was probably still present in mineralization form, therefore
unavail-able for leaching.
0
-200 0 .200 4400 +600 +500 *1000 .1200 DISTRIBUTION OF RETURNS ss DOLLARS/Da [(Y./ phi-Nip - tri(Fro- NO/ Fig. 5. Frequency distribution of the difference in increased
returns from sucrose production when using N fertilizer rec-ommendations based on a soil test (NT) as compared to those made by fieldmen (F„,) on 24 sites in 1971 (1% = sucrose yield at $9.55/kg, N t = N fertilizer at $0.66/kg).
The rate of decrease in percentage sucrose (S) de-pended upon the rate of increase in total plant N up
A
with fertilizer additions [Y(LS/AN T) = 0.0018 0.0015 (ANup/ANI), r = 0.94] (Fig. I). This sup-ports previous findings (4) that sucrose concentration may be influenced more by the maximum rate of N u, early in the season than the N available later in the season. This is further suggested by the data re-ported by Hills and Ulrich (7), and Storer et al. (14), which showed that differences in sucrose percentage are established at an early date. Other experimental data obtained in Idaho also support this hypothesis. For example, effect of N leaching was small with ex-cessive irrigation water during midseason in this study and late in the season in an earlier study (5).
ACKNOWLEDGMENT
The authors express appreciation to Mr. Darrell L. Gallup, State Soil Scientist, Soil Conservation Service, and his staff for assistance in the soil classification, and to S. M. Bosnia, S. E. Crothers, and B. J. Ruffing for their invaluable assistance in the field and laboratory work.
LITERATURE CITED
I. Bremner, J. M. 1965. Inorganic forms of nitrogen. In C. A. Black (ed.) Methods of soil analysis. Part 2. Agronomy 9:1179-1237. Am. Soc. Agron., Madison, Wis.
.2. Carruthers, A., J. F. T. OldfieId, and H. J. Teague. 1962. Assessment of beet quality. 15th Ann. Tech. Conf. of the British Sugar Corp., Ltd., Nottingham, England.
3. Carter, J, N., M. E. Jensen. and S. M. Bosma. 1974. Deter-mining nitrogen fertilizer needs for sugarbeets from residual soil nitrate and mineralizable nitrogen. Agron. J. 66:319-323. 4. -, M. E. Jensen, B. J. Ruffing, S. M. Bosnia, and A.
W. Richards. 1972. Effect of nitrogen and irrigation on sugarbeet production in southern Idaho. J. Am. Soc. Sugar Beet Technol. 17:5-14.
5. -, C. H. Pair, and S. M. Bosma. 1971. Effect of irri-gation method and leaching of nitrate-nitrogen on sucrose production by sugarbeets. Proc. 22nd Ann. Fert. Conf. of the Pac. NW, Bozeman, Mont., July 13-15.
6. -, D. T. Westermann, M. E. Jensen, and S. M. Bosma. 1975. Predicting nitrogen fertilizer needs for sugarbeets from residual nitrate and mineralizable nitrogen. J. Am. Soc. Sugar Beet Technol. 18:232-244.
7. Hills, F. Jackson, and Albert Ulrich. 1971. Nitrogen nutri-tion. p. 112. 135. In R. T. Johnson, J. T. Alexander, G. E. Rush, and G. R. Hawkes (eds.) Advances in sugarbeet pro-duction: principles and practices. The Iowa State Univ. Press, Ames, Iowa.
8. James, D. W., A. W. Richards, W. H. Weaver, and R. L Reeder. 1971. Residual soil nitrate measurements as a basis for managing nitrogen fertilizer practices for sugar-beets. J. Am. Soc. Sugar Beet Technol. 16:313-322. 9. Kelley, J. D., and A. Ulrich. 1966. Distribution of nitrate
nitrogen in the blades and petioles of sugarbeets grown at deficient and sufficient levels of nitrogen. J. Am. Soc. Sugar Beet Technol. 14:106-116.
10. Milham, P. J., A. S. Awad, R. E. Paull, and J. H. Bull. 1970. Analysis of plant, soils and waters for nitrate by using an ion-selective electrode. Analyst 95:751-757.
11. Reuss, J. 0., and P. S. C. Rao. 1971. Soil nitrate nitrogen levels as an index of nitrogen fertilizer needs of sugarbeets. J. Am. Soc. Sugar Beet Technol. 16:461-470.
12. Smith, J. H., C. L. Douglas. and M. J. LeBaron. 1973. In-fluence of straw application rates, plowing dates, and ni-trogen applications on yield and chemical composition of sugarbeets. Agron. J. 65:797-800.
13. Stanford, George, and S. J. Smith. 1972. Nitrogen mineraliza-tion potentials of soils. Soil Sci. Soc. Am. Proc. 36:465-472. 14. Storer, K. R., W. R. Schmehl, and R. J. Hecker. 1970. Quantitative growth studies with sugarbeets, Beta vulgaris.
J. Am. Soc. Sugar Beet. Technol. 15:709-725.