Annex I
Power Grid Electrocution: A Risk to Primates in Rural,
Suburban and Urban Environments
Medium-sized mammals rarely endure in anthropogenic environments. Primates are an exception, as they occur in a number of towns and cities in Africa, Asia, and Central and South America. In areas with a matrix of human development, indigenous trees and green spaces, primates can successfully persist as either urban exploiters or urban adaptors, often transforming such locations into important conservation centers. These settings are not free from danger, however. Among the threats to primates is power infrastructure. While overhead distribution lines may serve as aerial pathways for individual primates and groups, particularly in areas that are fraught with terres-trial hazards, they also pose a substantial risk of electrocution.
Numerous anecdotes and reports attribute primate injuries and deaths to electrocutions (Ampuero and Sá Lilian, 2012; Chetry et al., 2010; Rodrigues and Martinez, 2014; M. Ancrenaz, personal communication, 2017; S. Cheyne, personal communication, 2017). Given the difficulty of recording electrocutions, few studies have been able to quantify the impact of electrocutions on a population. Recently, however, researchers have begun to analyze electrocution data, identifying patterns based on primate species, size, age, sex and locomotion of victims, as well as seasonal variations in electrocutions (Katsis, 2017; Kumar and Kumar, 2015; Ram, Sharma and Rajpurohit, 2015; Slade, 2016).
The findings show that electrocutions occur in at least 28 species across eight primate families ranging from marmosets to orangutans (Slade and Cunneyworth, 2017, table 1). Electrocutions are not limited to arboreal spe-cies; they also affect those classified as terrestrial in their natural habitat, albeit at a lower rate. Mortality rates are generally high, as would be expected. Surviving individuals often have catastrophic injuries with poor to very poor prognoses, even with veterinary intervention (Kumar and Kumar, 2015; Slade, 2016).
A number of mitigation methods can be applied to address the animal welfare issues associated with electro-cutions. These vary in duration of effectiveness. As an emergency or short-term measure, pruning trees around transformers and power cables can serve to disassociate vegetation from the power grid (Lokschin et al., 2007). In the medium term, aerial bridges can be installed in strategic locations to provide alternatives to the use of
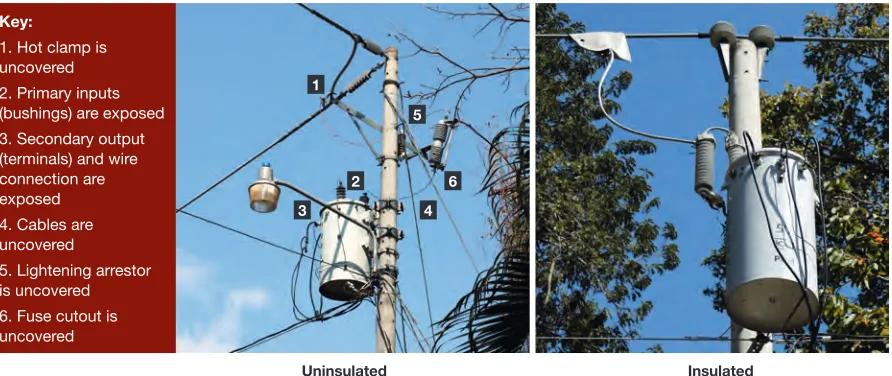
FIGURE AX.1
Uninsulated vs. Insulated Transformer
Key:
1. Hot clamp is uncovered 2. Primary inputs (bushings) are exposed 3. Secondary output (terminals) and wire connection are exposed 4. Cables are uncovered
5. Lightening arrestor is uncovered 6. Fuse cutout is uncovered
Uninsulated Insulated
(with protection equipment made of grey silicone rubber)
Source: Courtesy of Refuge for Wildlife (refugeforwildlife.org)
1
2 6
3 4
power cables (Jacobs, 2015; Lokschin et al., 2007). Insulating power cables and transformers in known electrocution hotspots is a long-term measure that can nearly eliminate the risk of electrocution (Printes, 1999; Refuge for Wildlife, n.d.; see Figure AX.1).
The financial burden of these mitigations generally lies solely with animal welfare organizations. As these organizations rely mostly on grants and donations, the monitoring and implementation of such measures is potentially unsustainable. Consequently, mitigations can have limited effectiveness, especially with the ongoing expansion of power infrastructure into new areas. Nevertheless, two initiatives have had encouraging results.
The first, the Programa Macacos Urbanos in Porto Alegre, Brazil, lodged a legal complaint against the state power company, citing primate electrocutions as an environmental crime. The judgment was entered in favor of the plaintiff and obliged the company to install approximately US$30,000 worth of insulation materials on the grid (Printes et al., 2010).
The second, Colobus Conservation in Diani, Kenya, worked with Kenya Power on identifying electrocution hotspots. The parastatal voluntarily insulated cables at a cost of US$115,000. The negative impact of the power infrastructure on primates violated Kenya Power’s code of ethics, which committed the company to addressing the issue in a substantive manner (J. Guda, personal communication, 2017).
Primate electrocutions have a cost implication for power distribution companies in terms of power infra-structure maintenance and associated customer power outages. Costs to a company for insulating cables can be offset to an extent that is dependent on the number of electrocutions in an area. Increased power reliability leads to improved customer good will, which is a benefit for a company.
Mitigation measures to prevent electrocutions are most effective when they are part of an integrated approach involving the state, power companies, residents, and animal welfare, conservation and research organizations. When these stakeholders work together, significant steps can be made towards creating valuable conservation areas in anthropogenic habitats.
Annex II
The Potential of the Global Forest Watch Platform to
Transform the Use of Satellite Imagery to Monitor
Tree Cover Loss
The detection of tree cover loss over time using satellite imagery allows for the location, visualization and compari-son of forest change before and after infrastructure development. However, using satellite data has historically required substantial expertise and funding to acquire, process and interpret the raw information.
For example, Curran et al. (2004) compiled, classified and manually edited images of Gunung Palung National Park in Indonesia at six time periods to document extensive “and accelerating” deforestation over 14 years. Similarly, Laporte et al. (2007) tracked the progression of logging roads in the Republic of Congo over more than 25 years by compiling, geometrically correcting and visually enhancing more than 300 Landsat images, and then manually digitizing and cross-checking each of the roads detected in the images. Gaveau et al. (2009a) analyzed 98 Landsat images to track deforestation in Sumatra from 1990 to 2000 and showed that protected areas lost some forest but promoted protection overall, both inside and outside their boundaries. Each of these efforts provided valuable evidence of the effects of human activity on forests, but the requisite effort and costs prevented widespread use of satellite data.
Global Forest Watch (GFW), a new forest change analysis platform, has transformed the monitoring process and increased access to the power of satellite imagery. It provides a publicly available tool for monitoring changes in ape habitat in near-real time (GFW, 2014; see Chapter 7). The global reach of this information enables GFW to provide a standardized way of analyzing change in tree cover, enabling comparison across sites.
Ape range stakeholders can use the online GFW tools to monitor ape habitat regularly, analyze tree cover loss and gain data for a country or protected area, create custom maps or download data for their target region. Users can upload or draw a specific area, such as a species range or road corridor, and analyze tree cover within it over time. GFW thus allows those involved in ape conservation, including at the grassroots level, to monitor changes and generate critical information at various spatial scales as a means of enhancing their conservation efforts.
Several communities within chimpanzee habitat have started to use the Forest Watcher mobile app to find and validate GFW forest loss data on their village lands and report on human activities responsible for deforesta-tion. The free app requires a smartphone but allows non-technical users to download data, go offline and collect location data on forest change, and upload upon return to Internet access. The next version of the Forest Watcher app will have a weekly forest loss alert capability, which will help community participants to monitor, verify and manage road impacts in near-real time.
Endnote
1. Satellite imagery technology and access are constantly developing; for example, the European Space Agency now provides open access to Sentinel Online. This technical website includes 10-m resolution imagery for most parts of the globe and one of their thematic areas is forest monitoring – https://sentinel.esa.int/web/ sentinel/thematic-areas/land-monitoring/forest-monitoring.
Annex III
Data Sets and Detailed Methods
Method
The first three case studies in Chapter 3 examine the effects of road improvement projects on ape habitat in Indonesia and Tanzania using open-access satellite imagery. The analysis quantified the extent of loss each year, which enabled comparison of the area or percent of habitat loss in years before and after the construction or upgrade of a road, as well as a comparison of loss rates at various distances from the road. The chapter explores tree cover change in zones within 5 km and within 10 km of each road; in Tanzania, the buffer zone extends to 30 km, as no other roads existed in the area to confound results. ArcGIS was used to create and display the buffer areas and to overlay them with Global Forest Watch (GFW) tree cover data.
The global forest change 2000–14 data set, freely available at GFW, served as the basis for the analysis (Hansen
et al., 2013). Canopy cover in the year 2000 served as the baseline forest coverage, and cover in each of the subsequent 14 years provided annual change data. The annually updated 30 m × 30 m Landsat tree cover data allowed changes in available habitat to be quantified over time. Each road project began after 2000, the initial year of the data set, and concluded before 2014, the most recent year for which the global forest change data are available.
Definition of “Forest”
Each case study used a “canopy density” value—the percent tree cover in each pixel of the satellite image data— that reflected the general forest type in the area and the species’ ecological requirements and tolerance of canopy openness (GFW, 2014; IUCN, 2016a; see annexes VIII and IX).
boundaries of agricultural plantations in Sumatra, which were located and delineated using visual interpretations of satellite imagery, primarily Landsat, supplemented by high-resolution imagery from Google Maps, Bing Maps or DigitalGlobe, if available (Transparent World, 2015). Detectable areas of agricultural plantations were considered tree cover loss in the first year of the study (2001). Dates of plantation establishment were unknown, however, and some mature plantations may have been included in the 2000 forest cover values. In these cases, the inclusion of some mature plantation land may have overestimated initial natural forest cover and loss in the 2000–14 period (Tropek et al., 2014).2
In contrast, the data set may underestimate forest cover in dry forest, such as savannah–woodland chimpan-zee habitats (Achard et al., 2014). Piel et al. (2015a) compare changes in chimpanzee density in Tanzania to local forest loss assessed using GFW data. They find lower mean chimpanzee densities associated with increasing habitat loss, suggesting that chimpanzee distribution and abundance may decrease with forest loss and that the GFW platform could be useful for assessing their status in chimpanzee habitats.
Data Sets and Tools
Hutan, Alam dan Lingkungan Aceh (HAkA) provided the north Sumatran road data. Tanzanian roads were digi-tized in ArcGIS Desktop using DigitalGlobe historical satellite images at a spatial resolution of 60 cm; 30 m Landsat satellite images were accessed through the Google Earth and Earth Engine platforms. High-resolution UrtheCast satellite imagery, available from GFW, and high-resolution DigitalGlobe satellite image base maps helped assess GFW’s capacity to verify forest loss associated with roads, identify causes of deforestation and visualize their impact in this study’s areas of interest. The GFW tree cover change data were presented in maps produced using ArcGIS.
Input from ape and regional experts and a review of related scientific literature (Barber et al., 2014; Clements et al., 2014; Laurance, Goosem and Laurance, 2009) assisted in estimating the expected effects on ape populations, based on recorded distances from roads traveled by hunters, farmers, loggers and others who threaten forests. This straightforward method can help expose damage, predict potential further loss and target mitigation efforts to reduce adverse effects on surrounding ape habitat. Regularly updated imagery allows for the detection of forest loss, although detection of forest degradation, including hunting and other below-canopy effects, remains a frontier in the application of remote sensing.
Endnote
2. Where accuracy is essential, when monitoring canopy cover using satellite imagery, ground truthing is important. This is particularly relevant in areas that include plantations, as shaded coffee and cocoa planta-tions resemble good forest habitat from above. Shaded coffee and cocoa plantaplanta-tions are used by many species of animals, but this habitat is of limited or no value to arboreal primates, including gibbons and orangutans (M. Coroi, personal communication, 2017).
Annex IV
Global Land Analysis and Discovery Alerts for Early
Detection of Forest Loss and Focusing of
On-The-Ground Response
Subscribers—such as NGO staff, concession holders, park directors or other officials—can receive these near-real-time alerts of detections of large-scale forest loss for whatever areas they select—be it a country, reserve, conservation landscape, road buffer or other stretch or expanse. Internet access is needed to receive alerts. GLAD started with the Congo Basin, Indonesia and Malaysia, and is now available to help managers easily and consist-ently monitor change across most tropical forest (M. Hansen, personal communication, 2017).
In the near future, assessments of infrastructure effects on forest habitat could include evaluations of patterns of GLAD alerts as possible indicators of the intensity and direction of imminent forest loss. Analyses could also compare areas experiencing GLAD alerts to factors associated with forest loss, such as slope or distance to clearings, roads and towns. The rapid alert system can help guide associated development and enforcement to ensure no additional illegal development happens along roads where restrictions or planning regulations have been established.
Annex V
Conservation Action Planning Review Process Results
for Chimpanzees in Tanzania
Tanzania’s National Chimpanzee Management Plan workshop has identified roads as a “high” threat to both core chimpanzee habitats and chimpanzee corridors in the country. In some locations that are critical for chimpanzees, the threat could be “very high” (TAWIRI, in preparation). Roads already cut through most chimpanzee corridor areas in Tanzania. Roads alone are not a major threat to chimpanzee corridors since migrating chimps can cross isolated roads, but they are much more of a threat if the forest on either side of the road is not maintained. The roads of greatest concern are those that fragment core chimpanzee habitat areas, such as the road currently being planned and constructed along the eastern border of Mahale Mountains National Park.
A key driver of deforestation across the region is the arrival of settlers via roads and footpaths, as they clear riverine forests for farming. These forests are sought after because they grow on the region’s more fertile soils, which are also suited for farming. Riverine forest represents a small but critical habitat for chimpanzees in western Tanzania—roughly 2% of the total chimpanzee range. No chimpanzees in the region live in miombo woodlands without some access to riverine forest patches (Pusey et al., 2007).
Findings from the 2016 conservation action planning review process reveal that efforts have successfully protected chimpanzee habitats in dry forests and miombo woodlands (see Figure AX.2a). However, interventions so far have been less successful at protecting the evergreen forest habitats that are critical for chimpanzee survival in the region (TAWIRI, in preparation; see Figure AX.2b). Wildlife managers in the region will need to continue to monitor and develop conservation strategies that prevent loss along and near these riverine forests.
In developing the plan, the authors applied the Open Standards methodology to assess and rank the threat roads pose to chimpanzee core habitat conservation targets and corridor conservation targets. Specifically, they looked at:
Scope: The proportion of the core habitat and corridors that can reasonably be expected to be damaged within ten years if current circumstances and trends persist.
Severity: Within the scope, the expected level of damage to the core habitat and corridors if current circum-stances and trends persist.
Irreversibility: The degree to which projected damage may be reversed and the damaged core habitat and corridors restored (CMP, 2013).
To
ng
w
e W
est
Fo
res
t R
ese
rve
Kasulu
Uvinza
Mpanda
Mahale Mountains
National Park
Katavi
National Park
Gombe
National
Park
Tongwe East
Forest Reserve
Masito
West
Forest
Reserve
Masito East Forest Reserve
KigomaKasulu
Uvinza
Mpanda
L a
k e
T
a
n
g
a
n
y
ik
a
Mahale Mountains
National Park
Katavi
National Park
Tongwe East
Forest Reserve
Masito
West
Forest
Reserve
Gombe
National
Park
Masito East Forest Reserve
To
ng
w
e W
est
Fo
res
t R
ese
rve
TANZANIA
Chimpanzee habitat health: Evergreen forest
% loss 2000 baseline >5 Poor 2.5–5 Fair 1–2.5 Good
<1 Very good
Chimpanzee core area Chimpanzee corridor National park boundary
N
0 10 20 km
FIGURE AX.2
Status of Core Chimpanzee Habitat Areas and Corridors, Tanzania, 2000 vs. 2014
To
ng
w
e W
est
Fo
res
t R
ese
rve
Kasulu
Uvinza
Mpanda
Mahale Mountains
National Park
Katavi
National Park
Gombe
National
Park
Tongwe East
Forest Reserve
Masito
West
Forest
Reserve
Masito East Forest Reserve
KigomaKasulu
Uvinza
Mpanda
L a
k e
T
a
n
g
a
n
y
ik
a
Mahale Mountains
National Park
Katavi
National Park
Tongwe East
Forest Reserve
Masito
West
Forest
Reserve
Gombe
National
Park
Masito East Forest Reserve
To
ng
w
e W
est
Fo
res
t R
ese
rve
TANZANIA
Chimpanzee habitat health: Woodland
% loss 2000 baseline >5 Poor 2.5–5 Fair 1–2.5 Good
<1 Very good
Chimpanzee core area Chimpanzee corridor National park boundary
N
0 10 20 km
Notes: Habitat health was estimated using Global Forest Watch data to show the percentage of loss of (a) forest and woodland and (b) evergreen forest.
Data sources: GFW (2014); Hansen et al. (2013); TAWIRI (in preparation); courtesy of JGI.
Annex VI
The World Bank’s Safeguard Policies and the
Pro-Routes Project
The World Bank’s safeguard policy framework is designed to avoid negative environmental impacts, or otherwise to minimize, reduce, mitigate or compensate for them by integrating environmental considerations into project planning. The policies also require best practice in regard to public participation in decision-making (World Bank, n.d.-b). At the time of writing, the Bank’s Environmental and Social Framework included:
operational policies (OP): concise statements of policy objectives and operational principles, including the roles and obligations of the borrower and the World Bank; and
Bank procedures (BP): mandatory OP-related procedures to be followed by the borrower and the World Bank.3
The World Bank screens each proposed project to determine what type of environmental assessment is appropriate. As part of this process, the Bank classifies each project based on its potential environmental impacts and related factors. In accordance with OP/BP 4.01 on environmental assessments, the World Bank classified the Pro-Routes plan as a Category A project, which the Bank defines as “likely to have significant adverse environ-mental impacts that are sensitive, diverse, or unprecedented.” For proposed projects in this category, borrowers are responsible for preparing an EIA or comparable report (World Bank, n.d.-a, 2013a, p. 2).
In line with OP/BP 4.01, borrowers for Category A projects that are “highly risky or contentious or that involve serious and multidimensional environmental concerns” are encouraged to “engage an advisory panel of independent, internationally recognized environmental specialists to advise on all aspects of the project relevant to the [environmental assessment]” (World Bank, 2013a, p. 1). Accordingly, the Pro-Routes project planners estab-lished an environmental and social advisory panel.
With reference to the environmental assessment, under OP/BP 4.01, the borrowers for the Pro-Routes project are also required to (World Bank, n.d.-b):
inform decision-makers of the nature of environmental and social risks;
ensure that projects proposed for Bank financing are environmentally and socially sound and sustainable (so as to promote positive impacts and avoid or mitigate negative impacts); and
increase transparency and provide mechanisms for the participation of stakeholders in the decision-making process for the project.
Under OP/BP 4.04, policies relating to natural habitats further require borrowers to:
protect, maintain and restore natural habitats and their biodiversity;
ensure sustainability of the services and products that natural habitats provide to human society;
involve local communities in planning and implementation; and
take a precautionary approach to natural resource management.
Under OP/BP 4.36, concerning forests, borrowers must also:
contribute to sustainable development and meet the demand for forest products and services through sustain-able forest management;
protect and maintain the rights of communities to use their traditional forest areas in a sustainable manner;
protect global environmental services and values of forests;
avoid encroachment on significant areas of forest; and
Endnote
3. The World Bank approved a new Environmental and Social Framework in August 2016. It will launch the framework in 2018 and will apply it to all new investment projects; the Bank’s current safeguards are expected to run parallel to the new framework for about seven years, in the context of projects approved before the launch of the new framework (World Bank, n.d.-d; see Box 5.1).
Annex VII
The Decommissioning of Dams
Hydropower infrastructure, such as dams, provides energy to many communities, cities and countries around the world. The ecological, economic and social impacts of dams are often inadequately considered, but they have been well documented. Factors that often garner greater attention from decision-makers are the economic and safety concerns associated with building and maintaining dam structures. As is the case with any type of hard infrastruc-ture, dams must be maintained to certain standards in order to ensure the safety of downstream communities, including animals living in riparian corridors (Brown et al., 2009; WCD, 2000).
Hundreds of thousands of people around the globe have perished following the failure of dams (Si, 1998); such disasters can result from any number of design and deterioration issues (ASDSO, n.d.). In the United States alone, hundreds of fatalities have resulted from people climbing on, paddling over, fishing near or otherwise interacting with dam structures and ignoring risks associated with potential hydraulic undertows at the base of dam structures (Tschantz, 2014).
Dam owners who decide to remove a structure typically cite socioeconomic concerns as the motivating factors behind their decision (Engberg, 2002). For example, when a hydropower dam no longer produces enough power to justify its existence on economic grounds, it is decommissioned.
In the United States, the Federal Power Act and the Magnuson Stevens Fishery Conservation and Management Act require hydropower regulators to consult with agencies charged with protecting natural resources before issu-ing hydropower licenses. These requirements exist to protect access to important habitat for migratory fish species (McDavitt, 2016). If installing a required fish passage system is cost-prohibitive compared with the income from power production, a hydropower producer may abandon a project and the dam might eventually be removed. A case in point involves the removal of two dams on the Elwha River in Washington State. Both federal environmental agencies and native tribes had insisted that the dams incorporate adequate fish passage for salmon, which would have been difficult to ensure and cost-prohibitive (Gowan, Stephenson and Shabman, 2006). After years of delib-eration, the Elwha and Glines Canyon dams were removed in 2011 and 2014, respectively.
A non-hydropower dam may become obsolete when associated mills shut down, an impoundment fills with sediment, its structure breaks down, its design proves to be ineffective for its intended purpose or if it no longer has an identifiable purpose. If a dam has become obsolete, the owner may be particularly unwilling or unable to bear maintenance costs and shoulder liabilities associated with keeping it intact, and the dam may be removed (Engberg, 2002).
Given that the cost of dam removal can vary widely, and that the economic valuation of the ecosystem services provided by a free-flowing river can be difficult to quantify, conducting a true cost–benefit analysis of dam removal can be challenging (Whitelaw and MacMullen, 2002). As of 2015, more than 1,200 of about 80,000 dams in the United States had been removed, but fewer than 10% of those removals were scientifically studied—and most of the studies that were conducted did not examine broader ecosystem responses (Bellmore
et al., 2016).
Research that did consider ecosystem impacts has shown that the potential benefits of dam removal include the following:
reconnection of river habitat for fish and other aquatic species;
reduction of thermal impacts of impoundments;
improvement of aquatic organism access to upstream refugia from increasing water temperatures;
elimination of liability and maintenance costs;
decreases in flooding upstream; and
increases in connectivity of the river for recreational purposes (Lejon, Malm-Renöfält and Nilsson, 2009; Magilligan et al., 2016; Wildman, 2013).
Ultimately, the removal of a dam means bringing a river closer to a more natural, functional state. When a dam is constructed, the flow of animals, nutrients, sediment and other natural processes is stopped or limited indefinitely (O’Connor, Duda and Grant, 2015). Downstream communities are the most impacted by dams; too often, they are disadvantaged or disenfranchised, with no capacity to defend themselves against political pres-sures to build new infrastructure (WCD, 2000). By taking the services provided by a functioning river into account, along with the likely impacts to downstream communities, decision-makers can help to avert or at least minimize negative impacts on local populations and biodiversity, be it with reference to the construction of a dam or its removal.
Annex VIII
Data Sets Used
The assessment of the status of ape habitat at two spatial scales (see Figure 7.1) included the analysis of several global data sets:
The Global Forest Change 2000–14 data set. Provided by the University of Maryland in association with Google, Inc., and the foundation of GFW 2.3, these data on annual forest cover and tree cover loss are presented at 30-m resolution. Development of this data set included verification using very high-resolution spatial data, such as Quickbird imagery and existing percent tree cover data sets derived from Landsat data (Hansen et al., 2013). Data are available online at: http://earthenginepartners.appspot.com/science-2013-global-forest.
IUCN Red List data on geographic ranges of each recognized subspecies. The range delineations vary in terms of precision. Ranges of 22 subspecies—including most gibbons in mainland Asia and gorillas—reflect the recent extent of their distribution, given the historical loss of forest cover. In contrast, ranges of the other 16 subspecies have less refined boundaries and reflect the apes’ historical distributions, which include areas of urban development that are no longer home to apes (IUCN, 2016c).
The World Database on Protected Areas (WDPA). A joint effort between IUCN and the UN Environment Programme (UNEP), the WDPA is managed by UNEP’s World Conservation Monitoring Centre (IUCN and UNEP-WCMC, 2016). The 2016 PA boundaries may include areas that were not protected throughout the study period. The analysis included all reserves and PAs within IUCN protected area categories I–VI, except those with a status of “not reported” or “proposed” and those designated as UNESCO biosphere reserves (IUCN, 2016c, n.d.-b; UNESCO, n.d.-b). The analysis retained all PAs and other reserves with no IUCN clas-sification, including thousands of forest reserves and a large number of community reserves. The WDPA does not yet contain all of the world’s community reserves, but it is the most comprehensive database currently available at the global scale.
Unpublished data on industrial plantations. Mapped by the World Resources Institute and Transparent World, these data were used to account for the tree cover created by mature oil palm, timber, pulpwood and rubber plantations, particularly in Southeast Asia (GFW, 2014; see Annex XI).
Annex IX
Forest Habitat Definitions for 38 Ape Subspecies
Geographically unique ape subspecies have adapted to particular environmental conditions, including canopy openness. This analysis uses different values of tree cover density to define habitat and to estimate forest change in the ranges of each subspecies. For each subspecies, it defines a threshold canopy density (the percent tree cover per pixel) below which the subspecies may not be viable.
The thresholds reflect each subspecies’ ecology, based on IUCN habitat data and scientific literature (IUCN, 2016c), tree cover within their range and in protected areas (PAs) with known occupancy; regional expert opinion on chimpanzees, gibbons, gorillas and orangutans was also taken into consideration, as was the ability of certain sub species to survive in a variety of forest types, including habitat degraded by humans (see Annex X).
Chimpanzees. Among the apes, chimpanzees tend to have the most flexible ranging behavior (Maldonado
et al., 2012; K. Abernethy, personal communication, 2016). Western chimpanzees occupy areas ranging from closed-canopy moist forest to wooded savannah, indicating a habitat threshold that included pixels with 15% or more tree cover. A lower canopy density was thus selected for all chimpanzee subspecies (see Annex X).
Gibbons. Tropical and subtropical moist broadleaf forests comprise most ape habitat. For gibbons, who require canopy connectivity and a diversity of fruit trees (W. Brockelman, personal communication, 2016), recom-mended canopy cover is at least 75% (Gaveau et al., 2014; D. Gaveau, personal communication, 2016).
Gorillas. Most gorillas occupy densely forested areas, although habitat for Grauer’s and mountain gorillas contains substantial areas of bamboo (K. Abernethy, personal communication, 2016).
Orangutans. A wide range of canopy density was suggested for orangutan habitats. At the high end, based on natural forest cover in Borneo, the proposed density was at least 75% (D. Gaveau, personal communication, 2016). Yet, based on the ability of orangutans to use partially disturbed habitat so long as they are not hunted, the density could be as low as 30% (E. Meijaard, personal communication, 2016).
Where the ranges of subspecies overlap, forest was defined in the overlapping regions using the requirements of the more exacting subspecies—that is, the one with the higher canopy density percentage.
The availability of IUCN ape range data and the Google Earth Engine scripts on GFW will enable other users to run such analyses at a higher or lower percent tree cover per pixel and thus tailor the parameters to specific environments (see Annex VIII).
In this analysis, a single taxon-specific threshold value of canopy density was used to exclude areas where forest structure or composition may not be suitable for a given ape subspecies. This approach may not ade-quately reflect the ecological variability found among populations of some subspecies, particularly chimpanzees. Eastern and western chimpanzees occupy regions dominated by either denser forest or savannah woodlands and forest mosaic.
In the range of western chimpanzees,most deforestation occurs in zones of higher canopy density, and the low canopy density percentage assigned to this subspecies to reflect its ecological flexibility probably underestimates forest loss in the wetter southern half of its range (L. Pintea, unpublished data, 2016). Use of a denser canopy thresh-old (for example, 30%, instead of 15%) for western chimpanzees would have decreased detected habitat loss by 2.5% over the period under review, mainly because the baseline forest in 2000 (564,000 km2 or 56.4 million ha at 15% canopy cover) would have covered a much smaller area (355,000 km2 or 35.5 million ha at 30%).
Annex X
Canopy Density Percentages Used for 38 Ape Subspecies
Common name Scientific name Threshold percentage Source
Bonobo Pan paniscus 50 occupancy
Central chimpanzee Pan troglodytes troglodytes 30 occupancy, expert Eastern chimpanzee Pan t. schweinfurthii 30 occupancy, expert
Nigeria–Cameroon chimpanzee Pan t. ellioti 30 occupancy
Western chimpanzee Pan t. verus 15 occupancy
Cross River gorilla Gorilla gorilla diehli 50 occupancy
Grauer’s gorilla Gorilla beringei graueri 50 occupancy
Mountain gorilla Gorilla b. beringei 50 occupancy
Western lowland gorilla Gorilla g. gorilla 75 occupancy, expert Northeast Bornean orangutan Pongo pygmaeus morio 50 expert, range Northwest Bornean orangutan Pongo p. pygmaeus 50 expert, range Southwest Bornean orangutan Pongo p. wurmbii 50 expert, range
Sumatran orangutan Pongo abelii 50 expert, range
Eastern hoolock Hoolock leuconedys 75 ecology
Western hoolock Hoolock hoolock 75 ecology
Abbott’s gray gibbon Hylobates abbotti 75 ecology
Agile gibbon Hylobates agilis 75 ecology
Bornean gray gibbon Hylobates funereus 75 ecology
Bornean white-bearded gibbon Hylobates albibarbis 75 ecology Carpenter’s lar gibbon Hylobates lar carpenteri 75 ecology Central lar gibbon Hylobates l. entelloides 75 ecology
Kloss’s gibbon Hylobates klossii 75 ecology
Malaysian lar gibbon Hylobates l. lar 75 ecology
Moloch gibbon Hylobates moloch 75 ecology
Müller’s gibbon Hylobates muelleri 75 ecology
Pileated gibbon Hylobates pileatus 75 ecology
Sumatran lar gibbon Hylobates l. vestitus 75 ecology
Yunnan lar gibbon Hylobates l. yunnanensis 75 ecology
Cao Vit gibbon Nomascus nasutus 75 ecology
Central Yunnan black-crested gibbon Nomascus concolor jingdongensis 75 ecology
Hainan gibbon Nomascus hainanus 75 ecology
Laotian black-crested gibbon Nomascus c. lu 75 ecology Northern white-cheeked crested gibbon Nomascus leucogenys 75 ecology Southern white-cheeked crested gibbon Nomascus siki 75 ecology Southern yellow-cheeked crested gibbon Nomascus gabriellae 75 ecology Tonkin black-crested gibbon Nomascus c. concolor 75 ecology West Yunnan black-crested gibbon Nomascus c. furvogaster 75 ecology
Siamang Symphalangus syndactylus 75 ecology
Annex XI
Value and Limitations of the GFW Tool for Monitoring
Forest Cover Change
Value
Launched in 2014, Global Forest Watch provides access to spatially explicit, high-resolution forest change data, which is derived from thousands of satellite images and updated annually for the entire world (GFW, 2014; Hansen
et al., 2013). GFW’s online forest monitoring and alert system combines cutting-edge algorithms, satellite technology and cloud computing to identify where trees are growing and disappearing in near-real time.
In a few minutes, a user can obtain up-to-date information about the status of forest landscapes worldwide or for a particular region, such as a country, species range or PA. The user can also modify the percent tree cover per pixel (the canopy density) GFW uses to determine forest cover, so as to adjust any analysis to reflect a more open or closed canopy. Users can generate regular, accurate summaries of forest extent and change, create custom maps, analyze forest trends, subscribe to near-real-time alerts of forest loss or download data for their local area, country or region.
GFW provides free access to the annually updated global forest change data at relatively high resolution, along with tools with which to analyze tree cover loss and gain data. The analysis presented in Chapter 7 shows the data’s broad application with respect to species using both closed-canopy and more open-canopy forest. GFW forest change information is highly scal-able, from a forest corridor to all ape species’ ranges. Applications include not only monitoring of PAs and range polygons, but also identification and monitor-ing of forest corridors and other areas of concern. As discussed in the chapter, GLAD alerts will identify areas of likely forest loss on a weekly basis, facilitating each of these activities and helping resource managers to monitor forest cover consistently.
Global Forest Watch Fires is a related platform that provides near-real-time information on forest fires in South east Asia. Fires have led to sweeping forest loss in Indonesia, especially in peat forests that are critical orangutan habitat. The tool’s daily, spatially explicit updates on fire occurrence empower people to enhance their monitoring of and responses to fires before they burn out of control and to hold accountable those who may have burned forests illegally (GFW, n.d.-a).
Limitations
Despite its advantages, the use of GFW alone has cer-tain limitations. For example, annual updates at 30-m resolution or bi-weekly updates at 500-m resolution will not necessarily provide the precision needed to determine effects on a given primate population, the cause of clearance or associated impacts, such as poach-ing and non-timber forest product collection. Reliance on remotely sensed information further constrains the GFW platform’s ability to help explain drivers of forest change.
The Global Forest Change 2000–14 data set cre-ated by Hansen et al. (2013) may underestimate forest
BOX AX.1
Detecting Plantations at a Broad Scale
A criticism of the Global Forest Change 2000–14 data set is that it does not always distinguish between natural forest and industrial plantations, such as oil palm. To address this issue and identify indus-trial plantations in the areas under review, the analysis presented in Chapter 7 incorporates data from an industrial plantation mapping project undertaken by the World Resources Institute and Transparent World (Transparent World, 2015). Overall forest loss figures in this analysis include these plantations; to avoid double counting an area once its forest was converted to plantation, any tree cover loss within plantations was ignored.
Areas under plantation are counted as “lost” as of 2001, so that cumu-lative loss includes all plantation areas, regardless of whether an area was developed. The map that shows forest cover in 2000 includes any vegetation in these properties that was tall and dense enough to be considered tree cover by GFW. An unknown proportion of forest within these areas had already been converted to tree plantations by 2000; without knowledge of the dates of initial conversion of each area, it is impossible to discern whether the loss from 2000 to 2001 was all, mostly, or only partially loss of natural forest.
cover in dry forest habitats, such as those used by chimpanzees in Mali and Senegal (Achard et al., 2014). Setting canopy density threshold values of 30% or 15% for regions with sparser tree cover helped control for this limitation, while acknowledging that most deforestation occurs in zones of higher canopy density (K. Abernethy, personal com-munication, 2016; L. Pintea, unpublished data, 2016). This looser definition of forest may lead to underestimating of forest loss in more densely forested portions of the ranges of Pan spp.
Conversely, the data created by Hansen et al. (2013) measure “tree cover,” which in some areas may include mature tree plantations as well as natural forest (Tropek et al., 2014). In addition to excluding known plantations (see Box AX.1), setting a high canopy density threshold (50% or 75%) consistent with tropical moist forest canopy helps to screen out young oil palm plantations, which have gaps in canopy cover due to the low height and small crowns of palm saplings. For the ranges of some ape species, however, plantation data were unavailable; for others, dates of plantation establishment were unknown (Transparent World, 2015). Consequently, mature plantations may have been included in the 2000 forest cover values in some areas, causing both initial forest cover in 2000 and loss in the 2000–14 period to be overestimated. Despite its limitations in distinguishing vegetation types at the local scale, the global forest change data set developed by Hansen et al. (2013) may provide valuable forest cover information for areas where local data may be lacking (Burivalova et al., 2015).
Annex XII
Future Refinements to the Ape Habitat Assessment
Aggregating and summarizing the data for 38 ape species and subspecies of 33 countries with varying canopy cover requirements and numerous vegetation types for 2000–14 inherently involved accepting error. Given the following unknowns and shortcomings, additional data or analysis would improve this assessment:
Forest use patterns by various subspecies within their range polygons are not fully known.
While IUCN geographic ranges represent the best available data on subspecies at the global scale, ape popula-tions are not evenly distributed within them; range maps, therefore, are prone to commission (false presence) errors (Rondinini et al., 2006). Moreover, updates to range map polygon boundaries rely on scarce species presence data and are not consistent across subspecies (Wich et al., 2016).
The selection of a single canopy density threshold value for areas of range overlap of subspecies with differing forest cover requirements created some discrepancy in the aggregations of forest presence and loss for coun-tries and across all ape ranges.
PAs were created in different years, so certain forested areas may not have been fully protected until later in the period under review.
Plantations were created in different years, so while they were considered a loss from 2001, they may have been created before 2000 and would thus reduce the initial forest cover extent.
Assessing the status and trends in forest habitat is a first step in estimating the status of ape populations. Future assessments of ape habitat will benefit from including additional data sets as they become available and accessible. These may include:
species-specific habitat suitability maps that incorporate on-the-ground verification (Hickey et al., 2013; Jantz
et al., 2016; Torres et al., 2010; Wich et al., 2012b);
higher-resolution satellite imagery of important primate areas, via platforms such as Planet or DigitalGlobe, which increasingly provide remotely sensed data that can help conservationists determine drivers of deforestation;
the normalized difference vegetation index (NDVI) and other satellite-derived vegetation cover data, which could help quantify forest degradation and may be particularly important for gibbons, as they require intact canopy;
elevation data (Tracewski et al., 2016);
information on forest structure, including cover, height, stand age and intactness;
zoning data from both official (government) sources and unofficial sources—such as Global Witness, Greenpeace and MightyEarth—to help assess emerging or future drivers of forest loss, such as rubber, oil palm or logging concessions that may not yet be active but that have been allocated;
ground-truthed information on land cover, species presence and human activity, including roads, to help determine drivers of forest loss; and
important ape landscape boundaries (Max Planck Institute, n.d.-b), which were not available for Asia and were not used in the analysis in this chapter, as these would allow future habitat assessments to be conducted within their boundaries.
For this global-scale analysis, no attempt was made to determine suitable environmental conditions (SEC), which suggest the occurrence of an ape subspecies within its range (Junker et al., 2012). An Africa-wide great ape suitability analysis, published in 2012 and presented in the first State of the Apes volume, acknowledges various limitations of a modeling approach at that scale (Funwi-Gabga et al., 2014; Junker et al., 2012). These included presence locations geographically biased to PAs, outdated vegetation and road data, and a lack of true absence data, each of which may have skewed determination of suitable habitat.
Habitat suitability models use a variety of factors, including forest canopy cover, to help predict and map potential habitats, but integrating these data has limited previous modeling efforts to small regions or coarse spatial and temporal resolutions. Jantz et al. (2016) combined global forest change data with other Landsat Enhanced Thematic Mapper Plus (ETM+) satellite imagery to model and map changes in habitat suitability between 2001 and 2014 over the entire chimpanzee range at 30-m resolution (see Annex X). However, the animal presence data on which suitability maps are based do not exist across the ranges of most ape subspecies, and current global satellite data do not allow for refinement of these results to account for suitability.
Reliable habitat suitability maps will allow future assessments to exclude areas of unsuitable land cover—such as illegal oil palm and other plantations, pressure from human activity and natural barriers—and reduce the amount of commission errors (Beresford et al., 2011). With broad applicability to a range of ape taxa, this type of assessment will allow for more effective and efficient interventions.
Annex XIII
Applying Habitat Assessment to Conservation Action
Plans for Apes
Transparency to reveal the relative condition of forest habitat at high spatial and temporal resolution will be increasingly central—not only to halting forest loss directly, but also to planning effective conservation strategies for apes and other forest-dependent species.
Conservation action plans (CAPs) have been developed for at least 30 ape taxa. Some CAPs have identified conservation units that, if successfully implemented, would protect majorities of the subspecies’ range (Plumptre
et al., 2010). However, ape-range authorities and conservationists often lack the means to monitor forest cover status of these critical areas (Kühl, 2008).
CAPs that use the Open Standards process developed for chimpanzees and gorillas in Tanzania and eastern DRC have used GFW data to assess viability of ape conservation targets, prioritize threats and measure conservation success (TANAPA et al., 2015). For example, the process in Tanzania considered chimpanzee habitats to be in very good or good condition if the areas lost less than 1% and 2.5%, respectively, of their forest with tree cover density greater than 30% (TAWIRI, in preparation). For the period 2000–14, forest loss between 2.5% and 5% or greater than 5%, respectively, would lead chimpanzee habitat viability to be categorized as fair or poor.