filtiSTER CDR
1/
USING SPRINKLER PATTERN DATA IN SYSTEM DESIGN By
Claude H. Pair
Research Engineer (Irrigation), Northwest Branch, Soil & Water Conservation Research Division
USDA-ARS
The American Society of Agricultural Engineers' Committee on Sprinkler Irrigation is developing a standard procedure for determining water dis-tribution patterns of sprinkler heads used in agriculture. When this
pro-cedure is developed and used by the manufacturers of sprinkler heads, or when a sprinkler testing organization conducts the tests and publishes the results, data will be available which can be used to design better sprinkler
systems. Using the water distribution pattern test information in sprink-ler system design would give an added incentive for testing and publishing the data as well as replacing the sprinkler selection method presently used in sprinkler design with a method having an engineering basis.
The method now used for selecting a sprinkler system=design assumes that the water application rate of a sprinkler lateral varies with the distance of lateral move on the main pipeline. This is an erroneous assumption because from the standpoint of the intake rate of the soil, the maximum water application rate from one sprinkler lateral is a function only of the nozzle size, nozzle pressure, and sprinkler spacing on the lateral pipe-line. Varying the distance of lateral move on the main pipeline has no
effect on the application rate of a sprinkler, but does affect the total
,amount of water
applied to a field with a given time of lateral set.The maximum sprinkler application rate should not exceed the water in-take rate of the soil on more than 5-10% of the area wetted from one
sprinkler lateral. The minimum rate must exceed the evaporation rate from the soil. Within this range of rates the sprinkler system designer
selects a sprinkler that will give good water distribution and an operation time satisfactory for the equipment and labor available.
Equipment and procedures are available for measuring the water intake rate of the soil for sprinkler design. The measured intake rate is the maximum allowable rate for design purposes as defined above.
Pair, continued
Sprinkler Selection
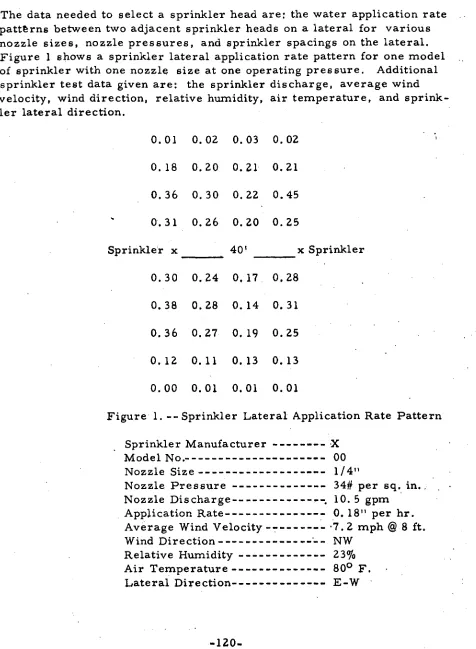
The data needed to select a sprinkler head are: the water application rate patterns between two adjacent sprinkler heads on a lateral for various nozzle sizes, nozzle pressures, and sprinkler spacings on the lateral. Figure 1 shows a sprinkler lateral application rate pattern for one model of sprinkler with one nozzle size at one operating pressure. Additional sprinkler test data given are: the sprinkler discharge, average wind velocity, wind direction, relative humidity, air temperature, and sprink-ler lateral direction.
0.01 0.02 0.03 0.02
0.18 0.20 0.21 0.21
0.36 0.30 0.22 0.45
0.31 0.26 0.20 0.25
Sprinkler x 40' x Sprinkler
0.30 0.24 0,17 . 0.28
0.38 0.28 0.14 0.31
0.36 0.27 0.19 0.25
0.12 0.11 0.13 0.13
0.00 0.01 0.01 0.01
Figure 1. --Sprinkler Lateral Application Rate Pattern
Sprinkler Manufacturer Model No.
Nozzle Size
Nozzle Pressure Nozzle Discharge Application Rate
Average Wind Velocity Wind Direction
Relative Humidity Air Temperature
Lateral Direction
X 00 1/4"
34# per sq. in., 10.5 gpm
0. 18" per hr. •7.2, mph @ 8 ft.
NW
100
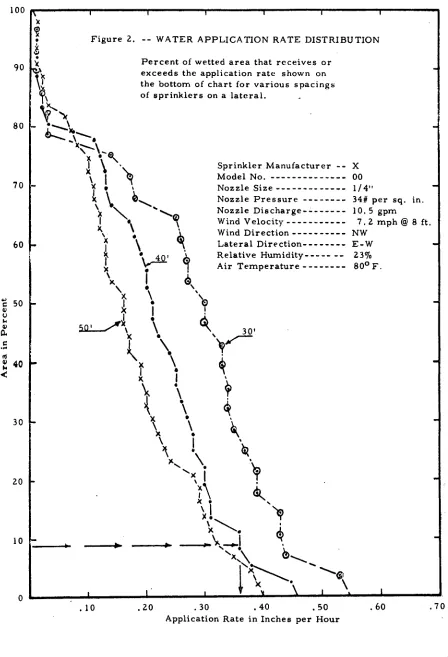
Figure 2. -- WATER APPLICATION RATE DISTRIBUTION
Percent of wetted area that receives or exceeds the application rate shown on the bottom of chart for various spacings of sprinklers on a lateral.
V• 90
80
Sprinkler Manufacturer X Model No.
Nozzle Size Nozzle Pressure Nozzle Discharge Wind Velocity Wind Direction Lateral Direction Relative Humidity Air Temperature
50
C
'0 40
30
20
10 70
60 INN
,m1
IMO
00 1/4"
34# per sq. in. 10.5 gpm
7.2 mph @ 8 ft. NW
E W 23% 80° F.
Pair, continued
.10 .20 .30 .40 .50 .60 .70
Application Rate in Inches per Hour
Pair, continued
To make the sprinkler lateral water application rate pattern test data more usable in sprinkler head selection, the application rate versus per
cent of the wetted area receiving one rate or higher is plotted. Data from tests having various sprinkler spacings on the lateral can be plotted on the same chart when the nozzle sizes and pressures are the same. Figure 2 shows the percentage of wetted area that receives or exceeds the appli-cation rate shown on the bottom of the chart for sprinkler spacings of 30', 40', and 50' on the lateral for one sprinkler model.
With the water intake rate of the soil known, or the best estimate of this intake rate made, the sprinkler having a water application rate that does not exceed the soil intake rate over more than 5-10% of the wetted area is selected for use. The nozzle size, operating pressure at the nozzle, and sprinkler discharge is obtained from the data listed on Figure 2.
Lateral Move Selection
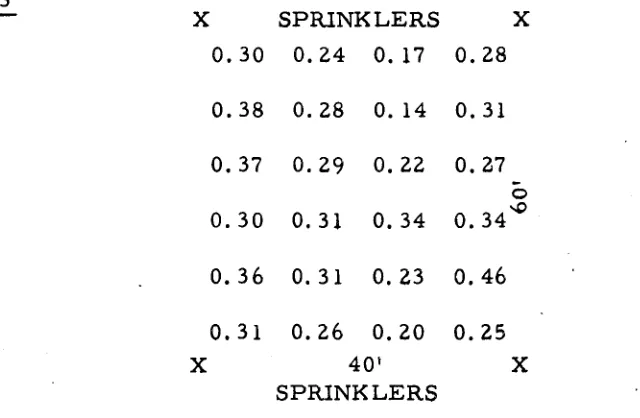
The data needed for selecting the distance of sprinkler lateral moves are the water accumulation patterns between two adjacent lateral sets. These will vary with the distance of lateral moves on the main line for the sprink-ler spacing distance, nozzle size, operating pressure at the nozzle, and
sprinkler discharge decided on when selecting the sprinkler head. Figure 3 shows the water accumulation pattern for a lateral move distance of 60'.
Figure 3
X SPRINKLERS X
0.30 0.24 0.17 0.28
0.38 0.28 0.14 0.31
0.37 0.29 0.22 0.27
0.30 0.31 0.34 0.34 4"
0.36 0.31 0.23 0.46
0.31 0.26 0.20 0.25
X 40' X
SPRINKLERS
Water Accumulation Pattern between Lateral Sets.
Sprinkler Manufacturer Model No.
Nozzle Size Nozzle Pressure
X 00 1/4"
Figure 3 (continued)
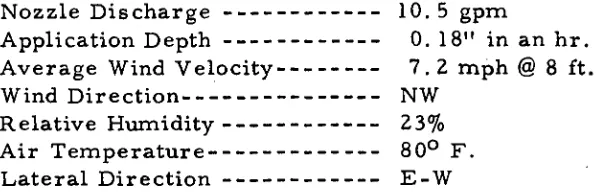
Nozzle Discharge Application Depth Average Wind Velocity Wind Direction
Relative Humidity Air Temperature
Lateral Direction
10.5 gpm
0. 18" in an hr. 7.2 mph @ 8 ft. NW
23% 80° F.
E-W
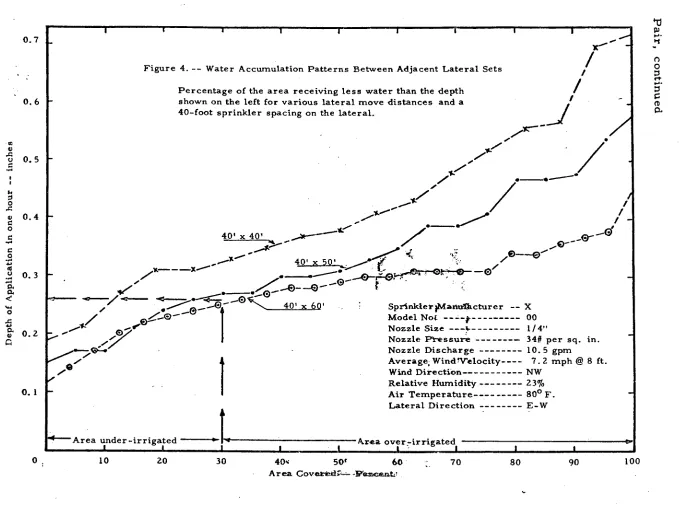
To make the water accumulation pattern data between adjacent lateral sets more usable in selecting the distance for a lateral move, the depth of water applied per hour versus the percentage of area irrigated is plotted. Figure 4 shows the depth of application versus percentage of area covered less than the application depths shown on the left for 40-, 50-, and 60-foot lateral move distances on the main line. The slope of the application depth... per cent of area covered curve is a measure of the distribution uniformity of the sprinkler system. A horizonal line would represent a completely uniform water distribution between lateral
sets.
The lateral move distance selected for design should be the one giving the most uniform water distribution over the area.
Lateral Operating Time
The length of time the lateral must be operated at a setting is determined by dividing the depth of water to be replaced in the root zone of the crop by the depth of water application for the lateral move distance selected from Figure 4 for the level of irrigation coverage desired. Where under-irrigation of a crop is a problem, the depth of application will be selected so that only 5-10% of the area is under-irrigated. If over-irrigation is a problem and under-irrigation can be tolerated, then the time of irrigation will be based on allowing perhaps 40 to 50% or more of the area covered to be under-irrigated and 60 to 50% or less to be over-Irrigated.
Water Application Efficiency
r
iI-Figure 4. -- Water Accumulation Patterns Between Adjacent Lateral Sets
Percentage of the area receiving less water than the depth
shown on the left for various lateral move distances and a
40-foot sprinkler spacing on the lateral.
0.7
0.6
ro
11)
•
►
0
er
sr 0 CL,
Average, Windlrelocity---- 7.2 mph @ 8 ft.
Wind Direction
NW
Relative Humidity
Air Temperature
Lateral Direction
Area over-irrigated
60
70
tc
0.5
0
$4s 0.4
0
0
0.3
ra.
0.20. 1
'4"-- Area under-irrigated
0
10
20
30
23%
80° F.
E W
4CK
501
I
---1
80
90100
Area Coveredri-,- r
eGent.,40' x 40'
tii
40' x 50'
--49-1-
1
r
-e•
0,
40' x 60'
00
1/4"
34ff per sq. in.
10.5 gpm
Sprinkler)Manuilicturer
-- X
Model Not
-'
Nozzle Size ---4
Nozzle
Pressure.
Nozzle Discharge
The water application efficiency obtained by the above calculation can be adjusted for wide differences in humidity, wind velocity, and temperature between the place where the sprinklers were pattern-tested and the design area by using a method such as the Frost-Schwalen nomograph.
Water Storage and Water Distribution Efficiencies
The water storage efficiency (E s ) and the water distribution efficiency (E d) can be calculated from the data given in Figure 4. This procedure
will
be presented in a separate paper.Sample Design
A sprinkler system is needed to replace 3" of water in the soil profile on a farm having a measured minimum water intake rate of 0. 37" per hour for sprinklers.
A study of the application rate curves for various sprinklers showed that Sprinkler Brand X, Model 00, with a 1/4" nozzle, operating at a pressure of 34 psi, and discharging 10.5 gpm has application rates that exceed the soil intake rate for 8% of the wetted area when the sprinklers are spaced 40 feet apart on the lateral pipeline. (See Figure 2.)
Figure 4 shows that a lateral move distance of 60 feet between adjacent lateral settings on the main pipeline for the 40-foot sprinkler spacing on the lateral gives the best distribution of water when compared with the 40- and 50-foot distances of lateral move.
The time for each lateral setting can be determined by dividing the total depth of water to be replaced (3") by 0.26, the depth of application
allowing 30% of the area to be under-irrigated, as shown on Figure 4 for a 40'
x 60'
sprinkler spacing. This would give an 11.5 hour set for each lateral.3 0. 2
0 6
Time for later-al set - = 11.5 hours.
Water application efficiency can be determined by dividing the average depth of application in an hour for the
30%
level of area coverage on the 40' x 60' spacing (0.26") by the average depth of water discharged at the nozzle, spread evenly over the 40' x 60° sprinkler spacing (10.5 gpm gives 0.42").Water