A Study on the
Bedia
Community of
the Village Nagrabera,
Jharkhand
1Saswatik Tripathy, 2Aditi Khan
1Post Graduate student in 2 years Diploma on Develop Management. B.Sc. Agriculture Rural and Tribal
Development,
2Post Graduate student in 2 years Diploma on Develop Management. B.Sc. Agriculture Rural and Tribal Development
Post Graduate Diploma in Development Management. The Dhan Academy, Madurai, India
Email- 1[email protected], 2[email protected]
1. INTRODUCTION:
The Bedia is a tribal community of the states of Bihar and Jharkhand in India. According to the mythology it is believed that they originally lived on Mohdipahar in Hazaribag district and have descended from the union of Vedbansi
prince with a Munda girls. The other view is that a section of the Kurmis were outcastes and came to be known as the
Bedia or Wandering Kurmis. Some trace their origin from Ved and Ved Vyas, the author of the Hindu epic Mahabharata. (Mishra 2013) The Bedia, sometimes pronounced Besia, are a Hindu caste found in the state of Uttar Pradesh in India. The Bedia tribe reside in singbhum, RANCHI, and Hazaribagh districts of Jharkhand. These areas are covered by thin forests. The Bedia tribes speak the Panchpargania which is part of the indo Aryan family of languages. They use this language for inter and intra group communication. The Bedia who have settled down in West Bengal, are also known as the Bedia Kudmi, Choto Kudmi or San Kurmi. They speak in Kudmali (an Indo-Aryan language) at home and Bengali for inter-group communication. The Bengali and Devanagari (Sanskrit) scripts are used to write the language. Bedias
are mainly a small agricultural tribe of Chotanagpur however, a fraction of population is engaged in several other occupations such as contract labour, rikshaw pulling and petty businesses, but primary occupation of the Bedia tribe is agriculture. They are basically land holding community engages in pastoral economy. They are very much dependent on forest products also.(Mishra 2013). The Bedia tribe follow their traditional tribal religion. They worship family deities like Mai, Kundari, Mudkati, Darha, Bansa and others. Their religion deities are bed pahari, and palcharu. The Bedias celebrate and observe festivals such as sarhul, phagun, sohrai, and jitia. The Bedia tribe is divided into sects. They are exogamous clans named phecha, mahua, bambia, suiya, kachua, and chidra. The title used by them is Mahato. The
Bedias follow the birth and death rituals. They celebrate chetti, a ritual that is observed after the sixth day of the birth of the child. On this day the purificatory and child naming ceremony takes place. In the case of marriage boys are married off at the age of 16 to 17 while girls are married at the age of 14 to 15. As per the study module we have studied
the health status of the villagers of “Nagrabera” which is totally compact by Bedia tribal people. As well as we have studied different demographic measures also.
2. REVIEW OF LITERATURE:
Agrawal (2004) Talks about the Bedia community of north India. The community defines the non-marital relation of women with the men of upper cast and do hypergamy in order to claim upper-caste origin and affiliation.
3. STUDY AREA:
3.1 Jharkhand State Profile: The state Jharkhand came into existence on 15th November 2000 as a 28th State of Union of India after being division from Bihar state. This state is located at 23.6102°N latitude and 85.2799°E longitude and total geographical area of Jharkhand is 79.90 lakh ha, that lies on Chota Nagpur Plateau. Many rivers pass through it and this state is surrounded by hills. (Wikipedia) Total cultivable land of Jharkhand is about 38 lakh ha, comprising 25-26 lakh ha net shown area and cropping intensity is 125-26% (www.sameti.org) .Rainfall is1300mm.Jharkhand is consists of 24 districts and 259 blocks. As per 2011 census population of this state is 32.96 million and major religion is Hinduism.
3.2 Ranchi District profile:
Abstract- This study is about the lifestyle of the Bedia community in the village Nagrabera of Jharkhand. Bedia is a primitive tribe of India who are isolated from the main stream. In Nagrabera the major findings of us is the sex ration is so much high and the girls are more educated than the boys. We mainly focus on the gender dynamics education and some other social dimensions in the study.
Ranchi district is one of the 24 districts of Jharkhand. Ranchi is located at 23°20’38.7636”N latitude and
85°18’34.4268”E longitude and total geographical area of Ranchi is about 5231sq.km, which is full of several plateaus,
mountains, valleys, forests. Ranchi has a humid subtropical climate, but due to its position and the forest around the city, it is known for its pleasant climate. Rainfall is 1430 mm. maximum temperature 25°-42°C in summer season and minimum temperature 2°-20°C in winter season. Ranchi consists of 18 blocks and 305 panchayats. Different types of tribal cast like Bedia, Ho, Munda, Sanotal, Mahato etc. are habitant of here; Ranchi has about 44.6% population that is sarana is the caste. (District Ranchi: Official website of government of Jharkhand)(Wikipedia)
The study was conducted in Nagrabera village of Angara block.
3.3 Angara Block Profile:Angara is one of the twenty administrative community development block of Ranchi dist, Jharkhand. It is located 26km. far away from Ranchi Railway Station. Angara consists of 142 villages and 23 Panchayats. (Wikipedia & www.onefivenine.com)
3.4 About Nagrabera
Main occupation: Agriculture Panchayat: Haratu
Block: Angara District: Ranchi State: Jharkhand
4. METHODOLOGY:
Research methodology is the structural configuration of the study for conducting the research. It describes the research design, tools, sampling techniques, mode of data collection and analytical procedures for establishing the objectives of the study within the framework.
4.1Research Design
The research design describes the overall strategy of the study that combines all the components of the study and defines the research problems. Different types of design of the study like descriptive (case study, survey), experimental, review (literature review) are the way of finding the answer to research questions.
4.2 Sampling-
Sample size: Samples of 42 households were randomly selected selected. 4.2.1 Sampling techniques:
Block selection: From the Ranchi district Angara block was selected.
4.2.2 Village selection: Under this block, Nagrabera village was selected purposively, that comes under the Haratu panchayat.
4.2.3 Selection of respondents: Respondents were selected randomly in the normal statistically procedure for avoiding biases.
4.4 Method of data collection-
For data collection both quantitative (survey- personal interview) and qualitative (observation, case study) methods had been adopted.
4.4.1Preparation of schedule:
The first part of the schedule is socio-personal variables and some general information about age, sex, marital status, education, no. of family members etc. The second part of the schedule is Land holdings per family, land types, irrigation facility. The third part of the schedule is the economics of others farming enterprises like livelihood, lac and last part of the schedule contained in the cost of cultivation of different crops.
4.4.2 Interview: Structured Interview:
It is a type of interview where each interviewee is asked the same questions, in the same way. Consistent responses are obtained by the posing questions in such a way that responds to each question is limited to choices that can be recorded numerically through the checklists. An interview used in which the interviewer asks the questions,
nothing more than it. The questions can only be answered yes, no or don’t know or know or not known or applied or
not applied. (Ray & Mondol, 1999) Unstructured Interview:
It is a method of interviews where questions can be changed to know respondent’s intelligence, understanding and belief. They do not offer a pre-set question for respondent, but they care about how each individual person responds to their questions. (Ray & Mondol, 1999)
5.RESULTS AND DISCUSSION:
5.1 Male & Female Population on the basis of age group
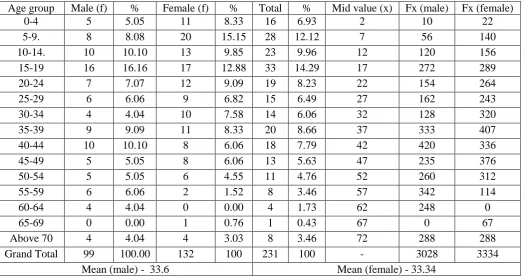
Table No. 1- Age wise male and female distribution
Age group Male (f) % Female (f) % Total % Mid value (x) Fx (male) Fx (female)
0-4 5 5.05 11 8.33 16 6.93 2 10 22
5-9. 8 8.08 20 15.15 28 12.12 7 56 140
10-14. 10 10.10 13 9.85 23 9.96 12 120 156
15-19 16 16.16 17 12.88 33 14.29 17 272 289
20-24 7 7.07 12 9.09 19 8.23 22 154 264
25-29 6 6.06 9 6.82 15 6.49 27 162 243
30-34 4 4.04 10 7.58 14 6.06 32 128 320
35-39 9 9.09 11 8.33 20 8.66 37 333 407
40-44 10 10.10 8 6.06 18 7.79 42 420 336
45-49 5 5.05 8 6.06 13 5.63 47 235 376
50-54 5 5.05 6 4.55 11 4.76 52 260 312
55-59 6 6.06 2 1.52 8 3.46 57 342 114
60-64 4 4.04 0 0.00 4 1.73 62 248 0
65-69 0 0.00 1 0.76 1 0.43 67 0 67
Above 70 4 4.04 4 3.03 8 3.46 72 288 288
Grand Total 99 100.00 132 100 231 100 - 3028 3334
Mean (male) - 33.6 Mean (female) - 33.34
From the Table No.1 we can find that the male population of the collected data is 99 and female population is 132. We divided the population as per age groups of a class interval of 4 years. From those age groups the male population is high in 15-19 age group female population is high in the age group of 5-9. The male population is lowest in the age group of 0-4 and female population is lowest in the age group of 65-69 age group. In age group of 65-69 there is 0 male population and in the age group 60-64 the female population is 0. The average age of male is 34 and the average age of female is 33.
0 5 10 15 20 25
N
u
mb
e
r o
f p
e
o
p
le
Age groups
Male & Female Population on the basis of age
group
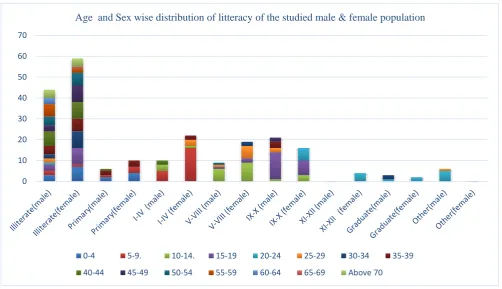
5.2 Age and Sex wise distribution of literacy of the studied male & female population
From the data of age and Sex wise distribution of literacy of the studied male & female population we get that in the age group of 5-9 literate population is higher, and in the age group of 40-44 the illiterate population is higher. The male literacy is higher than female. Most People left their study after class 4. Some extend it to the inter level (10th) but beyond that people are not interested in studies. Some males study in ITI for skill development (Table No. 2).
Table No.2 Age group wise Educational Status
Age grou p Illiter ate(m ale) Illitera te(fem ale) Prima ry(ma le) Prima ry(fem ale) I-IV (mal e) I-IV (fem ale) V-VIII (male ) V-VIII (femal e) IX-X (mal e) IX-X (fema le) XI-XII (male ) XI-XII (femal e) Gradu ate(ma le) Gradu ate(fem ale) Othe r(ma le) Other (fema le) T ot al
0-4 3 7 2 4 0 0 0 0 0 0 0 0 0 0 0 0 1
6
5-9. 2 1 1 3 5 16 0 0 0 0 0 0 0 0 0 0 2
8
10-14.
0 0 0 0 3 1 6 9 1 3 0 0 0 0 0 0 2
3
15-19
3 8 0 0 0 0 1 2 13 7 0 0 0 0 0 0 3
4
20-24
1 0 0 0 0 0 0 0 0 6 0 4 1 2 5 0 1
9
25-29
2 0 0 0 0 3 1 6 2 0 0 0 0 0 1 0 1
5
30-34
2 8 0 0 0 0 0 2 0 0 0 0 2 0 0 0 1
4
35-39
4 6 2 3 0 2 0 0 3 0 0 0 0 0 0 0 2
0
40-44
7 8 1 0 2 0 0 0 0 0 0 0 0 0 0 0 1
8
45-49
3 8 0 0 0 0 0 0 2 0 0 0 0 0 0 0 1
3
50-54
4 6 0 0 0 0 1 0 0 0 0 0 0 0 0 0 1
1
55-59
6 2 0 0 0 0 0 0 0 0 0 0 0 0 0 0 8
60-64
3 0 0 0 0 0 0 0 0 0 0 0 0 0 0 0 3
65-69
0 1 0 0 0 0 0 0 0 0 0 0 0 0 0 0 1
Abo ve 70
4 4 0 0 0 0 0 0 0 0 0 0 0 0 0 0 8
Gran 44 59 6 10 10 22 9 19 21 16 0 4 3 2 6 0 2
0 10 20 30 40 50 60 70
Age and Sex wise distribution of litteracy of the studied male & female population
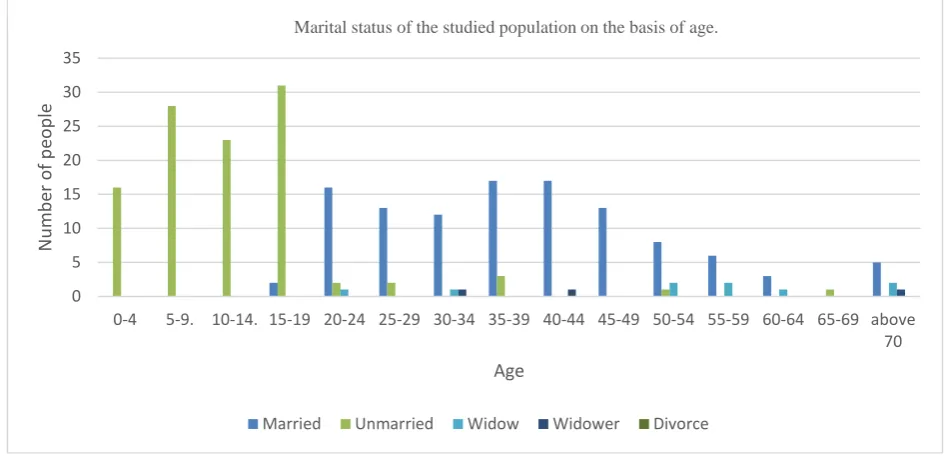
5.3 Marital status of the studied population on the basis of age On the basis of collected data total married population is 112 and unmarried population is 107. In the age group of 40-44 and 35-39 married population is higher and in the age group of 15-19 the unmarried population is higher. There are some rare cases of widow and widower and there is no case of divorce (Table No 3).
Table No.3 Age wise marital status
Table No.4 Distribution of family in the respect of family members
Family size No.of families % Total No.of family members %
1-3. 0 0.00 0 0.00
4-6. 31 73.81 131 56.71
7-9. 9 21.43 73 31.60
10&Above 2 4.76 27 11.69
Grand Total 42 100 231 100
0 5 10 15 20 25 30 35
0-4 5-9. 10-14. 15-19 20-24 25-29 30-34 35-39 40-44 45-49 50-54 55-59 60-64 65-69 above 70
N
u
m
b
er
o
f p
eo
p
le
Age
Marital status of the studied population on the basis of age.
Married Unmarried Widow Widower Divorce
Age group
Married % Unmarried % Widow % Widower % Divorce %
0-4 0 0.00 16 14.95 0 0.00 0 0.00 0 0
5-9. 0 0.00 28 26.17 0 0.00 0 0.00 0 0
10-14. 0 0.00 23 21.50 0 0.00 0 0.00 0 0
15-19 2 1.79 31 28.97 0 0.00 0 0.00 0 0
20-24 16 14.29 2 1.87 1 11.11 0 0.00 0 0
25-29 13 11.61 2 1.87 0 0.00 0 0.00 0 0
30-34 12 10.71 0 0.00 1 11.11 1 33.33 0 0
35-39 17 15.18 3 2.80 0 0.00 0 0.00 0 0
40-44 17 15.18 0 0.00 0 0.00 1 33.33 0 0
45-49 13 11.61 0 0.00 0 0.00 0 0.00 0 0
50-54 8 7.14 1 0.93 2 22.22 0 0.00 0 0
55-59 6 5.36 0 0.00 2 22.22 0 0.00 0 0
60-64 3 2.68 0 0.00 1 11.11 0 0.00 0 0
65-69 0 0.00 1 0.93 0 0.00 0 0.00 0 0
above 70 5 4.46 0 0.00 2 22.22 1 33.33 0 0
Grand Total
5.4 Distribution of family in the respect of family members
Most of the families are with the family number of 4-6 members. Only 9 families are there which consist 7-9 people and only 2 families are there which have 10 or above members in the family (Table No. 4).
6. SUMMERY:
We can find that the male population of the collected data is 99 and female population is 132. We divided the population as per age groups of a class interval of 4 years. From those age groups the male population is high in 15-19 age group female population is high in the age group of 5-9. The male population is lowest in the age group of 0-4 and female population is lowest in the age group of 65-69 age group. In age group of 65-69 there is 0 male population and in the age group 60-64 the female population is 0. The average age of male is 34 and the average age of female is 33. From the data of age and Sex wise distribution of literacy of the studied male & female population we get that in the age group of 5-9 literate population is higher, and in the age group of 40-44 the illiterate population is higher. The male literacy is higher than female. Most People left their study after class 4. Some extend it to the inter level (10th) but beyond that people are not interested in studies. Some males study in ITI for skill development. On the basis of collected data total married population is 112 and unmarried population is 107. In the age group of 40-44 and 35-39 married population is higher and in the age group of 15-19 the unmarried population is higher. There are some rare cases of widow and widower and there is no case of divorce. Most of the families are with the family number of 4-6 members. Only 9 families are there which consist 7-9 people and only 2 families are there which have 10 or above members in the family.
7. CONCLUSION:
If we can see the male and female population of the village we can easily said that the female sex ratio is high in the village. The educational qualifications of the females are also very good than the male. From this we can draw an inference that there is no discrimination in the male and female in the village and females are more capable than the male. Bedia males are little lazy than the females.
8. ACKNOWLEDGEMENT:
We are very grateful to the local key persons in the village and all the villagers who cooperate with us for collecting the data. We are also very grateful to our institution which financially help us a lot. We are grateful to all those who help us according to their capacity.
REFERENCES
1. Agrawal, A. (2004). 'The Bedias are Rajputs': Caste consciousness of a marginal community. Contributions to Indian sociology, 38(1-2), 221-246.
2. https://www.wikipedia.org/
3. Mishra, S. K. (2013). The Bedia of Jharkhand. The Oriental Anthropologist, 13(2), 517.
4. Ray GL and Mondol S. Research Methods in Social Science and Extension Education, Kalyani Publishers, New Delhi, Page 77-92
5. www.onefivenine.com 6. www.sameti.org
0
31 9
2
1-3. 4-6. 7-9. 10&Above
0 5 10 15 20 25 30 35