Modernizing animal agriculture for a cleaner
and healthier America: A policy memorandum
to the Congress of the United States
Jasmine A. F. Kreig
1†
, Sudershan Gangrade
1
, Deeksha
Rastogi
1
, Ryan J. Daniels
2
1Bredesen Center for Interdisciplinary Research and Graduate Education, University of Tennessee, Knoxville,
Knoxville, TN 37996-3394
2Department of Biosystems Engineering and Soil Sciences, University of Tennessee Institute of Agriculture, Knoxville, TN 37996-3394
†Corresponding author:
[email protected]
Keywords: animal agriculture; environment; carbon footprint; human health
Executive Summary: Through the Agricultural Act of 2014 (also known as the Farm Bill) and subsequent Farm Bills, the Congress of the United States can influence the agricultural sector in the US and impact the health of American citizens—the constituents they were elected to represent. In this memorandum, we outline the current state of animal agriculture, its resultant impacts on the environment and human health, and various policy proposals that Congress could enact to combat these issues. As of 2018, consumption of red meat (RM; includes beef, lamb, veal, and pork) in the US was 19.78 kg/capita higher than the global average (OECD 2018). Globally, animal agriculture accounts for approximately 15% of total greenhouse gas (GHG) emissions (FAO 2016) and contributes to poor health of individuals who consume red meat. These individuals are more prone to developing non-communicable diseases (NCDs), including coronary heart disease (CHD), stroke, and obesity (Wenpeng et al., 2016). Through redistributing subsidies already allocated in the Farm Bill and incentivizing the consumption of alternative nutritious options (ANOs; i.e., vegetables, fruit, and alternative proteins), Congress could significantly reduce the environmental burdens and negative public health outcomes of animal agriculture.
I. Introduction
The United States (hereafter US) is one of the largest consumers and key exporters of red meat (hereafter RM; includes beef, lamb, veal, and pork), which has led to a growing and prosperous domestic animal agriculture industry (Fields et al., 2018). As of 2018, annual consumption of RM in the US stands at 26.28 kg/capita compared to average global demand of 6.50 kg/capita (OECD 2018). This consumption is much higher than the medically recommended 18.2–26 kg/year (Chai 2017), resulting in a detrimental effect on public health. An excessive-RM-consuming population is more prone to develop non-communicable diseases (NCDs) including coronary
A primary cause of increased RM production is lower retail prices attributed to increased US federal subsidies for livestock agriculture, particularly through the Farm Bill (USDA 2018b). This study proposes comprehensive strategies to reduce overall production and consumption of RM in the US. These measures suggest modifications in both the supply and the demand side of the industry by using innovative measures such as redistributing subsidies in the Farm bill, providing tax credits for technology advancement and improvement of farming practices, modifying the Supplemental Nutrition Assistance Program (SNAP) and federal food assistance programs, and introducing an awareness campaign to encourage people to buy alternative nutritious options (ANOs) to supplement RM.
II. Impacts of animal agriculture i. Environmental impacts
Production of RM results in significant greenhouse gas (GHG) emissions. Globally, animal agriculture accounts for approximately 15% of total GHG emissions (FAO 2016). The main gases emitted at various stages of RM production include methane (CH4) (45–55% of RM-related emissions) and nitrous oxide (N2O) (35–45%), while carbon dioxide (CO2) constitutes only a small fraction (9%) of these emissions. These statistics are significant because CH4 and N2O are much more powerful GHGs than CO2: CH4 has 25 times the global warming potential of equivalent amounts of CO2, and N2O has 296 times that same potential (Gerber et al., 2013). In comparison, transportation emissions consist of 9% CH4, 5% N2O, and 34% CO2, giving them less global warming potential than equivalent amounts of GHG emissions from agriculture (US EPA 2018).
RM also has a high carbon and water footprint compared to other food items. For instance, lamb and beef have carbon footprints of ~19 and ~13 kg of CO2 equivalent/lb produced. Contrarily, food items such as chicken, fruits, and vegetables have lower carbon footprints of 1.4, 0.83, and 0.43 kg CO2 equivalent/lb, respectively (Greenway 2012). Similarly, RM production consumes larger amounts of water than production of other food items. For instance, beef, lamb, and pork production consume approximately 1874, 1493, and 728 gallons/lb, whereas chicken, fruits, and vegetables consume 293, 127, and 42 gallons/lb, respectively (Mekonnen and Hoekstra 2012). The total annual carbon and water footprint of
the RM industry in the US was estimated to be approximately 445 million metric tons of CO2 equivalents and 30 trillion gallons of water. These numbers are equivalent to 50 billion gallons of gasoline and 3 years of the combined US residential and public water demand, respectively. The energy consumed in beef (9139 BTU/lb) and pork (7504 BTU/lb) production (Capper 2011; Gilbert 2009) annually accounts for a total of 190 trillion BTU, which is the energy equivalent of powering residential homes in Chicago for 2.5 years (US DOE 2013). RM production is ecologically expensive given the amount of GHGs that are emitted and the size of both carbon and water footprints.
ii. Health impacts
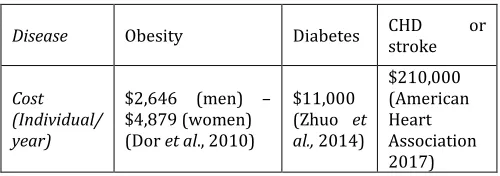
According to the FDA, NIH, and independent health research, overconsumption of RM increases the risk for developing non-communicable diseases (NCDs). The risk of NCDs such as coronary heart disease (CHD), stroke, obesity, and diabetes, can increase between 10 and 60% (Etemadi et al., 2017). The annual costs for an individual with some of these non-communicable diseases are summarized in Table 1. In 2013, taxpayers supported 59 million Americans on Medicaid, of which 28 million had obesity, 6 million had diabetes, and 400 thousand experienced CHD or stroke (CDC 2013). Further, the population below the federal poverty line (FPL) are the most susceptible demographic group for developing poor nutritional diets and NCDs (Muennig et al., 2010). In 2013, 43 million Americans were below the FPL and more than 28 million were either obese or pre-diabetic. Additionally, about 80% of Americans below the FPL with obesity are likely to develop prediabetes, of which 15–30% are likely to develop diabetes within 5 years given minimal diet/lifestyle changes (CDC 2017). The current consumption of RM in the US is likely to further increase NCD occurrences and strain the health care system.
Disease Obesity Diabetes CHD stroke or
Cost (Individual/ year)
$2,646 (men) –
$4,879 (women) (Dor et al., 2010)
$11,000 (Zhuo et al., 2014)
$210,000 (American Heart Association 2017)
III. Current policy and suggested measures There are three components to the proposed measure to reduce the environmental burdens and negative public health outcomes of animal agriculture: (1) redistribute subsidies in the Farm Bill to dilute the artificial monetary advantage of animal agriculture, (2) provide tax credits to industry to ease the transition away from animal agriculture, and (3) incentivize consumption of alternative nutritious options (ANOs) by beneficiaries of federal food assistance programs.
i. Subsidies in the farm bill
The Agricultural Act of 2014 (also known as the 2014 US Farm Bill; hereafter the Farm Bill) authorizes nutrition and agriculture programs in the US for 2014–2018 and includes approximately $955 billion in spending over the next 10 years (2014–2024). The Farm Bill provides financial assistance to the farming industry in the form of subsidies. As it stands, the bill allocates spending in five different categories: food stamps and nutrition, crop insurance, conservation, commodity programs, and livestock programs (Table 2).
Current Spending
(in billions) Suggested Spending (in billions)
Food stamps
and nutrition $756 Food and nutrition stamps $785.9
Crop insurance $89.8 Crop insurance $59.9
Conservation $56 Conservation $56
Commodity
programs $44.4 Commodity programs $14.8
Livestock
programs $8.2 Livestock programs $2.7
Tax credits $5.5
Specialty
programs $29.6
Total $954.4 Total $954.4
Table 2. Current and suggested spending (in billions) in the 2014
U.S. Farm Bill FY 2014–2023, including the two new spending categories: specialty programs and tax credits.
In its current form, we identify both commodity and crop insurances as inefficient programs. For instance, commodity programs provide subsidies to crops that are grown for both feedstock (such as corn) for animals and for human consumption. Further, crop insurance provides payments to farmers if the price of a crop falls below a certain limit set by Congress. Direct payments are provided to producers or landowners based on historical usage of the land (i.e., prior commodity crop production), irrespective of
current prices or conditions. Some individuals may receive payments for land they own, even if they are not currently producing commodity crops or if the land is no longer used for farming (USDA 2018a).
To tackle these issues, we suggest the creation of two new spending categories: specialty programs and tax credits. The total spending of the Farm Bill will remain constant through the redistribution of funds from inefficient programs to new categories (see Table 2 for current and suggested spending).
Specialty programs will provide subsidies to specialty crops (i.e., crops that are grown specifically for human consumption, like fruits and vegetables). As it currently stands, there are no subsidies for these specialty crops within the current Farm Bill. Thus, a specialty spending category would incentivize farmers to increase production of specialty crops. Funding for a specialty crop program will come from two-thirds of the current spending allocated for commodity programs. The remaining one-third of funding will stay with commodity programs.
Tax credits will also be implemented to increase the efficiency of Farm Bill spending. Currently, livestock producers may be eligible for financial assistance through USDA programs to counter the environmentally harmful effects of animal agriculture. Producers can apply to participate in programs, such as the Environmental Quality Incentives Program, which provide funding for environmental interventions such as cleaning up pollution or reducing soil erosion. Essentially, the
federal government absorbs some of the producers’
cost of the intervention. This assistance can happen even if livestock producers have enough money to pay for these services themselves. To address this inefficiency, one-third of spending on livestock programs will remain in livestock programs and the other two-thirds will be allocated for tax credits. Conservation spending will remain constant and food stamps and nutrition spending will increase by one-third of crop-insurance spending. Figure 1 provides a full breakdown of the current and proposed spending in the Farm Bill.
ii. Tax credits for industry
proteins. Alternative protein excludes all forms of RM but includes other foods that are high in protein such as beans, legumes, nuts, vegetarian protein (e.g., soy, seitan, tempeh, etc.), fish, white meat, and dairy products. Companies that begin to shift their food production to follow this trend within six months to one year of implementation of the policy are eligible for an Early Adopter Tax Credit. With this tax credit they are also eligible to receive free training programs. These training programs will teach the skills required to grow specialty crops and aid in the transition from livestock production to specialty crop production.
Agriculture companies, including RM producers that are unwilling or unable to switch, may also earn tax credits for reducing inefficiencies in production at the farm level. This includes actions such as manure management, implementing anaerobic digesters, changing crop management practices, reducing the amount of fertilizer applied, reducing the frequency of fertilizer application, updating irrigation practices, improving livestock practices, or implementing new technologies that help reduce the environmental impacts of agriculture. Each of these tax credits are worth 0.015% per year for major companies and 0.035% per year for medium or minor companies. Based on the redistribution of subsidies, there are $5.5 billion dollars available over 10 years for these tax credits.
iii. Food for the people
In addition to decreasing RM production, this policy strives to decrease RM consumption. By making strategic changes to federal food assistance programs, ANO consumption can be incentivized, reducing RM consumption. This trend in consumption should influence both demand and supply of RM, aiding in decreasing RM production.
iii.i. The Supplemental Nutrition Assistance Program The Supplemental Nutrition Assistance Program (SNAP) is the current form of food stamps. To incentivize ANO consumption, a 15% bonus credit for every dollar spent towards ANOs beyond 20% base spending with a cap of 50% spending will be provided. For example, if someone spent $50 on ANOs, they would receive an additional $4.50. This bonus credit can only be spent toward purchasing ANOs. If each of the approximately 44 million current SNAP recipients were to utilize this proposed
incentive, then an additional $3 billion dollars a year would be required. This $30 billion dollars over 10 years comes from the one-third of crop insurance subsidies that were redistributed to the food stamps and nutrition spending category, as can be seen in Figure 1.
Figure 1. Current (left) and suggested (right) spending (in billions)
in the 2014 U.S. Farm Bill FY 2014–2023, including the flow of money to fund the two new spending categories: specialty programs and tax credits.
iii.ii. Federal food assistance programs
Federal food assistance programs provide food assistance to low-income individuals by providing nutritious meals and snacks. In these programs, the federal government purchases food directly from producers. Some of these programs include the National School Lunch Program (NSLP) and the School Breakfast Program (SBP). Federal food assistance programs like these and others will no longer purchase RM and will provide alternative proteins listed under ANOs.
iii.iii. Federal dietary guidelines and awareness campaign
The federal government currently promotes healthy eating via a program called MyPlate that endorses the
dietary guidelines outlined in “Dietary Guidelines for
Americans 2015–2020”. MyPlate will continue to be
value of their food as well as the environmental impacts of their food choices.
Figure 2. Proposed environmental footprint label to be printed on
food products; label presented here is for beef.
IV. Summary
The excessive production and consumption of RM in the US is harmful not only to public health; it also degrades the environment through high GHG emissions and disproportionate water and energy use. This article presents potential policy instruments designed to tackle the issue by suggesting measures to the existing Farm Bill (The Agricultural Act of 2014). The key measures include incentives for ANOs purchased under the SNAP program, incentives to farmers to grow more ANOs or specialty crops as opposed to commodity crops (like corn that serves as animal feed), and tax credits and training programs to early-adopter companies and farmers for specialty crop production. These suggested reforms can be achieved through redistribution of subsidies by reducing budgets of existing inefficient programs such as commodity and crop-insurance programs. The suggested reforms are comprehensive in nature and likely to create a desired impact of reduced RM production and consumption, by not only promoting an ANO-based diet but also providing incentives towards efficient animal agricultural practices.
References
American Heart Association. 2017. Cardiovascular Disease: A Costly Burden for America Projections through 2035. Dallas: The American Heart Association Office of Federal Advocacy.
Capper, Judith L. 2011. “The environmental impact of beef
production in the United States: 1977 compared
with 2007.” Journal of Animal Science 89, no. 12:4249–4261.
Centers for Disease Control and Prevention. 2013. Obesity, Prediabetes, Diabetes, Depression, Heart Disease,
Stroke, and Cancer Data. Washington D.C.:
Centers for Disease Control and Prevention. https://www.cdc.gov/health/data/adult.html. Centers for Disease Control and Prevention. 2017. National
Diabetes Statistics Report. Washington D.C.:
United States Department of Health and Human Services.
Chai, Weiwen, Yukiko Morimoto, Robert V. Cooney, Adrian A. Franke, Yurri B. Shvetsov, Loic Le Marchand, Christopher A. Haiman, Laurence N. Kolonel, Marc T. Goodman, and Gertraud Maskarince. 2017. “Dietary Red and Processed Meat Intake
and Markers of Adiposity and Inflammation:
The Multiethnic Cohort Study.” Journal of
American College Nutrition 36, no. 5: 378–385.
Dor, Avi, Christine Ferguson, Casey Langwith, and Ellen Tan. 2010. “A Heavy Burden: The Individual
Costs of Being Overweight and Obese in the
United States.” The George Washington University Department of Health Policy Research
Report.
Etemadi, Arash, Rashmi Sinha, Mary H. Ward, Barry I. Graubard, Maki Inoue-Choi, Sanford M. Dawsey, and Christian C. Abnet. 2017. “Mortality from
different causes associated with meat, heme iron, nitrates, and nitrites in the NIH-AARP Diet and Health Study: population based cohort
study.” British Medical Journal 357: 1957–1963. Food and Agriculture Organization. 2016. Key facts and
findings: GHG emissions by livestock. Rome: Food
and Agriculture Organization of the United Nations.
Fields, KathrynAnn H., Dustin A. Therrien, Dan Halstrom, Joel Haggard, and Paul Clayton. 2018.
“International beef trade: A value proposition.”
Animal Frontiers 8, no. 3: 16–22.
Gerber, Pierre J. 2013. Tackling Climate Change Through
Livestock—A Global Assessment of Emissions and
Mitigation Opportunities. Rome: Food and
Agriculture Organization of the United Nations. Gilbert, John C. 2009. “Comparison and analysis of energy
consumption in typical Iowa swine finishing
systems.” Iowa State Graduate Theses and
Dissertations: 11006.
Greenway, Twilight. 2012. “Protein: The lay of the lamb”.
Mekonnen, Mesfin M. and Arjen Y. Hoekstra. 2012. “A
Global Assessment of the Water Footprint of
Farm Animal Products.” Ecosystems 15, no. 3: 401–415.
Muennig, Peter, Kevin Fiscella, Daniel Tancredi, and Peter Franks. 2010. “The Relative Health Burden of
Selected Social and Behavioral Risk Factors in
the United States: Implications for Policy.”
American Journal of Public Health 100, no. 9:
1758–1764.
Organisation for Economic Co-operation and Development. 2018. “Meat Consumption.”
https://data.oecd.org/agroutput/meat-consumption.htm.
Pimentel, David and Marcia Pimentel. 2003. “Sustainability
of meat-based and plant-based diets and the
environment.” The American Journal of Clinical
Nutrition 78, no. 3: 660S–663S.
Schwarzer, Stefan. 2012. “Growing Greenhouse Gas Emissions Due to Meat Production”, United
Nations Environment Programme.
https://na.unep.net/geas/getuneppagewithart icleidscript.php?article_id=92.
US Department of Agriculture. 2018a. Crop Insurance
Provision Programs. Washington D.C.: Economic
Research Service, United States Department of Agriculture,
https://www.ers.usda.gov/topics/farm- economy/farm-commodity-policy/crop-insurance-program-provisions-title-xi/ US Department of Agriculture. 2018b. Livestock Reports.
Washington D.C.: Risk Management Agency, United States Department of Agriculture, https://www.rma.usda.gov/tools/livestock.ht ml.
US Department of Energy. 2013. Newer U.S. homes are 30% larger but consume about as much energy as
older homes. Washington D.C.:
https://rpsc.energy.gov/energy-data-facts. US Environmental Protection Agency Office of
Transportation and Air Quality. 2018. Fast Facts U.S. Transportation Sector Greenhouse Gas
Emissions 1990–2016. Washington, D.C.:
https://nepis.epa.gov/Exe/ZyPDF.cgi?Dockey= P100USI5.pdf.
You, Wenpeng, and Maciej Henneberg. 2016. “Meat
consumption providing a surplus energy in modern diet contributes to obesity prevalence:
an ecological analysis.” BMC Nutrition 2, no. 1: 22–30.
Zhuo, Xiaohui, Ping Zhang, Lawrence Barker, Ann Albright, Theodore J. Thompson, and Edward Gregg. 2014. “The Lifetime Cost of Diabetes and Its
Implications for Diabetes Prevention.” Diabetes
Care 37, no. 9: 255702564.
Jasmine Kreig is a graduate fellow in the Bredesen Center for Interdisciplinary Research and Graduate Education at the University of Tennessee, Knoxville, pursuing a PhD in energy science and engineering. Jasmine holds a BS in environmental science and a BA in mathematics from the University of North Carolina at Chapel Hill. @jasmineafkreig
Sudershan Gangrade is a graduate fellow in the Bredesen Center, University of Tennessee, Knoxville, pursing a PhD in energy science and engineering. Sudershan holds a MS in environmental engineering and sciences from Clemson University, South Carolina, and a BS (BTech) in environmental engineering from the Indian School of Mines, Dhanbad, India. @gsudershang
Deeksha Rastogi is a graduate fellow in the Bredesen Center, University of Tennessee, Knoxville, pursing a PhD in energy science and engineering with a focus in climate and environment. Deeksha obtained a MS in atmospheric science from the University of Illinois at Urbana-Champaign in 2012 and a BS (BTech) from the Indian School of Mines, Dhanbad, India, in 2010. @dee_rastogi
Ryan J. Danielsis a design and controls engineer in the sheet metal industry developing next-generation automation control algorithms and equipment. In 2017, he graduated from the University of Tennessee
Institute of Agriculture with a master’s degree in biosystems engineering. Ryan holds a bachelor’s degree in