ISSN: 1942-9703 / CC BY-NC-ND Abstract—This paper presents a modelling approach for
monitoring and supervisory control the use of energy in buildings. The use of low-cost technology for monitoring and supervisory control of buildings especially the energy consumption is challenging and an open issue in current efforts to improve the efficiency and support the economic development. The low-cost system is very important if the technology is applied in developing countries due to limited funds to build supportive infrastructure and inadequate existing technology to be modified or reconfigured. Internet of Things technology is adopted in the implementation regarding the sensors and its connection to the network so the buildings energy use can be monitored from any location. There are similar technologies, but mostly they are not user-modifiable (open-source) and some of them use uncommon communication infrastructure. These can increase the inflexibility and the budget. The presented research is intended to provide a common modeling approach using Data Flow Diagram (DFD) and some model concept in Unified Modelling Language (UML) for a new alternative technology in monitoring and supervisory control. The approach was tested by using Android-based smart phones which is currently dominant used for connecting to internet. The test result in laboratory showed that the built system using Arduino Mega 2560 microcontroller equipped with sensor DHT22 had acceptable errors compared to the measurement using the standard digital measuring instruments, which are 0.27 oC for temperature and 2.67% for
relative humidity.
Index Terms—Internet of Things (IoT), condition monitoring,
telemetry, energy efficiency, energy conservation
Manuscript received June 19, 2018. This work was supported by DRPM
RistekDikti under Penelitian Strategis Nasional Institusi (PSNI) grant scheme. Seno D. Panjaitan is with Dept. of Electrical Engineering, Faculty of Engineering, Universitas Tanjungpura, West Kalimantan, Indonesia (e-mail: [email protected]).
Bomo W. Sanjaya is with Dept. of Electrical Engineering, Faculty of Engineering, Universitas Tanjungpura, West Kalimantan, Indonesia (e-mail: [email protected]).
Aryanto Hartoyo is with Dept. of Electrical Engineering, Faculty of Engineering, Universitas Tanjungpura, West Kalimantan, Indonesia (e-mail: [email protected]).
Rudi Kurnianto is with Dept. of Electrical Engineering, Faculty of Engineering, Universitas Tanjungpura, West Kalimantan, Indonesia (e-mail: [email protected]).
F. Trias P. Wigyarianto was with Dept. of Electrical Engineering, Faculty of Engineering, Universitas Tanjungpura, West Kalimantan, Indonesia (e-mail: [email protected]).
I. INTRODUCTION
HE telemetry technology in industry is indispensable to connect remote and separated devices and systems, used to send orders, programs and obtains data from an isolated area [1]. One of the common technologies used for telemetry is supervisory control and data acquisition (SCADA). It consists of computer equipment and programs that can provide information to users. For instance, it provides energy information so that users can measure, monitor and analyze their energy use and help identify energy saving opportunities. The trend to use telemetry system for building is growing up to support the energy conservation due to the limitation of the sources. The current SCADA-like technologies have good capabilities, but due to the huge cost of application and limited access to the system, the telemetry technology development issue for building energy efficiency remains open.
A monitoring system for building used to apply a platform that feasible for its environment and budget. This system in some application can be integrated with the control system to reduce the energy use in the building. The monitoring normally used to implement demand response arrangements [2]-[3]. A management system of building presents centralized functions of monitoring, control and recording of the services [4]-[6].
Internet of Things (IoT) is becoming a new trend now that enters many applications including smart homes/buildings. There are many tutorials available online or in academic publication discussing development concept and requirement in applying IoT such as in [7]. However, IoT still have some issues to increase its utilization such as unavailability of standards, system security assurance, and a lack of completely developed top-down application [8]. In commercial buildings, there are a wide range of requirements in monitoring that can increase the energy consumption and access management [9] – [11]. Furthermore, the idea using power over ethernet for monitoring LED lighting are described in [12] and example how to control the lighting based on Fuzzy Logic to reduce the energy consumption can be seen in [13].
A Modeling Approach for Mobile Monitoring
and Supervisory Control Development based on
Open-source Programming
Seno D. Panjaitan, Bomo W. Sanjaya, Aryanto Hartoyo, Rudi Kurnianto, and F. Trias P. Wigyarianto
However, the network traffic is one of the considerations in developing monitoring system based IoT technology. It is recommended to anticipate network migration by IoT traffic carriers (e.g. from building to the cloud) to increase flexibility and resource optimization [14]-[17]. Furthermore, one of the challenges to endorse IoT technologies in the smart building is security assurance. For instance, in the market, IoT products designed with adequate IoT security is not more than 10%, as reported in [18]–[19].
Some examples of current monitoring system using mobile application are as follows: home automation system [20]-[21], biogas reactor for power plant [22]. The communication infrastructure is also very important to be considered in IoT system development. Monitoring system using non-android based smart phones is proposed in [23-24], however it might have obstacle for market in developing countries such as in Indonesia since Android-based devices are dominant. Therefore, to have an open-source system, a modelling
approach is needed, which the system later can be modified or
upgrade easily without having to spend significant budget for vendor or supplier for new system requirements. This paper proposes a modeling approach that can be reuse for simple monitoring and supervisory control of buildings. The model bases on Unified Modeling Language (UML), data flow diagram (DFD), Android-based system development which are available in many websites and can be installed without any cost.
II. DESCRIPTION OF THE MONITORING SYSTEM
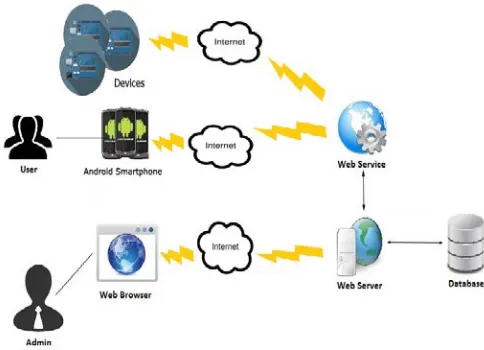
Fig. 1 shows informal or physical architecture of the monitoring system that have been modelled and built. The system involves control devices (microcontrollers, sensors, and monitoring equipment) and communication infrastructure. The idea of monitoring is to collect the data in buildings using IoT sensors, then processes the data through analog to digital converter and microcontroller that is working with a specific frequency. The controller employed Arduino Mega 2560 microcontroller. Microcontroller programming uses Bascom AVR. The program development is intended for data storage in SD Card with Serial Peripheral Interface (SPI) data communication type, microcontroller communication with modem serially using AT (ATtention) command, and communication with external input / output connected to sensor / actuator.
The data is recorded into secure digital memory (i.e., SD card) and sent to the internet networking to be available for user who read through mobile devices. The SD card has a flash memory inside for read, write, delete, and error control of data. It has main function to back-up data. Real Time Clock
(RTC) with Inter Interface Circular (I2C) interface is used to
get real time data. The main feature of RTC can calculate seconds, minutes, hours, date, year with correction leap year to year 2,100. Data can be saved with help of backup battery, and
I2C interface.
In the sensor circuit, sensors for measuring temperature and relative humidity (RH) was used for energy systems in
buildings. Temperature calculation is based on Celsius units, while RH uses a percent unit. To obtain a more accurate RH value over a wide temperature range, it has been compensated using the Automatic Temperature Compensation (ATC) function. Temperature and RH that are measured are then sent to an android-based data access device (e.g. smartphone), as shown in Fig. 1.
In the software development, the features used on android are the application framework in the form of menu / submenu (which allows the use and deletion of components available on the menu / submenu), virtual Dalvik engine (virtual machine optimized for mobile devices), graphics (2D and 3D graphics based on library openGL), SQLite (for storing data), image media, communication systems (GSM, 3G, WIFI, Bluetooth). The android application development in this research used Java Eclipse with Software Development Kit (SDK) installed in android-based access module as library of common class of program used and Abstract Data Type (ADT) for Java Eclipse program interface with android operating system.
III. MODELLING APPROACH
The modelling approach employ some diagrams from computer science namely DFD and UML that have main purpose to give a comprehensive model for the system in any level of system development. A related example of development process model for distributed system using UML can be seen in detail in [25]. Other formal modelling that can also be considered is Petri net, for instance the one that is described in [26]. By having a general model, the system can easily be modified and reconfigured.
A. Use Case Diagram (UML Model)
This Diagram is a graphical representation of actors, cases, and interactions among them such as introducing a system. Fig. 2 depicts the Use Case diagram for the monitoring system. It can be that there are two kinds of actor in the system, namely admin and user. Admin has more access than
ISSN: 1942-9703 / CC BY-NC-ND
user, while user (one or more) needs a security code for login to the system. This security access is to secure all the information collected during the monitoring and to avoid spam that can affect the system performance.
The modelling approach can be more transparent using this model. Deleting or adding of system function or actors can be done by keeping the general idea still understandable and reconfigurable.
B. DFD model
DFD is a model that graphically represents the data flow in the system and its process modelling feature. It is commonly applied to model an initial stage to create a system overview by reduce the technical details, which can be elaborated afterwards. It can also be employed for data processing picturing. The DFD can show physical or logical model of data in the system. The proposed DFD model can guide the developer to build and to modify a simple monitoring system easily in various open sources and programming code since the idea is mainly similar.
Fig. 3 shows DFD for the monitoring system. The rectangle box is for data input/output, the circle shape is for function and the arrow shows the data flow, usually from input/output to a function, or vice versa. The activities described in the DFD is the following: USER can login to the system to get the monitored data from the system, DEVICE sends monitored
data to the system, ADMINISTRATOR can login to the system to get privilege for system management activity. It is quite different with the use case diagram (cf. Fig. 2) which more focuses on the actor and its function, the DFD describes the data managed by each actor dan main device in the developed system.
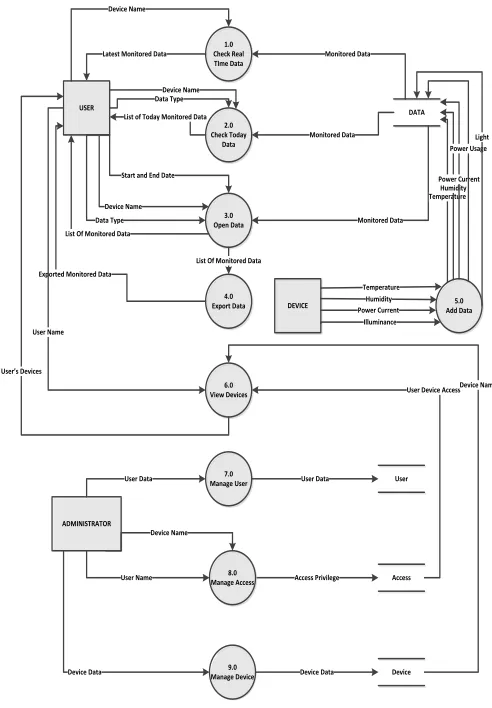
Fig. 4 describes the DFD model of overall data flow in the monitoring system. It has nine functions related to the data management: check real-time data, check today data, open data, export data, add data, view devices, manage user, manage access, and manage devices.
The data management in DFD furthermore can be explained as follows:
1) The USER can check real time data by providing the
device name. The DATA in database also provide the monitored data to complete the process.
2) The USER can also check today data by providing device
name and data type. The DATA in database also provide the monitored data to complete the process.
3) The USER can open data by providing start date and end
date, data type, and device name. The DATA in database also provide the monitored data to complete the process
4) The USER can export the opened data after open the data.
The process will give the exported version of data to the USER.
Fig. 4. DFD of the overall system
USER
1.0 Check Real TIme Data
3.0 Open Data
ADMINISTRATOR
4.0 Export Data
9.0 Manage Device
DATA 2.0
Check Today Data
7.0
Manage User User
Access Monitored Data Latest Monitored Data
Data Type
Monitored Data List of Today Monitored Data
Start and End Date
Monitored Data Device Name
Device Name
Device Name Data Type List Of Monitored Data
List Of Monitored Data Exported Monitored Data
User Data User Data
Access Privilege 8.0
Manage Access User Name
Device Name
Device Device Data Device Data
DEVICE Add Data5.0 Temperature
Humidity Power Current
Illuminance
TemperatureHumidity Power Current
Power UsageLight
6.0
View Devices User Device Access Device Name User Name
User’s Devices
USER
ADMINISTRATOR
DEVICE 0.0
Sensor Data Monitoring System Login
Monitored Data Monitored Data
System Management Access Login
Fig. 3. DFD model of the system
Fig. 2. Use case Diagram of the monitoring and supervisory control system
User
Admin
Login
«extends» Logout
Select Location
Online Monitoring
Open Achieved Data Record Data
Set Interval Data Update Add User
Delete User
Change User Data Control User Data
Access
Add Device
Delete Device
Change Device Data
«extends»
«extends» «extends»
«extends»
5) The DEVICE can add the data to the database. The DEVICE provides four types of data (temperature, humidity, power current, illumination/light data). The process will add five types of data to the DATA database (temperature, humidity, power current, power usage, illumination/light data).
6) The USER can view devices by providing user name. The
DEVICE database provide the device name data and the ACCESS database provide the User Device Access data to complete the process.
7) The ADMINISTRATOR can manage user data by
providing user data. The process will change user data in the USER database.
8) The ADMINISTRATOR can manage user access to
device by providing device name and user name. The process will change Access privilege data in the ACCESS database.
9) The ADMINISTRATOR can manage device by providing
device data. The process will change device data in the DEVICE database.
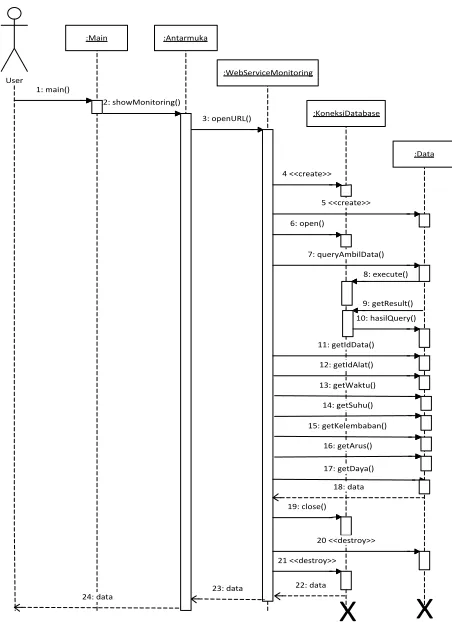
C. Sequence Diagram (UML Model)
Sequence diagram are used to provide a detailed overview of each use case diagram created earlier and shows interactions between objects. Each object involved in a use case is represented by a vertical dashed line, then the message sent by the object is described horizontally in chronological order from top to bottom.
In this case, there 14 sequence diagrams built for each case. Due to the limitation of space in this paper, only sequence diagram for online monitoring is presented, as shown in Fig. 5. In this diagram, there are five objects that have interactions each other in the described sequence: Main, interface (i.e.,
Antarmuka), WebServiceMonitoring, Database connection
(i.e., KoneksiDatabase), and Data. This sequence runs once a
user wants to monitor the measured data (i.e., device identity, time, temperature, RH, and power consumed through the measured current).
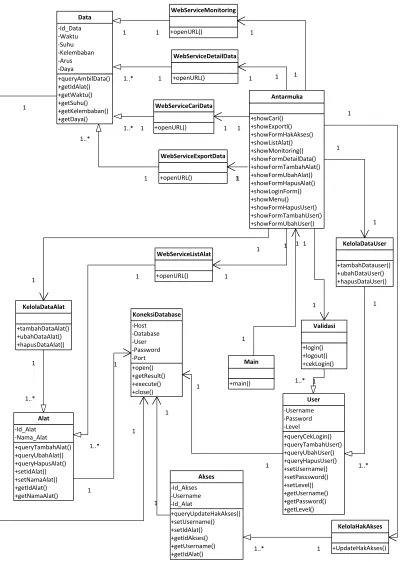
D. Class Diagram (UML Model)
Class diagram is one of the main diagrams of UML to describe a class or blueprint object in a system. This diagram is related to the programming based on object-oriented concept. Fig. 6 shows the class diagram for the monitoring system.
IV. MOBILE MONITORING INTERFACE
Fig. 7 shows the snapshot of the mobile application for monitoring system and the hardware for data measuring and communication. The mobile application works as designed in the models. User must input username and password for login. If the login is succeeded, the system will get the device list data from the server and display it to user mobile’s screen. The login information must be exact the same with the one that was recorded to avoid the failure. After user success login to the system, user can do logout process or go to the Home
layout. If user choose to go to Home, the system will get latest data from the server and display it to the user’s screen.
If user is going to look for detailed data, user can choose the specific type of data, and the system will get the specific type’s today data from the server and display it to the user’s screen. If not user can go back to the home layout. If user is going to open monitored data, user input the start and end date first, then the system will get(open) data from the server and display it to the user screen’s. If not user can go back to the Specific Data Type layout. If user choose to export data, the system will export the opened data, and save it to the user’s storage, otherwise user can go back to the open data layout. If user choose to logout, system process is ended. The result of measurement of for several rooms in Table I shows that the
developed system has overall average error 0.27 oC for
temperature and 2.67 % for RH.
V. CONCLUSION
This paper has elucidated a modelling approach using DFD and UML to pave away a comprehensive process on mobile monitoring system development. Some aspects are covered in these various modeling concept: use case diagram (relationship of the system’s actors), DFD (model for data management system), sequence diagram (show the logical sequence in each case in use case diagram), and class diagram (model for coding based on object-oriented programming). This modeling approach can help designer of monitoring
User
:Main :Antarmuka
:WebServiceMonitoring
:KoneksiDatabase
:Data 1: main()
3: openURL()
4 <<create>>
5 <<create>> 6: open()
7: queryAmbilData()
9: getResult() 10: hasilQuery()
11: getIdData() 12: getIdAlat()
19: close()
20 <<destroy>> 21 <<destroy>>
22: data 23: data
24: data
X
X
8: execute() 2: showMonitoring()
18: data 13: getWaktu()
14: getSuhu() 15: getKelembaban()
16: getArus()
17: getDaya()
ISSN: 1942-9703 / CC BY-NC-ND
system to reuse and reconfigure the model for similar purpose by maintaining the main idea of the system, in other word, this model gains the system development understanding.
ACKNOWLEDGMENT
Authors thanks to Steven Pragestu and Zulkifli to support in programming and data collection in the experiment, and also the anonymous reviewers.
+queryAmbilData() +getIdAlat() +getWaktu() +getSuhu() +getKelembaban() +getDaya() -Id_Data -Waktu -Suhu -Kelembaban -Arus -Daya
Data
+open() +getResult() +execute() +close() -Host -Database -User -Password -Port
KoneksiDatabase
+main()
Main
+queryTambahAlat() +queryUbahAlat() +queryHapusAlat() +setIdAlat() +setNamaAlat() +getIdAlat() +getNamaAlat() -Id_Alat -Nama_Alat
Alat
+openURL()
WebServiceMonitoring
+openURL()
WebServiceDetailData
+queryCekLogin() +queryTambahUser() +queryUbahUser() +queryHapusUser() +setUsername() +setPasssword() +setLevel() +getUsername() +getPassword() +getLevel() -Username -Password -Level
User
+login() +logout() +cekLogin()
Validasi
+showCari() +showExportl() +showFormHakAkses() +showListAlat() +showMonitoring() +showFormDetailData() +showFormTambahAlat() +showFormUbahAlat() +showFormHapusAlat() +showLoginForm() +showMenu() +showFormHapusUser() +showFormTambahUser() +showFormUbahUser()
Antarmuka
+openURL()
WebServiceCariData
+openURL()
WebServiceExportData
11
1 1
1 1
1
1
1 1
1..* 1
1..* 1 1..*
1
+tambahDataAlat() +ubahDataAlat() +hapusDataAlat()
KelolaDataAlat
1
1
1
1
1 1
1
1
1 1..* 1
1
1
1..*
1 1
+tambahDatauser() +ubahDataUser() +hapusDataUser()
KelolaDataUser
1 1
1..* 1 +openURL()
WebServiceListAlat
1
1
1..*
1
+queryUpdateHakAkses() +setUsername() +setIdAlat() +getIdAkses() +getUsername() +getIdAlat() -Id_Akses -Username -Id_Alat
Akses
1 1
+UpdateHakAkses()
KelolaHakAkses
1 1
1..* 1
REFERENCES
[1] B. David and W. Edwin, Practical SCADA for Industry. Oxford:
Newnes, an imprint of Elsevier, 2003.
[2] A. H. Oti E. Kurul F. Cheung J. H. M. Tah, “A framework for the
utilization of building management system data in building information
models for building design and operation,” Automation in Construction,
vol. 72, pp. 195-210, Dec. 2016.
[3] E. Z. Tragos, M. Foti, M. Surligas, G. Lambropoulos, S. Pournaras, S.
Papadakis, V. Angelakis, “An IoT based intelligent building
management system for ambient assisted living,” in Proc. IEEE
International Conference on Communication Workshop (ICCW), London, 2015, pp. 246-252.
[4] P. Bellagente, P. Ferrari, A. Flammini and S. Rinaldi, "Adopting IoT
framework for Energy Management of Smart Building: A real test-case," 2015 IEEE 1st International Forum on Research and Technologies
for Society and Industry Leveraging a better tomorrow (RTSI), Turin, 2015, pp. 138-143.
[5] F. Tao, Y. Wang Y. Zuo H. Yang, and M. Zhang, "Internet of Things in
product life-cycle energy management", Journal of Industrial Information Integration, Vol. 1 pp. 26-39, Mar. 2016.
[6] Y. Sun, T. Y. Wu, G. Zhao and M. Guizani, "Efficient Rule Engine for
Smart Building Systems," in IEEE Transactions on Computers, vol. 64, no. 6, pp. 1658-1669, June 1 2015.
[7] D. Minoli, Building the Internet of Things with IPv6 and MIPv6. New
Jersey: John Wiley & Sons, Inc., 2013.
[8] D. Minoli, K. Sohraby and B. Occhiogrosso, "IoT Considerations,
Requirements, and Architectures for Smart Buildings—Energy Optimization and Next-Generation Building Management Systems," in IEEE Internet of Things Journal, vol. 4, no. 1, pp. 269-283, Feb. 2017.
[9] I. Mauser J. Feder J. Müller, and H. Schmeck, "Evolutionary
optimization of smart buildings with interdependent devices" Proc. Of the 18th European Conference, EvoApplications 2015, Copenhagen Denmark, Part of Lecture Notes in Computing Science Book series Vol. 9082, Springer pp. 239-251, 2015.
[10] C. Keles, A. Karabiber, M. Akcin, A. Kaygusuz, B.B. Alagoz, and O.
Gul, "A smart building power management concept: Smart socket applications with DC distribution" Int. J. Elect. Power Energy Syst. vol. 64 pp. 679-688 Jan. 2015.
[11] H. Ghayvat S. Mukhopadhyay X. Gui N. Suryadevara "WSN-and
IOT-based smart homes and their extension to smart buildings" Sensors vol. 15 no. 5 pp. 10350-10379 2015.
[12] M. Magno, T. Polonelli, L. Benini and E. Popovici, "A Low Cost,
Highly Scalable Wireless Sensor Network Solution to Achieve Smart LED Light Control for Green Buildings," in IEEE Sensors Journal, vol. 15, no. 5, pp. 2963-2973, May 2015.
[13] S.D. Panjaitan, A. Hartoyo, “A Lighting Control System in Buildings
based on Fuzzy Logic”, TELKOMNIKA, Vol. 9, No. 3, 2013.
[14] K. Xu, X. Wang, W. Wei, H. Song and B. Mao, "Toward software
defined smart home," in IEEE Communications Magazine, vol. 54, no. 5, pp. 116-122, May 2016.
[15] S. K. Tayyaba et al., “Software-defined networks (SDNs) and Internet of
Things (IoTs): A qualitative prediction for 2020,” Int. J. Adv. Comput. Sci. Appl., vol. 7, no. 11, pp. 385–403, 2016.
[16] B. Han, V. Gopalakrishnan, L. Ji, and S. Lee, “Network function
virtualization: Challenges and opportunities for innovations,” IEEE Commun. Mag., vol. 53, no. 2, pp. 90–97, Feb. 2015.
[17] K. Joshi and T. Benson, “Network function virtualization,” IEEE
Internet Comput., vol. 20, no. 6, pp. 7–9, Nov./Dec. 2016.
[18] B. Özbek, Y. Aydo˘gmu¸s, A. Ula¸s, B. Gorkemli, and K. Ulusoy,
“Energy aware routing and traffic management for software defined
networks,” in Proc. IEEE NetSoft Conf. Workshops (NetSoft), Seoul, South Korea, Jun. 2016, pp. 73–77.
[19] J. Granjal, E. Monteiro and J. Sá Silva, “Security for the Internet of
Things: A Survey of Existing Protocols and Open Research Issues,” in IEEE Communications Surveys & Tutorials, vol. 17, no. 3, pp. 1294-1312, thirdquarter 2015.
[20] A. Al-Fuqaha, M. Guizani, M. Mohammadi, M. Aledhari and M.
Ayyash, "Internet of Things: A Survey on Enabling Technologies, Protocols, and Applications," in IEEE Communications Surveys & Tutorials, vol. 17, no. 4, pp. 2347-2376, Fourthquarter 2015.
[21] R. A. Alzafarani and G. A. Alyahya, "Energy efficient IoT home
monitoring and automation system," 2018 15th Learning and Technology Conference, Jeddah, Saudi Arabia, 2018, pp. 107-111.
[22] S.D. Panjaitan, N. Fratama, A. Hartoyo, R. Kurnianto, “Telemonitoring
Temperature and Humidity at Bio-energy Process using Smart Phones”, TELKOMNIKA, Vol 14, No. 2, pp. 762-771, June 2016.
[23] T. Y. Yang, C. S. Yang and T. W. Sung, "An Intelligent Energy
Management Scheme with Monitoring and Scheduling Approach for IoT Applications in Smart Home," 2015 Third International Conference on Robot, Vision and Signal Processing (RVSP), Kaohsiung, 2015, pp. 216-219.
[24] C.K. Harnett, ‘Open Wireless Sensor Network Telemetry Platform for
Mobile Phones.” IEEE Sensor Journal, Vol. 10 No. 6, pp. 1083-1084,
2010.
[25] S.D. Panjaitan, “Development Process for Distributed Automation
Systems based on Elementary Mechatronic Functions” Book published by Shaker-Verlag Germany, 2008.
[26] D. Ivanova, I. Batchkova, S. Panjaitan, F. Wagner, and G. Frey,
“Combining IEC 61499 and ISA S88 for batch control”, Proceedings of
(a) (b)
(c) (d)
Fig. 7. User Interface in Smart-phone for monitoring system: (a) Login to the system, (b) System’s hardware (c) Display the temperature as table (can also displayed as graph), (d) Some energy monitoring parameters
TABLEI
COMPARISON MEASURED TEMPERETURE AND RH:STANDAR VS MOBILE
MONITORING VALUES
No. Location Averaged
Temperature (oC) Averaged RH (%)
Standar Mobile
Monitoring Standar
Mobile Monitoring
1 Digital
Workshop
28.5 28.3 54 47.2
3 Lab assistance
room 1
25 26.4 42 41.4
4 Lab assistance
room 1
24.4 23.6 42 41.4
Overall Average
ISSN: 1942-9703 / CC BY-NC-ND
the 13th IFAC Symposium on Information Control Problems in
Manufacturing, Moscow, 2009, pp. 187-192.
Seno D. Panjaitan was born in Pontianak – Indonesia, 16 July 1975. He has accomplished his bachelor degree (1997) at Universitas Tanjungpura, Pontianak, Indonesia and Master of degree (2001) at Institut Teknologi Bandung, Indonesia, both in engineering subject (i.e. control engineering). He achieved his doctoral title (2007) from University Kaiserslautern, in field automation and control. He became a student IEEE student member from 2006-2008, then became a professional member IEEE since 2011, and currently is joining some societies: IEEE RAS, IEEE Control Systems, IEEE PES, and IEEE Smart Grid Community. He is now Assoc. Prof. in Dept. of Electrical Engineering, Universitas Tanjungpura. His research interests are in automation, control, Computational intelligence, and smart energy systems.
Aryanto Hartoyo has received bachelor degree in control engineering in 1984 and Master degree in energy management in 2010 from Universitas Tanjungpura. He is a Senior Lecturer at Universitas Tanjungpura. His researches are mostly in digital control engineering especially in microcontroller-based system.
Bomo W. Sanjaya was born in Pontianak, 1st April 1974. He received bachelor title from the electrical engineering department, Universitas Tanjungpura (2008), and the master degree (2013) and doctoral degree (2014) in control engineering from the school of electrical engineering and informatics, Institut Teknologi Bandung, Indonesia. He is now a lecturer at the Dept. of electrical engineering, Universitas Tanjungpura. His current research interests are in fuzzy logic, neural networks, control of nonlinear dynamical systems.
Rudi Kurnianto has received bachelor degree in electrical engineering from Universitas Tanjungpura (1994) and master degree at the same subject in 2001 from Institut Teknologi Bandung. He obtained his doctoral title in High Voltage Engineering from Toyohashi University of Technology (2008). He is with Dept. Electrical Engineering, Universitas Tanjungpura since January 1995. His research interests are on high voltage engineering and power systems.