Available Online at www.ijpret.com 137
INTERNATIONAL JOURNAL OF PURE AND
APPLIED RESEARCH IN ENGINEERING
AND TECHNOLOGY
A PATH FOR HORIZING YOUR INNOVATIVE WORK
GEOGRAPHICAL INFORMATION SYSTEM BASED MORPHOMETRIC
ANALYSIS OF MAN RIVER BASIN, AKOLA AND BULDHANA DISTRICTS
KHADRI S.F.R, KANAK MOHARIR
Department of Geology, Sant Gadge Baba Amravati University, Amravati Accepted Date: 15/03/2016; Published Date: 01/05/2016
\
Abstract:The present study of morphometry analysis is used in several disciplines to mean the measurement
and analysis of form characteristics. For detailed study data for preparing DEM, aspect grid and slope maps and GIS was used in evaluation of basic, linear, areal and relief aspects of morphometric parameters. Watershed boundary, flow accumulation, flow direction, flow length, stream ordering have prepared using spatial analyst Tool. Hydrological module of ARC GIS 10.1 software was utilized for calculation and delineation of the watershed and morphometric analysis of the watershed using spatial analyst tool. The dendritic type drainage network of the basin exhibits the homogeneity in texture and lack of structural control. The Stream order ranges from first to fifth order. The drainage density in the area has been found to be low to medium which indicates that the area possesses highly permeable soils and low relief. The bifurcation ratio varies from 4.80 to 8 and the elongation ratio is 0.21 which reveals that the basin belongs to the medium elongated shaped basin category. The mean Rb of the entire basin is 5.95 which indicate that the drainage pattern is not much
influenced by geological structures. The Land use map of the watershed was generated from latest available multispectral satellite data and whole watershed covers under agricultural land, settlement, fallow land, forest and water body. The present study of morphometric analyses suggests that the soil erosional development of the area by the streams has improved well beyond maturity and that lithology has an influence in the drainage development. These studies are very useful for planning rainwater harvesting and soil and water resources management and development.
KEYWORDS: GIS, Remote sensing, LULC map, Morphometric analysis and Arc hydro tools.
m
Corresponding Author: MS. KHADRI S.F.R
Access Online On:
www.ijpret.com
How to Cite This Article:
Khadri S. F. R., IJPRET, 2016; Volume 4 (9): 137-150
Available Online at www.ijpret.com 138 INTRODUCTION
The morphometric elements parameters the spatial data information for groundwater potential, runoff and geographic characteristics of the drainage basin. The various morphometric properties depend on various aspects like geology, geomorphology, vegetation and climate etc. The water demand is growing as the world population is growing and more and more urbanization is taking place worldwide. On the other hand, water resources are limited, increasing demand for various water uses and decreasing access to good-quality water as most of the nearby and good-quality sources have already been overexploited (Sharma and Vairavamoorthy 2009; Diwakar and Thakur 2012). The ever-growing population and urbanization is leading to over-utilization of the resources, thus exerting pressure on the limited civic amenities, which are on the brink of collapse (Singh et al., 2013; Jha et al., 2007; Khadri, S.F.R and Kanak Moharir 2013). A drainage map of basin provides a reliable index of permeability of rocks and their relationship between rock type, structures and their hydrological status. Remote sensing data, along with increased resolution from satellite platforms, makes these technologies appear poised to make a better impact on land resource management initiatives involved in monitoring LULC mapping and change detection at varying spatial ranges in semi-arid regions is undergoing severe stresses due to the combined effects of growing population and climate change. (Singh et al., 2012;Khadri, S. F. R and Chaitanya B. Pande (2014).
Available Online at www.ijpret.com 139 STUDY AREA
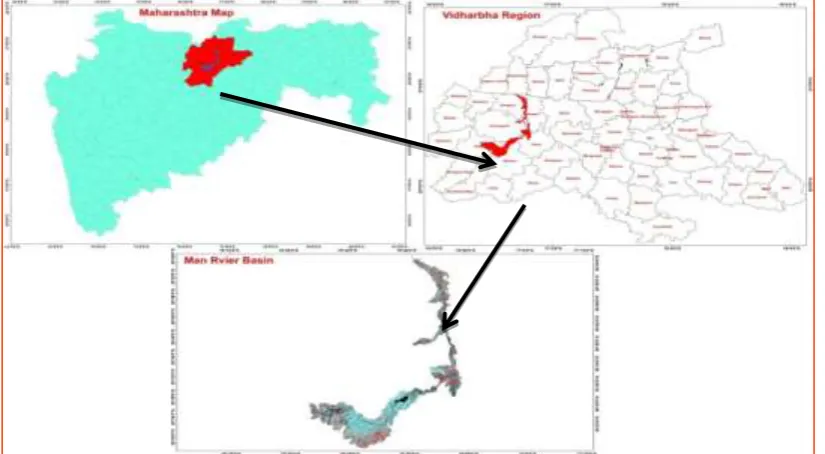
The Man River Basin is situated in Akola and Buldhana Districts, Maharashtra which is located between 20°54′ 59” N latitude and 76° 41’23’’ E longitude. The study area is covered by Survey of India toposheets55D/7, 55D/9, 55D/11, 55D/13, 55D/14 and 55D/15 on 1:50,000 scale. (Fig.1)
The Man River basin which is a major tributary of Purna River lies towards the western and southern part of Akola and Buldhana districts. The total area has been covered by Man River basins 447.80 Sq. Kms. and present study area occupied by alluvium and Deccan basalts which are horizontally disposed and is traversed by well-developed sets of joints.
Fig. 1 Location map of Man River Basin
MATERIALS AND METHODS:
Available Online at www.ijpret.com 140 using the standard methodologies as shown in Table 1. Moreover, GIS technology was used to generate several other layers of maps such as map of elevation zones of the basin, map of the slope map etc. Of the area and showing distribution and concentration of the natural springs irrespective of the size and discharge in different geological zones to validate the results and inferences drawn through morphometric analysis. Finally, by assembling the whole data generated, soil and water conservations sites and erosion of the area were identified. The selected satellite image from 2015 respectively for assessment of land use and land cover pattern. These images were classified in the ERDAS image processing software by supervise and unsupervised classification techniques for land use/land cover classification. In this present study area boundary was superimposed over satellite imagery and cropped the study area. After those administrative boundaries of selected villages were also superimposed on classified satellite images known as the study area wise land use/ land cover analysis. Obtained results were converted in percentage of area from hectors unit by mathematical calculation for to know the areas under various sectors. Final land use/ land cover maps were prepared from LISS 3 satellite images, ground truth and referred by previous land use land cover map.
RESULTS AND DISCUSSIONS:
Available Online at www.ijpret.com 141 by Strahler (1964).Factors controlling groundwater storage are different in space and time, and the majority of these factors depend on the following parameters: (1) rainfall availability as the source of water; (2) drainage characteristics have a role in the distribution of runoff and indicate an infiltration scheme and it governs the behavior of water flow on terrain surface vertically and horizontally; (3) rock type for which the lithologic character governs the flow and storage management; (4) slope is another influencing factor, and it controls water flow energy, which plays a role in facilitating water flow in the basin. The morphometric analysis can be achieved through measurements of linear, areal and relief aspects of basin.Quantitative analysis of Man River Basin has been carried out to evaluate the drainage characteristics using GIS software for calculation and topology building of different morphometric parameters. Important Linear and Arial parameters and their characteristic were calculated such as basin area, perimeter , basin length , bifurcation ratio (Rb), drainage density (Dd), stream frequency (Fs) circulatory ratio (Rc), elongation ratios (Re) etc. The drainage patterns of the watershed are dendritic with fifth order streams. The details of various morphometric parameter and law used in the present work are shown in Table 1.
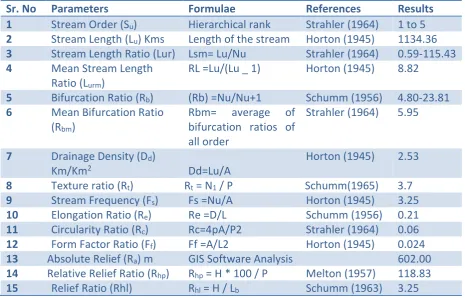
Table 1 Result and Methodology adopted for computations of morphometric parameters
Sr. No Parameters Formulae References Results
1 Stream Order (Su) Hierarchical rank Strahler (1964) 1 to 5
2 Stream Length (Lu) Kms Length of the stream Horton (1945) 1134.36
3 Stream Length Ratio (Lur) Lsm= Lu/Nu Strahler (1964) 0.59-115.43
4 Mean Stream Length
Ratio (Lurm)
RL =Lu/(Lu _ 1) Horton (1945) 8.82
5 Bifurcation Ratio (Rb) (Rb) =Nu/Nu+1 Schumm (1956) 4.80-23.81
6 Mean Bifurcation Ratio
(Rbm)
Rbm= average of
bifurcation ratios of all order
Strahler (1964) 5.95
7 Drainage Density (Dd)
Km/Km2 Dd=Lu/A
Horton (1945) 2.53
8 Texture ratio (Rt) Rt = N1 / P Schumm(1965) 3.7
9 Stream Frequency (Fs) Fs =Nu/A Horton (1945) 3.25
10 Elongation Ratio (Re) Re =D/L Schumm (1956) 0.21
11 Circularity Ratio (Rc) Rc=4pA/P2 Strahler (1964) 0.06
12 Form Factor Ratio (Ff) Ff =A/L2 Horton (1945) 0.024
13 Absolute Relief (Ra) m GIS Software Analysis 602.00
14 Relative Relief Ratio (Rhp) Rhp = H * 100 / P Melton (1957) 118.83
Available Online at www.ijpret.com 142 4.1. Stream number (Nu) and stream orders
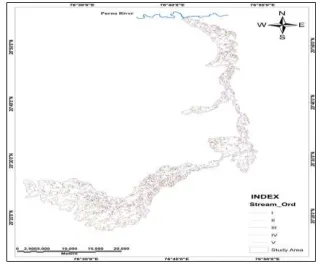
The Man River Basin encompasses a dendritic drainage pattern which indicates homogenous subsurface strata of the study area. In the present study the stream ordering has been ranked based on a method proposed (Strahler, 1964) from the digitized streams from top sheets and satellite images. The order wise stream numbers and their linear characteristics are shown in Table 3. The drainage pattern analysis of the ManRiver Basin indicated that the area is having a lake of structural tectonic control. Maximum number of stream was found in the first order and as the stream order increases with a decrease in stream number. The drainage map with stream order of the Man River Basin is shown in Fig. 2. The stream order of the basin varies from 1st to 5th orders stream. Stream ordering of the ManRiver Basin was computed using Arc GIS 10.1 software 10.1 by applying the law proposed by Horton, 1945. It is found that the total length of streams segment is maximum in first order streams and decreases as the stream order increases. This change in stream orders may indicate flowing of streams from high altitude and lithological variations. The Total length of streams in the ManRiver Basin is about 1134.36 km. The mean stream length (Lsm) and their ratio have been also calculated in GIS Environment (Table no. 2). The understanding of streams in a drainage system constitutes the drainage pattern, which in turn replicates mainly structural/ lithological controls of the underlying rocks. The study area possesses dendritic drainage patterns, despite stream lengths and other hydrological properties. They are generally characterized by a treelike branching system, which indicates the homogenous and uniformity.
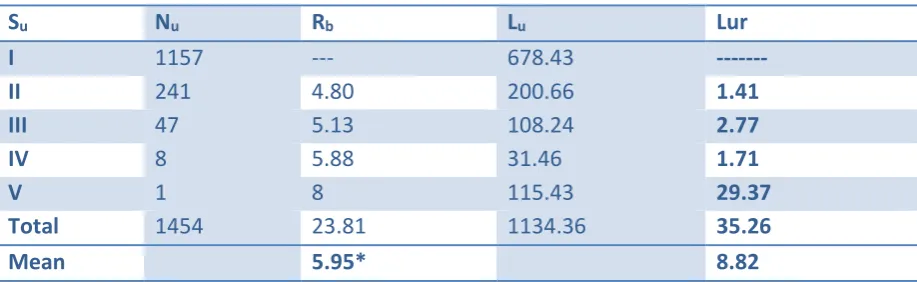
Table 2Linear aspect of the Man River Basin
Su Nu Rb Lu Lur
I 1157 --- 678.43 ---
II 241 4.80 200.66 1.41
III 47 5.13 108.24 2.77
IV 8 5.88 31.46 1.71
V 1 8 115.43 29.37
Total 1454 23.81 1134.36 35.26
Mean 5.95* 8.82
Su: Stream order, Nu: Number of streams, Rb: Bifurcation ratios,Lu: Stream length, Lur: Stream length ratio.
4.2. Stream length (Lu), mean stream length (Lsm) and stream length ratio (RL):
Available Online at www.ijpret.com 143 Stream length and their ratio is very important parameter to scan the hydrological characteristics of the river basin because they permeability of the rock formations in a basin. It also indicates if there is a major change in the hydrological characteristics of the underlying rock surfaces with the basin (Singh et al., 2013). The relationship between the bifurcation ratio and the stream length ratio is determined by hydrogeologic, physiographic and geological characteristics. The values of total length, mean length and length ratio of different stream orders of the Man river basin are shown in Table 2.
Fig. 2 Drainage map with stream order of the Man River Basin
4.3. Bifurcation ratio (Rb):
The term bifurcation ratio (Rb) may be defined as ratio of the number of stream segments of a given order to the number of segments of the next higher. Bifurcation ratio values of Man river basin ranging between 4.80 and 8 are considered to be characteristics of the basin, which have experience minimum structural disturbances (Strahler, 1964). The, mean bifurcation ratio of the basin is observed as 5.95. This indicates that the drainage pattern of the basin has not been affected by structural disturbances and the observed Rb is not the same from one order to its next order. These irregularities depend upon the geological and lithological development of the watershed (Table 1).
4.4. Drainage density (Dd) and drainage texture (T):
Available Online at www.ijpret.com 144 per unit area and controlled by the Slope gradient and relative relief of the basin. The drainage density of the study area has been calculated and the value is 2.53 (Table 1). It is observed that, if the drainage texture is 13.34 it indicates the presence of highly resistant permeable material with low relief. The variation in the value of drainage texture (T) depends upon a number of natural factors such as climate, rainfall, vegetation, rock, soil type and their infiltration capacity and relief of the basin. The relation between geology and hydrological analysis of watershed in semi-arid regions has low drainage density and generally results in the areas of highly resistant or permeable subsoil material, dense vegetation and low relief. High drainage density is the resultant of weak or impermeable sub surface material, thin vegetation and mountainous relief. The low drainage density of the watershed reveals that they are composed of permeable subsurface material, good vegetation cover, and low relief which results in more infiltration capacity in the watershed.
4.5. Stream frequency (Fs):
Stream frequency (Fs) or channel frequency is the total number of stream segments of all orders per unit area Horton (1932). Fs values indicate a positive correlation with the drainage density of the basin suggesting that an increase in stream population occurs with respect to increase in drainage density. An observed stream frequency (Fs) of 3.25 for the basin exhibits a positive correlation with the drainage density value of the area indicating an increase in stream population with respect to increase in drainage density (Table 1).
4.6. Elongation ratio (Re):
Elongation ratio (Re) is the ratio between the diameter of the circle of the same area as the drainage basin and the maximum length of the basin (Schumm, 1956). The values of Re generally vary from 0.6 to 1.0 over a wide variety of climatic and geologic conditions. Values close to 1.0 are typical of regions of very low relief, whereas values in the range 0.6–0.8 are usually associated with high relief and steep ground slope (Strahler, 1964). These values can be grouped into three categories namely (a) circular (>0.9), (b) oval (0.9–0.8), (c) elongated (<0.7). The elongation ratio of the basin is 0.21, which suggests that the basin belongs to the elongated shape basin and low relief (Table 1).
4.7. Circularity ratio (Rc)
Available Online at www.ijpret.com 145 the basin is elongated in shape, has low discharge of runoff and highly permeable subsoil conditions (Table 1).
4.8. Form factor (Ff):
According to Horton (1932), form factor (Ff) may be defined as the ratio of the basin area to square of the basin length. The form factor indicates the flow intensity of a basin for a defined area. The form factor value should always be less than 0.7854. The smaller the value of the form factor, the more elongated will be the basin. Basins with high-form factors experience larger peak flows of shorter duration, whereas elongated basin with low-form factors experience lower peak flows of longer duration. The observed form factor value of the basin is 0.024 suggesting that the shape of the basin is elongated (Table 1).The elongated basin with low form factor indicates that the basin will have a flatter peak of flow for longer duration.
4.9. Relief (R) and Relief ratio of the Basin:
The elevation difference between the highest and lowest points on the valley floor of a basin is known as the total relief of that basin. The relief ratio (Rh) of maximum relief to horizontal distance along the longest dimension of the basin parallel to the principal drainage line is termed as relief ratio (Schumm, 1956). It measures the overall steepness of a drainage basin and is an indicator of the intensity of the erosion processes operation on the slope of the basin. In the present study the Rh value of the basin is 3.25 which show that the portion of the basin is having gentle slope (Table 1).
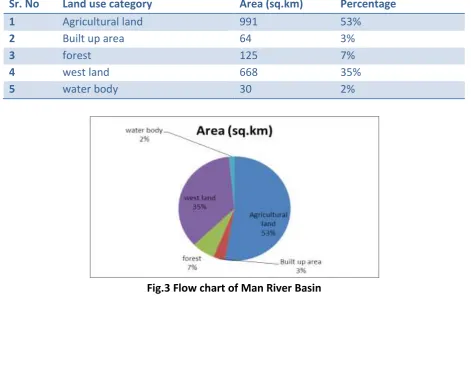
4.12. LAND USE/LAND COVER MAPPING:
Available Online at www.ijpret.com 146 extraction of signatures from theimage and then classification was performed. Finally, Maximum Likelihood Classification (MLC) the classification methods were applied. Fieldsurvey was also performed to finalize the land use/land cover map of the watershed by using GPS receiver for verification of doubtful classes. Common land use categories were identified with reference to their water requirement i.e.agricultural land, Built up area, forest, west land and water body(Fig. 3 and Fig.4). Assessment of land use pattern of the watershed reveals that most part of the area comes under agricultural and fallow land which indirectly supports the future for watershed development and management (Table 3).
Table 3 Land use/land cover of the watershed
Sr. No Land use category Area (sq.km) Percentage
1 Agricultural land 991 53%
2 Built up area 64 3%
3 forest 125 7%
4 west land 668 35%
5 water body 30 2%
Available Online at www.ijpret.com 148 CONCLUSION
The morphometric analysis was carried out in the lower Man river basin shows that the basin having low relief of the terrain and elongated shape. Drainage network of the basin exhibits as mainly sub-dendritic and dendritic type which indicates the homogeneity in texture and lack of structural control. Lower drainage density and stream frequency indicate high permeability rate of the subsurface formation. Observations derived from the morphometric analysis of Man River Basin gives up-to-date information about various factors such as morphological characteristic of the basin and important hydrological parameters such as bifurcation ratio, elongation ratio, drainage density, relief ratio, and circulatory ratio which are responsible for the river basin evaluation, The parameters reveal recharge-related measures and areas where surface-water augmentation measures can be undertaken for water resource management and soil conservation structures.
The land use/ land cover change detection is the supportive techniques for any further planning. Remote sensing data has wide range of application in land use/ land cover mapping and change detection also. In this present study identification of land use/land cover mapping from remote sensing data can be help for the further land planning, Dam construction, built-up and decision support system. The results observed in the present work can be used for site suitability analysis of soil and water conservation structures in the area and subsequently, these parameters were integrated with other hydrological information viz., land use/cover, land forms, geology, water level and soil in the GIS domain to arrive at a decision regarding a suitable site for soil and water conservation structures (nala bund, check dam, and percolation tank, recharge shaft, etc.) in the area for groundwater development and management. The study recommended that the Man river basin needs a hydrogeological and geophysical investigation in future for proper water and soil resourcesmanagement and selection of artificial groundwater recharge structures and NalaDeeping within the study area. Hence from the study it is highly comprehensible that GIS technique is a competent tool in geo-morphometric analysis for geo-hydrological studies of drainage basins. These studies have been very useful for planning and management of drainage basin.
REFERENCES
1. Das, A.K., Mukherjee, S. (2005). Drainage morphometry using satellite data and GIS in Raigad district, Maharashtra. J. Geol. Soc. India 65, 577–586
Available Online at www.ijpret.com 149 3. Horton, R.E.(1932). Drainage basin characteristics. Trans. Amer. Geophys. Union 13, 350– 361
4. Horton, R.E.(1945). Erosional development of streams and their drainage basins: hydrophysical approach to quantitative morphology. Bull. Geo. Soc. Am. 56, 275–370
5. Khadri, S. F. R and Chaitanya B. Pande (2014) Morphometric Analysis Of Mahesh River Basin Exposed in Akola And Buldhana Districts, Maharashtra, India Using Remote Sensing & GIS Techniques
6. Khadri, S.F.R and Kanak Moharir (2013) Detailed morphometric analysis of Man River Basin in Akola and Buldhana Districts of Maharashtra, India using Cartosat-1 (DEM) Data and GIS techniques
7. MarynaRymasheuskaya, (2007), Land Cover Change Detection in Northern Belarus.Proceedin of Scan GIS -2007, pp 255-260
8. Miller, V.C. (1953). A Quantitative Geomorphologic Study of Drainage Basin Characteristics in the Clinch Mountain Area, Virginia and Tennessee, Project NR 389042, Tech Rept 3. Columbia University Department of Geology, ONR Geography Branch, New York
9. Natural Resources Census, National Land Use Land Cover Mapping using Multi Temporal AWiFS Data, Department of Space, Hyderabad, June2006NRSA/LULC/1:250K/2006-2.
10. Rawat, J.S., Biswas, V., Kumar, Manish. (2013). Changes in land use/ cover using geospatial techniques: A case study of Ramnagar town area, district Nainital, Uttarakhand, India. Egypt. J. Remote Sens. Space Sci. 16, 111–117
11. Schumm, S.A. (1956). Evolution of drainage systems and slopes in badlands at Perth Amboy, New Jersey. Geol. Soc. Am. Bull. 67, 597–646
12. Sharma SK, Vairavamoorthy K (2009) urban water demand management: prospects and challenges for the developing countries. Water Environ J 23:210–218
13. Singh, Prafull, Thakur, J., Singh, U.C.( 2013). Morphometric analysis of Morar River Basin, Madhya Pradesh, India, using remote sensing and GIS techniques. Environ. Earth Sci. 68, 1967– 1977
14. Strahler, A.N. (1964). Quantative geomorphology of drainage basins and channel networks. In: Te Chow, Ven. (Ed.), Hand Book of Applied Hydrology. McGraw Hill Book Company, New York
15. Sylla, L., Xiong, D., Zhang, H.Y., Bangoura, S.T.(2012). A GIS technology and method to assess environmental problems from land use/cover changes: Conakry, Coyah and Dubreka region case study. Egypt. J. Remote Sens. Space Sci. 15, 31–38