PCA-SVM Algorithm for Classification of Skeletal
Data-Based Eigen Postures
Nguyen Thanh Hai1,*, Trinh Hoai An2
1
Faculty of Electrical and Electronics Engineering, HCMC University of Technology and Education, Vietnam 2
Faculty of Electronics – Telecommunications, Saigon University, Vietnam
Abstract
Falls are the major reason of serious injury and dangerous accident for elderly people. A recognition system is necessary to recognize falls early for help and treatment. In recent years, researchers have been developing many new methods of effective detection and recognition of human falls. In this paper, three subjects were introduced a system of fall recognition with five pairs of human postures (non-fall-fall, fall-stand, fall-sit, fall-bend, fall-lying) using a Kinect camera system. Features of skeletal data with the human postures obtained from the camera system are extracted using a PCA algorithm. For fall recognition and sending notification message, a SVM algorithm is applied for training the feature data and classifying these postures. Experimental results show that the high effectiveness of the proposed approach for fall recognition and alert is nearly 82%.Keywords
Skeletal data acquisition, PCA method, Fall recognition and alert, SVM algorithm1. Introduction
Fall injuries are dangerous and often happen for older people. These injuries can be burdens to individuals, their families and healthcare systems [1]. According to the Canada’s Public Health Agency in 2014 [2], the rate of old people was hospitalized by fall increasingly, particularly there was 0.4% - 0.6% people at the age 65-69, who went to the hospital every year. It was rising 4.9% - 6.8% people at the age over 90. Fall and related fall injuries are some of causes leading to the death rate of people in the world. Therefore, the earlier fall recognition of elderly people is necessary and will increase their living opportunity. With the development of high technology, the automatic system with alarm is a necessary solution for fall recognition.
Many researches have used modern devices to monitor the human activities in recent years. These devices can recognize fall and then generate the alarm signals to relatives and medical staff for emergency support [2]. Based on features of fall, a method for detection and notification of fall has been constructed. The most importance of a system is accurate distinction between normal and fall activities in the series of daily activities of the elderly people in the indoor environment. The detection system consists of three main basic methods: a camera system [3, 4], environmental sensors [5] and wearable
* Corresponding author:
[email protected] (Nguyen Thanh Hai) Published online at http://journal.sapub.org/ajbe
Copyright © 2016 Scientific & Academic Publishing. All Rights Reserved
sensors [6, 7].
In a system, environmental sensors are often used to collect surrounding activities in the established environment and produce corresponding signals. In practice, there are types of sensors as infrared, vibration, laser, pressure and others are used in exploring changes of the environment. The passive system was designed using vibration sensors in seeking and recognizing changes of vibration in the floor [8, 9]. With this design, the system recognized the floor vibration and can distinguish between fall and other postures. Therefore, the systems with this type sensor were developed to find out the fall status of victims being fainted or strained based on spectrum.
Wearable sensors such as acceleration, gyroscope were usually used to install with human body for determination of tilt angles related to recognition of human postures. In order to perform recognition systems with these wearable sensors, two methods such as threshold method and machine learning algorithm were applied [10]. In particular, acceleration sensors were used in the system to measure problems related to chest of human. Therefore, signals obtained from the sensors were transmitted to computer for processing and then recognizing human motion states (fall or normal state) based on threshold method [11]. Experimental results of this research is that the accuracy with normal and fall cases is high, particularly the standing state is approximate of 100%, the going state is about 100% and two cases with under 95% accuracy are falling back without lying and falling left. The advantages of this system are small and easy to move.
set up at some fixed positions in house or room to supervise activities of elderly people. Image processing is applied to calculate image data and then identify human postures. A Moving Average (MA) method in the system with the cameras was employed to detect fall states [12]. In particular, this approach allows detecting fall states base on depth map and normal color information [13]. Moreover, History Moving Image (HMI) was utilized to classify collected data to find moving state. The HMI features were extracted for searching output movements based on RGB depth maps. For recognition of fall, a Support Vector Machine (SVM) algorithm was applied to identify fall states using a camera system with RGB-Depth [14].
In recent years, machine learning method has been employed for recognition of many problem related to image data. In particular, for recognition of human gestures (standing, siting and lying), three methods such as the SVM, decision tree, Navie Bayes were utilized [15]. The results showed that the SVM method had the accuracy of 100%, the decision tree gave the 90% accuracy and the Navie Bayes was about 85%. Thus, the SVM algorithm is the most accuracy compared to the two remaining methods.
The Kinect camera system has been developed to use in many applications in recent years. In an application of fall detection, the system was installed with a Kinect camera and an accelerometer sensor to increase the accuracy of recognition. Therefore, methods of recognition such as the SVM, the Upper Fall Threshold (UFT), the Lower Fall Threshold (LFT) algorithm were applied. The final result showed that the recognition using the SVM with depth data combined to accelerate features has the higher accuracy than that using others [16].
The purpose of this research is to establish a system of fall recognition with a Kinect camera and warning for elderly people. Data obtained are fall and normal postures. For classification of postures, a Principle Component Analysis (PCA) algorithm will be applied to extract features of data. Thus, a Support Vector Machine (SVM) algorithm will be employed for classification of fall and non-fall. In addition, a warning system in the recognition will be designed to send a mobile message for warning to relatives. Experimental results will be shown so that the effectiveness of the proposed approach.
2. Data Acquisition and Materials
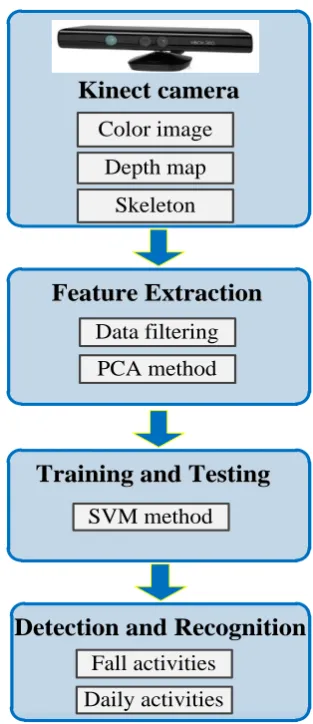
In this research, a fall recognition system for elderly people has three main parts: data acquisition from the Kinect camera, a computer for processing data and fall recognition and an alarm module as shown in Figure 1. This Kinect camera system, which has a camera and a laser sensor, can produce skeletal data with bone joints. It means that the skeletal data obtained have three axes, in which there is depth information. In particular, the depth axis can allow determining distance from the camera center to an object. In addition, this camera system produces the type of these
skeletal data with three axes which can be easier for detection of human motions as well as fall recognition.
Figure 1. System of fall recognition and alert
Detection and Recognition
Fall activitiesDaily activities
Kinect camera
Kinect camera
Color image
Depth map
Skeleton
Feature Extraction
Feature Extraction
Data filtering
PCA method
SVM method
Training and Testing
Training and Testing
Figure 2. Block diagram of the recognition system
In addition, the fall alert system is designed to recognize human postures and classify between fall and normal state as shown in Figure 2. In particular, skeletal data obtained from
Alert module
Computer Camera
the camera system will be extracted features using a Principal Component Analysis (PCA) algorithm for training. Therefore, the trained data will be sampled to recognize human posture. For recognition of fall and non-fall, a SVM method will be applied to classify five pairs of fall and other activities such as (fall_non-fall, fall_stand, fall_sit, fal_-bend, fall_lie).
An alert system is an important part in the fall monitoring system for elderly people as shown in Figure 3. In particular, this system will recognize fall and then send an alert message to a mobile phone of their relatives. In this research, the alert system will be combined to the recognition system to create a smart recognition in the fall system. It means that when the recognition system has recognized falling, immediately the alert system will be activated to send one message to their relatives for emergency solutions.
Module USB to COM
Arduino Mega 2560 R3
SIM 900/Buzzer
Figure 3. Block diagram of an alarm system
3. Kinect Data
3.1. Skeleton of Kinect System
This Kinect camera can produce a skeletal data over an image frame with 20 important joints in the model of human body as shown in Figure 4. These joints are bone parts, in which the basic fixation bones are points of “hip center” joint (node 1), “spine” joint (node 2), “shoulder center” joint (node 3) and “head” joint (node 4); the positions of the flexible bones are “wrist left” joint (node 7), “hand left” joint (node 8), “wrist right” joint (node 11), “hand right” joint (node 12), “ankle left” joint (node 15), “foot left” joint (node 16), “ankle right” joint (node 19) and “foot right” joint (node 20); the joints of the moving bones are the positions of “shoulder left” joint (node 5), “elbow left” joint (node 6), “shoulder right” joint (node 9), “elbow right” joint (node 10), “hip left” joint (node 13), “knee left” joint (node 14), “hip right” joint (node 17) and “knee right” joint (node 18).
1 2 3 4
5 6
7 8
9 10 12
11
13
14
15
16 20
19
18 17
Knee left Shoulder right
Spine Hip center
Shoulder left
Elbow left Wrist left Hand left Head
Shoulder center Hand right
Wrist right
Elbow right
Hip left
Ankle left
Foot left Foot right
Ankle right Knee right
Hip right
Figure 4. Diagram of twenty body- joint positions
In addition, each position of the skeletal image has the typical name, particularly the name of the 4th position is “Head joint”. Therefore, all human postures will be affected by three types of these functional bones and human postures will be recognized based on these joint data.
3.2. Data Acquisition
In this paper, a Kinect camera system was installed at a fixed position in a room and three subjects, including two males, one female were introduced to perform experiments with different postures. The subjects invited have the age of 19-26 years old and the weights are between 51-75 kg. Moreover, the subjects were instructed to work out eight postures, including “fall front”, “fall back”, “fall right”, “fall left”, “stand”, “sit” on the chair, “bend”, lie down” on the floor.
K
in
e
c
t
57o
Horizontal
43o
Vertical
2-3 meters
1
-1
,2
m
e
te
r
s
Figure 5. Schematic of the Kinect camera for collection of 3D image
data of human bone joints obtained from the camera denotes with three coordinates (x, y, z), called (Horizontal, Vertical, Depth) for a joint position.
In this study, each joint position I is described as the transpose matrix with three values in a coordinate (x, y, z) and expressed as follows:
Tz y x1 1 1 1
I
Tz y
x2 2 2
2
I (1)
Tn n
n x2 y z
I
where n describes the number of the joint points, n = 1, 2, …, 20.
In building 3D data, each image frame is determined to be 20 bone joints and each joint is in the 3D coordinate (x,y,z). Therefore, this frame can be described as a column vector Im of 60 variables as shown in Fig. 6. This vector is
arranged from matrices in Eq. (1) and each frame is expressed as follows:
Tn
I I
I
P1 1 2 (2) Assume that one video clip has k frames, k=1,2, …, with human activities is defined as the following matrix, P:
P P Pk
P 1 2 (3)
This matrix P can is also expressed another way as follows: k n n n k k p p p p p p p p p , 2 , 1 , , 2 2 , 2 1 , 2 , 1 2 , 1 1 , 1
P (4)
The matrix, P is the set of database described as Figure. 6, in which each vector Pk, is described to be a column matrix
with bone joint values of human postures in coordinates, (x,y,z).
When a fall activity occurs, the human posture will change dramatically. It means that data obtained from the camera system will be the data including from normal state into fall on floor. In particular, the change of 3D data is determined based on bone joints in a very short time and the location of the first joints abruptly changes along the y
vertical axis of the coordinate system as shown in Fig. 7.
. .
.
. .
.
p3 p2 p1. .
.
pk. .
.
. .
.
. .
.
. .
.
. .
.
. .
.
x1 y1 z1 x2 y2 z2 l = 1l = 2
x20 y20 z20 x19 y19 z19
l = 19
l = 20
Figure 6. Description of data, p, arranged to be a column vector
Ground
Sens
or D
irec
tion x
y
z
Figure 7. Illustrating activities of human falls
Time (second) A m pl itu de
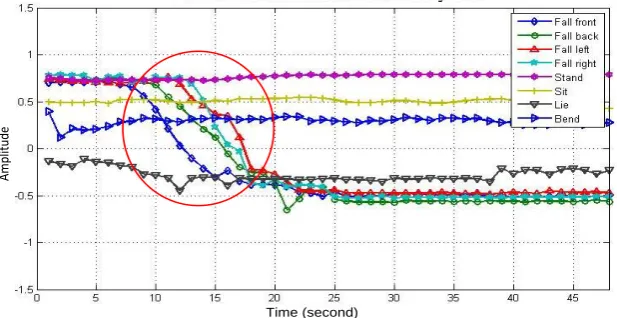
The difference of “Head” joints at the y-axis of between two activities of fall and non-fall is introduced in Figure 7. It means that data of “Head” joint before falling is different from that of after falling. While, in normal activities such as stand, sit on chairs, bend, lie down on the floor, values in the coordinates of the “Head” joints have no change nearly. However, during fall activities, values in the y coordinates of the first joint change dramatically in a short time and then these values have no change nearly in a certain period of time as shown in Figure 8. For example, considering the data in the range of from the 11th frame to the 20th one, four lines of data represented in different colors of dark blue, green, blue and red corresponding to postures of “fall front”, “fall back”, “fall left”, “fall right” are suddenly reduced, while values in the y-axis with colors of purple, yellow, black, blue corresponding to the states of “stand”, “sit” on chairs, “bend”, “lie” down on the floor have no change. Therefore, the data, which are circled with red color, are the basic so that one can perform data analysis for estimation and fall recognition of human postures.
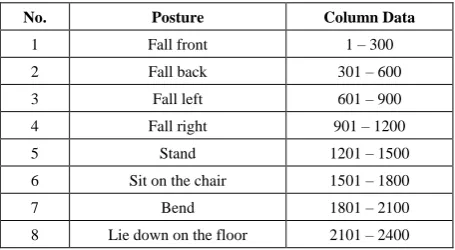
For calculation of recognition, the obtained data of eight postures from the camera system are processed to convert into a matrix size of 60x2400 which is called column data as shown in Table 1. In addition, the data are separated to distinguish each posture corresponding to a data cluster, so it has eight data clusters.
Table 1. Column data cluster corresponding to human postures
No. Posture Column Data
1 Fall front 1 – 300 2 Fall back 301 – 600 3 Fall left 601 – 900 4 Fall right 901 – 1200 5 Stand 1201 – 1500 6 Sit on the chair 1501 – 1800 7 Bend 1801 – 2100 8 Lie down on the floor 2101 – 2400
In this research, the process of collecting data plays an important role for training and recognition of postures. The data collected by the Kinect camera system will be extracted using a PCA algorithm and then classified based on a SVM method. Experimental results of 120 samples performed on three people corresponding to 2400 image frames for recognition of human falling.
4. Methodology
4.1. Feature Extraction using PCA Algorithm
A Principal Component Analysis (PCA) algorithm is applied to extract feature components of fall data. In particular, skeletal data of fall and non-fall postures are pre-processed to produce the data matrices. Thus, the average value p1, with i=1,2,…,k is determined from the row components of the matrix P in Eq. (4) and this equation
is expressed as follows:
1 1, 1 1 k i i p p k
(5)For similarity, one can determine the remaining average components, p2,p3,,pn.
Next step of this PCA algorithm is that the Standard Deviation (SD) will allow to calculate vectors as follows:
n n p p p p p p 1 , 2 1 , 2 1 1 , 1 1
n (6)
For similarity, the remaining vectors will be determined,
n
n n
n2,3,, .
From the set of the vectors, n1,n2,,nn, a matrix A is built as follows:
n n nn
A 1 2 (6)
After determining the matrix A, a covariance matrix of the normalized data needs to be found for description of correlation of each vector to the vector space. Therefore, this covariance is expressed as the following equation:
A A C T n 1 1
(7)
In this PCA algorithm, determining eigenvectors based on eigenvalues of data sets is important. Thus, in order to calculate eigenvalues, one needs to calculate determinant of a matrix using the following equation:
0 )
det(CλP (8)
where C is a covariance matrix; λ is the eigenvalues and P
is the matrix of Eq. (4).
After determining the eigenvalues, the eigenvector V can be calculated using the following equation:
0 )
(CλPV (9)
In this paper, the PCA method is employed for extraction of fall data. The main purpose of this method is that the principal features of eight postures are chosen and the weak components in the set of data are removed. Therefore, that the principal features of eight postures will be trained using the SVM algorithm for fall classification. In this research, with eight postures of three persons, the set of data for training is very large after the PCA, particularly a coefficient matrix of 2400 x 2400 is created corresponding to feature vectors k.
4.2. Support Vector Machine Algorithm
In this paper, a SVM method is utilized in the system of fall recognition to classify between two postures of fall and normal activities of elderly people. From this classification, one can recognize fall state.
PCA, the SVM algorithm is applied to train the PCA feature data and classify states of fall and non-fall. In the SVM algorithm, the linear hyperplane is an area to divide the data set into two subsets collection according to the linear hyperplane. Assume that pattern elements (datasets after the PCA) are expressed as follows:
x y1, 1
, x2,y2
, x y3, 3
, ,
xm,ym
(10)wherexiRn while yi
1,1
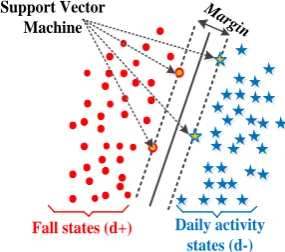
is subclass of xi .Therefore, to identify the hyperplane, one needs to find a plane making Euclidean distance between two layers as shown in Figure 9. In particular, a vector with the distance values close to the plane is called the support vector, in which, the positive value is y = +1 or H1 and the negative one is in the region of y = -1 or H2.
The SVM algorithm is to find an optimal hyperplane for classification of two classes and expressed as follows:
( ) T ( )
f x w
x b (11)Assume that the equation of hyperplane is w x. b 0, where w is the vector with perpendicular points to the separating hyperplane and with
w R b
n,
/
w
is distance from this hyper plane to the origin, and ||w|| is the magnitude of w.M argin
Support Vector Machine
Fall states (d+) Daily activity
states (d-)
Figure 9. Description of the SVM algorithm with hyperplane
Moreover, d+ (d-) is the shortest distance from the
hyper-boundary to positive (negative) samples. Therefore, margin of plane is d+ + (d-) in the linear case and the support
vector looks for the separating hyper plane with the largest margin using the primal Lagrangian. Suppose that all training data satisfy the following constraints:
. i 1
w x b , in which yi = +1 (12)
. i 1
w x b , in which yi = -1 (13)
From two equations (10) and (11), one has:
( . ) 1 0
i i
y w x b (14)
According to the positive Lagrange multiplier, with i = 1, 2, ..., m, the Lagrangian function is represented as follows:
2 1 1 1 ( , , ) || || ( . ) 2 m m
p i i i i
i i
L w b w y x w b
(15)where i 0 is the Lagrange multiplier. Taking the derivation w of Lp, the equation is calculated as follows:
1
( , , )
0 m
p
i i i i
L w b
w x y
w
(16)or it can be re-written as follows:
1 ( , , ) 0 m p i i i
L w b
y b
(17)The final equation is expressed as follows:
1
m i i i i
w y x
(18a)1 0 m i i i y
(18b)In classification, each training sample corresponds to xi
and Lagrange
i coefficients. After training, i 0 is the support vectors and located on one of the two hyperplanes, H1 and H2. If the result of data classified has the value x*, its subclass is of x* (-1 or +1) and is described through the following formula:
1
m i i i i
y f x sign wx b sign u y x x b
(19)
In this study, 2400 samples of eight postures on three people were chosen for training, in which it includes 1200 falls (fall front, fall back, fall left, fall right) and 1200 non-falls (stand, sit on chairs, bend, lie down on the floor).
All paragraphs must be indented. All paragraphs must be justified alignment. With justified alignment, both sides of the paragraph are straight.
5. Results and Discussion
In the experiments, offline databases were used for feature extraction using the PCA algorithm and then these features were trained for classification using the SVM. Experimental results were shown to illustrate the effectiveness of the proposed method in the fall recognition system.
5.1. Representation of Fall and Non-Fall Postures
Every subject invited to perform eight postures “Stand”, “Sit”, “Bend”, “Lying”, “Fall forward”, “Fall backward”, “Fall left”, “Fall right” and each posture is ten times. Thus, the total samples obtained from three people are 240, in which each collected image has from 50 to 60 frames. In addition, the collected data have 60 columns of 20 bone joints represented in three coordinates (x, y, z). In practice, postures of daily activities of three people (two males and one female) were recorded as shown in Figure 10 and Figure 11.
In these cases, the 4th joint, called the head joint (in Fig. 4), has the largest change compared between falls and non-falls for classification. Hence, data at head joints in each case are important in analyzing to be able to produce difference compared to joints at the remaining joints.
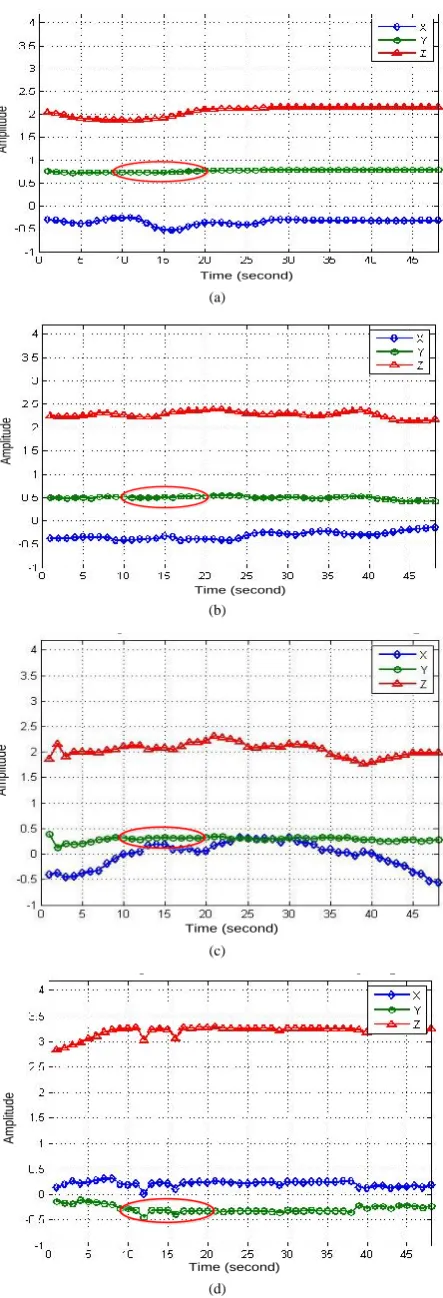
Figure 12 describes fall state of a subject, in which three lines (red, blue and green) represent coordinates (x, y, z). It shows the distribution of joints information when people fall. In particular, the vertical axis is the value of the distance and the horizontal axis represents the number of image frame reviewed. The signal lines of red, blue, green illustrate the coordinate value, change of the position of the head joints corresponding to the three axes x, y, z in a certain period time.
In Figure 12 with four cases of falls, the first 10 frames of 60 frames show a state of rest. However, from the 11th to 20th frames, green and blue data lines dramatically decrease in a very short time at axes-y and -x. Therefore, it is an important change for fall recognition. While these green and blue lines in Figure 13 nearly have no change at the vertical axis-y
(green color) as circled with red during 60 data frames.
(a1) (a2) (a3)
(b1) (b2) (b3)
(c1) (c2) (c3)
(d1) (d2)
(d3)
(a1) (a2)
(a3)
(b1) (b2)
(b3)
(c1) (c2)
(c3)
(d1) (d2) (d3)
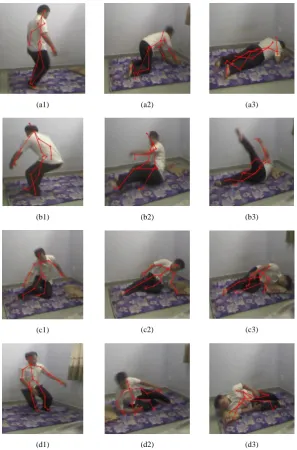
Figure 11. Images of fall postures: (a1), (a2), (a3)_“Fall front”; (b1), (b2), (b3)_“ Fall back”; (c1), (c2), (c3)_ “Fall left”; (d1), (d2), (d3)_ “Fall right”
During these experiments, one can be based on changes of data lines of fall and non-fall at the x and y axes at short time for fall recognition. In the set of fall and non-fall data, the fall data represents sudden change compared to change of the normal data at the same vertical axis-y. In practice, it is dependent on levels of fall and non-fall states in very short time for calculation of fall classification. Therefore, in order to have more accurate recognition, the SVM algorithm was applied to classify states of fall or non-fall for fall recognition and alert.
5.2. Fall Recognition Using the SVM
This research represents experimental results corresponding to human postures for recognition of fall and
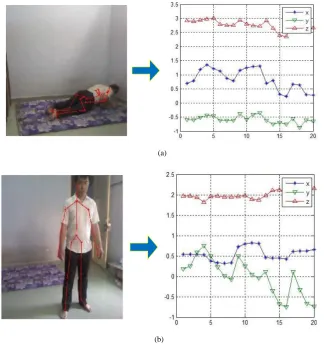
non-fall as shown in Figure 14. In particular, this figure shows two postures, one for fall on floor and another one for standing state corresponding to three skeletal data lines (red, green and blue).
Time (second)
A
m
pl
itu
de
(a)
Time (second)
A
m
pl
itu
de
(b)
Time (second)
A
m
pl
itu
de
(c)
Time (second)
A
m
pl
itu
de
(d)
Figure 12. Representation of four fall states related to head joints: (a) Fall forward. (b) Fall backward. (c) Fall to left. (d) Fall to right
Time (second)
A
m
pl
itu
de
(a)
Time (second)
A
m
pl
itu
de
(b)
Time (second)
A
m
pl
itu
de
(c)
Time (second)
A
m
pl
itu
de
(d)
(a)
(b)
Figure 14. Representation posture images corresponding to data lines: (a) Fall posture and simulation result; (b) Non-fall posture and simulation result
Table 2. Recognition results of fall and non-fall activities
Activity Type Sample
Recognized
results Accuracy (%) Fall Non-fall
Fall Training 1200 976 224 81.8 Test 600 491 109 81.3 Non-fall Training 1200 996 204 83.5 Test 600 501 99 83
Table 3. Recognition results of fall and other activities
No. Recognized
case Activity Samples
Accuracy (%)
1 Fall - Stand Fall 600 81.9 Stand 300 83.6 2 Fall - Sit on a
chair
Fall 600 81.1 Sit on a chair 300 82.9 3 Fall - Bend Fall 600 81.4 Bend 300 82.3 4
Fall - Lie down on the
floor
Fall 600 80.9 Lie down on
the floor 300 79.6
In this system, the SVM algorithm was employed to classify between a fall state and a normal activity. In addition, in order to perform this classification, 600 fall samples and 300 samples of other postures were used and the accuracy was calculated as shown in Table 3. In this research, there were three subjects who were invited to work out fall and normal activities with many times for taking samples. In particular, these activities are that stand, sit on a chair, bend, lie down on the floor is trained. Cases of identity include: fall - stand, fall - sit in a chair, fall - bend, fall – lie down on the floor. Therefore, the SVM was applied to classify each pair of fall and a normal activity.
5.3. Alert System for Falling
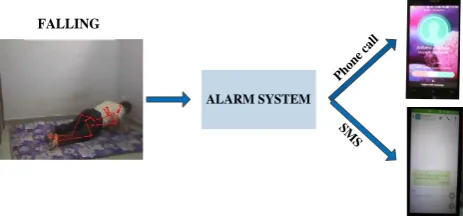
In order to enhance help from people close to house, a buzzer module connected to a computer was designed to create sound to inform relatives. In particular, when an elderly person is fallen, the fall system recognizes fall posture and then send a message to mobile phone of relatives.
Phon e ca
ll
SM S
FALLING
ALARM SYSTEM
Figure 15. Description of the fall system withnotification message and calls
The Kinect camera system has been used popularly in many different fields such as computer games, smart wheelchairs, detection of arm movements and others. In an application of the Kinect camera for determination of different speeds (fast, medium and slow) of arm movements of 27 people with the average age of 29. The result showed that the overall error of the interclass classification was 5.43% [17]. The Kinect camera system was used to recognize human pose postures in parts from depth single images and then predicted 3D positions of body joints with high accuracy [18].
In this paper, the fall recognition system using the Kinect camera system to obtain fall and non-fall postures on three subjects. Skeletal data of eight postures are divided into sample data for extraction of features. In addition, the SVM algorithm was utilized to train the feature data and then to classify fall and non-fall states for fall recognition and alert with the average accuracy of 81.8%. In particular, an alert system in the fall recognition will send a message as an emergency contact to user mobile phones for help. It is obvious that this is one important real application in recognizing early fall for elderly people for help and treatment. Moreover it remains the trusted problem in future research as well development of the better fall recognition.
6. Conclusions
In this research, the skeletal data of three subjects with eight postures obtained from a Kinect system to be converted into images. These image data were extracted features using a PCA method. For fall posture classification, a SVM algorithm was employed for training the image data set and then for classifying fall and non-fall postures. Experimental results showed that, the average accuracy between fall and non-fall is 81.8% and 83.5%, respectively. In addition, the fall recognition could send message to relatives through mobile phones. With these effective results of classification
using the PCA-SVM algorithm, it will be suitable to remain for future relevant studies.
ACKNOWLEDGEMENTS
The authors would like to acknowledge the support of HCMC University of Technology and Education, Vietnam, with Grand No. T2016 – 44TĐ. Moreover, we would send to thank students and colleagues for this research.
REFERENCES
[1] W.H.O. Ageing and L. C. Unit, “Global report on Falls Prevention in older Age,” World Health Org., Geneva, Switzerland, 2008.
[2] Public Health Agency of Canada, Seniors’ Falls in Canada Second report. The Queen in Right of Canada, pp. 12–15, 2014.
[3] C. Kawatsu, J. Li, and C. J. Chung, “Development of a Fall Detection System with Microsoft Kinect,” International Conference on Robot Intelligence Technology and Applications, vol. 208, pp. 623-630, 2012.
[4] E. E. Stone and M. Skubic, “Falls Detection in Homes of Older Adults Using the Microsoft Kinect,” IEEE Journal of Biomedical and Health Informatics, vol. 19, pp. 290-301, 2014.
[5] C. Wen-Chang and J. Ding-Mao, “Triaxial Accelerometer-Based Fall Detection Method Using a Self-Constructing Cascade-AdaBoost-SVM Classifier,” IEEE Journal of Biomedical and Health Informatics, vol. 17, pp. 411- 419, 2013.
[6] D. M. Karantonis, M. Mathie, N. H. Lovell, and B. G. Celler, “Implementation of a Real-Time Human Movement Classifier Using a Triaxial Accelerometer for Ambulatory Monitoring,” IEEE Transactions on Information Technology In Biomedicine, vol. 10, pp. 156 - 167, Jan. 2006.
[7] A. K. Bourke, J. V. O’Brien, and G. M. Lyons, “Evaluation of a threshold-based tri-axial accelerometer fall detection algorithm,” Gait & Posture, vol. 26, pp. 194 - 199, Jul. 2007. [8] M. Alwan, Rajendran, P. J. Kell, S. Mack, D. Dalal, S. Wolfe,
and M. Felder, “A smart and passive floor-vibration based fall detector for elderly,” International Conference on Information and Communication Technologies, vol. 1, pp. 1003-1007, 2006.
[9] Y. Zigel, D. Litvak, and Gannot, “A Method for Automatic Fall Detection of Elderly People Using Floor Vibrations and Sound - Proof of Concept on Human Mimicking Doll Falls,” IEEE Transactions on Biomedical Engineering, vol. 56, pp. 2858 – 2867, Aug. 2009.
[11] Z. Ye, Li, Y. Zhao, and Q. Liu, “A Falling Detection System with wireless sensor for the Elderly People Based on Ergnomics,” International Journal of Smart Home, vol. 8, pp. 187 – 196, 2014.
[12] A. Dubois and F. Charpillet, “Detecting and preventing falls with depth camera, tracking the body center,” The 12th European Association for the Advancement of Assistive Technology in Europe, pp. 77 – 82, Sep. 2013.
[13] R. Dubey, B. Ni, and P. Moulin, “A Depth Camera Based Fall Recognition System for the Elderly,” Springer-Verlag Berlin Heidelberg, pp. 137 – 142, 2012.
[14] A. Dubois, and F. Charpillet, “Human Activities Recognition with RGB-Depth Camera using HMM,” The 35th Annual International Conference of the IEEE Engineering in Medicine and Biology Society, pp. 4666 – 4669, 2013.
[15] O. Patsadu, C. Nukoolkit, and B. Watanapa, “Human gesture recognition using Kinect camera,” The 9th International Joint Conference on Computer Science and Software Engineering, pp. 28 – 32, 2012.
[16] B. Kwolek and M. Kepski, “Human fall detection on embedded platform using depth maps and wireless accelerometer,” Computer Methods and Program in Biomedicine, vol. 117, pp 489 – 501, Dec. 2014.
[17] M. Elgendi, F. Picon, N. Magnenat-Thalmann, and D. Abbott, “Arm movement speed assessment via a Kinect camera: A preliminary study in healthy subjects,” BioMedical Engineering OnLine, Jun. 2014.