Financial Statement Comparability and New Debt Issues
Aaron Crabtree1, Bo Ouyang2 & Huishan Wan3 1
School of Accountancy, University of Nebraska-Lincoln, Lincoln, NE 68588-0488 USA
2 School of Graduate Professional Studies, Pennsylvania State University at Great Valley, Malvern, PA, 19355 USA 3
Department of Accounting, University of Northern Iowa, Cedar Falls, IA 50613, USA
Correspondence: Huishan Wan, Department of Accounting, University of Northern Iowa, Cedar Falls, IA 50613, USA. E-mail: [email protected]
Received: March 15, 2019 Accepted: April 3, 2019 Online Published: April 4, 2019 doi:10.5430/afr.v8n2p143 URL: https://doi.org/10.5430/afr.v8n2p143
Abstract
Using a large sample of firms issuing new debts, this paper investigates how a firm’s financial statements comparability affects its cost of new debt issues. We predict and find that higher comparability is associated with (1) higher bond ratings and (2) lower bond yield spreads when companies issue new debts. Our results are consistent with the view that bond rating analysts and bond investor favor greater comparability when they evaluate new bonds and make investment decisions.
Keywords: comparability, new debt issues, bond ratings, bond yield
1. Introduction
In this study, we examine the impact of accounting comparability on the cost of new debt issues. The Financial Accounting Standards Board’s (FASB) Statement of Financial Accounting Concepts (SFAC) No. 8, Qualitative Characteristics of Useful Financial Information, defines comparability as ‘‘the qualitative characteristic that enables users to identify and understand similarities in, and differences among, financial statement items”. Accounting comparability is arguably one of the most important accounting qualities (Kothari et al., 2010), and we complement emergent studies on the impact of accounting quality by investigating its effect on one significant third-party cost, namely, the cost of new debt issues.
We predict the higher accounting comparability a firm’s financial reports have, the lower cost of debt the firm will incur when the firm goes to the capital market and issues new debts. Our hypothesis is based on theoretic research, as well as recent empirical evidence, which examines the relationship between information environment and cost of debt. Bharath, J. Sunder, and S. Sunder (2008) find that financial reporting quality can significantly reduce information asymmetry, improve the information environment for creditors to assess the creditworthiness of borrowers, and lower financing cost of a firm consequently. De Franco et al. (2011) empirically demonstrate that accounting comparability is positively related to information environment improvement and increases both the quantity and the quality of information available to outsiders of a firm to help them evaluate financial health and firm performance of the firm.
We contribute to the general literature on the impact of financial reporting quality on capital market participants (Easley and O’Hara 2004; Lambert, Leuz, and Verrecchia 2007). Prior literature suggests a positive influence of financial reporting quality on capital market participants, such as financial analysts and equity investors (De Franco et al., 2011; Kothari et al., 2010). We specifically complete studies of Fang, Li, Xin, and Zhang (2016), Kim, Kraft, and Ryan (2013), and Imhof, Seavey and Smith (2017) that suggest that comparability can reduce information asymmetry and information risk, and consequently cost of capital. Our evidence suggests that when firms issue new debts, accounting comparability is an important consideration in cost of debt.
Our research also has strong practical implications. Our empirical evidence indicates a substantial impact of financial reporting quality on cost of issuing new debts, which is a significant business cost. This economically significant cost saving may have nontrivial importance for any firms.
There is one caveat when interpreting the empirical results. In this paper, equity-market based comparability based on De Franco et al. (2011) is used. Kim et al. (2013) develop a debt-market based comparability measure based on Moody’s’ adjustments to firms’ accounting numbers compiled in Financial Metrics database. We use equity-market based comparability measures proposed by De Franco et al (2011) due to the limitation in access of the Financial Metrics database. However, this less refined measure is expected to work against our findings.
Our study proceeds as follows. Section 2 reviews the related literature and develops the hypothesis. Section 3 discusses the research design while section 4 presents the results. Section 5 concludes the paper.
2. Literature Review and Hypothesis Development
2.1 Bond Ratings
Bond ratings are important as they provide an independent appraisal to the market regarding the default risk associated with a firm’s debt. Ratings reflect the analysts’ perception of a firm’s probability of default on future payments. The calculation of this probability depends on a wide range of factors, including the profitability ratios of the firm (Standard &Poor’s Ratings Group, 2008). Information which provides insight into the quality and potential persistence of a firm’s earnings should be important to analysts in establishing an issue’s rating.
From an economic perspective, firms raise substantially more “new” funds in the credit market every year than in the equity market to finance new and continuing activities. For example, Thomson Reuters reports that US offerings of debt were $1.3 trillion in 2016 while equity market issuances were $655 billion. Typically, the process of issuing debt begins with the corporation obtaining a necessary credit rating for the issue from a major rating agency, such as Moody’s or Standard & Poor’s, and ends with an investment banker bringing the issue to market. The rating agency’s very existence depends upon being independent, along with the associated credibility the public attributes to the ratings it issues. This logical assumption of independence is corroborated by research indicating ratings are motivated more by reputation protection than rating fees obtained from the issuers (Covitz and Harrison 2003). The assigned credit rating contains important implications about the bond issue and its subsequent yield. Yield spread between rating categories can be substantial, often resulting in a difference of tens of millions of dollars in interest over the life of the obligation. For example, the yield spread between Baa and Ba rated debt often averages over 100 basis points (Standard and Poor’s Credit Week 2010) which can mean a difference in nominal payments of over $100 million over twenty years for a $500 million bond issue. There are also many regulatory requirements in the United States and abroad that are specified in terms of a firm’s assigned credit rating. Several agencies allow investments to be made only in the top rating categories (e.g. BBB- and above), typically referred to as “Investment Grade” debt. Ratings also play a prominent role in the international rules determining the level of capital banks must maintain. The fact that regulatory agencies define requirements partially based on independent ratings indicates the importance and degree to which the credit rating process is ingrained in the market system.
The economic impact of rating upgrades and downgrades is significant. There is substantial empirical evidence in the finance and accounting literature documenting the importance and information content of credit ratings and changes in credit ratings. Research indicates credit ratings contain pricing-relevant information and this information has measureable effects on the debt value and equity value of the firm (Kliger and Sarig 2000). Research also provides evidence of stock price movement and abnormal returns after credit rating changes (Holthausen and Leftwich 1986; Kim and Nabar 2007; Dichev and Piotroski 2001). In summary, there is substantial empirical evidence indicating the importance of credit ratings to the capital markets. This makes credit ratings an interesting and important area in which to explore the effects of financial statement comparability.
We also examine the effects of comparability on a firm’s cost of debt. While credit ratings are determined by a team of rating analysts, a firm’s cost of debt is determined more directly by market investors and provides an additional view of the effects of comparability on the overall value of the firm. A significant body of research exists which explores various accounting and finance related questions by investigating effects on a firm’s cost of debt capital. For example, Mansi et al. (2011) examine the relation between analyst forecasts and cost of debt and find the impact of analysts is most evident when uncertainty is higher. Anderson et al. (2004) examine board of director characteristics and accounting report integrity and find more independent board of directors and larger board size result in a lower cost of debt. They also find fully independent audit committees that meet frequently appear to increase the quality of accounting reports which correspondingly helps to reduce the cost of debt capital. Mansi et al. (2004) find firms engaging a Big 4 auditor achieve lower debt costs through increasing the perceived reliability of their financial statements, as well as obtaining the additional insurance protection Big 4 auditors are conjectured to provide by ostensibly protecting investors from future losses from audit failure. In a similar vein, Pittman and Fortin (2004) find selecting Big 4 auditors has a positive effect in reducing cost of debt capital for newly public firms. Other research utilizing a cost of debt framework examines earnings benchmarks, accruals quality, and earnings quality. Jiang (2008) finds the most salient of three common earnings benchmarks in the debt markets is the benchmark related to meeting positive earnings. Francis et al. (2005) conduct extensive analyses of the market pricing of accruals quality and find firms with higher accounting accruals quality (AQ) have lower ratios of interest expense to interest-bearing debt. Francis et al. (2008) examine the relations that exist between voluntary disclosure, earnings quality, and cost of capital and find that earnings quality plays a critical complementary role in evaluating the effects of voluntary disclosure on the cost of debt. Overall, there is considerable literature that illustrates how examination of the cost of debt can provide beneficial insights concerning questions germane to the accounting profession. This literature also provides additional incentive and support for the importance of investigating how comparability might affect the cost of debt capital.
2.3 The Benefit of Financial Statement Comparability
Recently, several studies have examined how capital market participants view financial statement comparability. Comparability in this sense refers to how firms in similar environments incorporate transactions in their published financial statements. These transactions are then reflected in stock returns. The more closely a firm’s information/return process matches another represents increased comparability. This basic premise is the reasoning behind the widely used measure developed by De Franco, Kothari, and Verdi (2011). Recognizing that each firm will make different decisions regarding inclusion, exclusion, timing expectations, as well as discount rates that impact the amount of a particular transaction recorded on the financial statements. This process will affect the earnings reported by different firms, and thus, future stock returns will vary.
Most current work examining financial statement comparability is based on De Franco et al. (2011) which develop a mapping of earnings to returns and document that higher comparability is positively related to analyst following and forecast accuracy. Also, the authors find that comparability is negatively related to analyst forecast dispersion. Sohn (2016) finds that firms with greater comparability have lower levels of accrual earnings management and higher levels of real earnings management, indicating that managers are constrained from a financial reporting perspective when they have high comparability. Imhoff, Seavey, and Smith (2017) extend this stream of research by examining the impact comparability has on the cost of equity capital. They find that greater comparability leads to lower cost of equity capital and this effect is most pronounced for firms with high information asymmetry. When examining the acquisitions, Chen, Collins, Kravet, and Mergenthaler (2018) find that as target comparability increases, so does acquisition profitability. Comparability is most beneficial to acquirers when information asymmetry of the target is higher, similar to results reported by Imhoff et al. (2017).
Based on the above discussion, we propose and test the following two hypotheses.
H1: Comparability is positively related to initial bond ratings.
H2: Comparability is negatively related to initial bond yields.
3. Variable Definitions and Research Design
3.1 Measure of Comparability
Financial accounting systems can be viewed as to map economic events to accounting numbers on financial statements. We follow De Franco et al. (2011) to empirically estimate accounting comparability as how closely two firms’ financial statements reflect similar economic events. DeFranco et al. (2011) use stock returns to represent economic events and earnings to proxy for financial statements. Specifically, we first estimate the following equation over the previous 16-quarter period.
Earningsit = 𝛼𝑖 + 𝛽𝑖 Returnit + εit (1) Where Earnings is the ratio of quarterly net income before extraordinary items to the market value of equity at the beginning of the quarter, and return is stock price return during the quarter.
We then estimate the expected earnings of each firm, i and j, as a function of the same economic event,
E(Earnings)iit = 𝛼̂𝑖 + 𝛽̂𝑖 Returnit (2)
E(Earnings)ijt = 𝛼̂𝑗 + 𝛽̂𝑗 Returnit (3)
where E(Earnings)iit is the predicted earnings of firm i given firm i’s stock returns in period t and E(Earnings)ijt is the
predicted earnings of firm j given firm i’s stock returns in period t. By using firm i’s stock return in both predictions, we measure the comparability of mappings between firm i and firm j for the same event (i.e., Returnit).
We calculate comparability between firm i and firm j during the 16-quarter estimation period from equations (2) and (3) as the negative value of the average absolute difference between the predicted earnings using firm i’s and firm j’s earnings functions:
𝐶𝑜𝑚𝑝𝑎𝑟𝑎𝑏𝑖𝑙𝑖𝑡𝑦𝑖𝑗𝑡= −161 × ∑𝑡𝑡−15|𝐸(𝐸𝑎𝑟𝑛𝑖𝑛𝑔𝑠𝑖𝑖𝑡) − 𝐸(𝐸𝑎𝑟𝑛𝑖𝑛𝑔𝑠𝑖𝑗𝑡)| (4) Greater values indicate higher comparability and the maximum value of the measure is zero. We calculate four different measures of comparability for our empirical analyses. After we estimate equations (2) and (3) for every firm i – firm j combination within the same two-digit Standard Industry Classification (SIC) industry, we rank all the values of Comparabilityijt and take average of highest four values. We refer to that measure as Comp_Four.
Similarly we take the average of highest ten values of Comparabilityijt to get our second measure, Comp_Ten. Our
third and four measures, Comp_Mean and Comp_Med, are the mean and median value of all Comparabilityijt for all
firms j in the same industry as firm i during period t. 3.2 Research Methodology
Our bond rating model is based on the econometrically sound work of Kaplan and Urwitz (1979) which remains robust and continues to be the foundation utilized by many researchers to examine contemporary issues (e.g. Francis et al. 2005; Ashbaugh-Skaife et al. 2006; Francis et al. 2008; Crabtree and Maher 2009). We utilize this basic model and expand it by including our measures of comparability. The basic bond rating model can be represented as follows (all independent variables are measured in the year prior to the bond issuance so that the financial information is available at the bond issuance.):
RATING = β0 + β1 COMPARABILITY + β2 SUB + β3 Log ASSETS + β4 LEVERAGE + β5 INCOME + β6 BETA + β7
AA_PM + ∑ βi FFINDi + ∑ βt YEARt (5)
where RATING = ordinal representation of the issue’s initial rating where Aaa = 30, Aa1 = 29, Aa2=28, etc. COMPARABILITY = measures of accounting comparability described previously. Specifically:
Comp_Four (Ten) = The average of four (ten) firms with the highest comparability for firm i.
Comp_Mean (Med) = Industry mean (median) of comparability for firm i for all firms in firm i’s industry.
Log ASSETS = log of total assets; Log ASSETS proxies for firm size and is expected to have a positive association with bond rating;
LEVERAGE = long-term debt divided by total assets; LEVERAGE represents the relative amount of debt currently incurred by the firm; LEVERAGE is expected to have a negative association with bond rating;
INCOME = operating income for the year divided by total assets; INCOME is expected to have a positive association with bond rating;
BETA = the firm’s common stock Beta for the last 5 years calculated using monthly returns; firms with a higher beta are considered riskier, hence BETA is expected to have negative association with bond rating;
AA_PM = the performance matched discretionary accruals FFIND = Fama French 48-industry classifications;
YEAR = Year dummy variable
To examine the effect of comparability on bond pricing, it is necessary to utilize a two-stage regression procedure following Anderson et al. (2004), Mansi et al. (2004), and Mansi et al. (2011). Two-stage regression is appropriate when examining bond yields because the bond rating has already been assigned to the issue prior to its sale to the public. To disentangle the effects of the rating and the yield, we estimate Equation 5 in the first stage, and then pass the residual onto our bond yield model to represent the orthogonal rating information (ORTHRATE). Consistent with prior research (e.g. Anderson et al. 2004; Mansi et al. 2011), we define bond yield as the spread between the issue yield and its duration-matched Treasury equivalent.
Our yield model can be represented as:
YLDSPREAD = β0 + β1 COMPARABILITY + β2 ORTHRATE + β3 SIZE + β4 CALL + β5 INTVOL + β6 SUB + β7 Log ASSETS + β8 LEVERAGE + β9 INCOME + β10 BETA + β11 AA_PM + ∑ βi FFINDi + ∑ βt
YEARt + (6)
Where:
YLDSPREAD = the spread between the issue yield and its duration-matched Treasury equivalent;
COMPARABILITY= measures of accounting comparability, as defined above for Eq. (5).
ORTHRATE = the security specific adjusted orthogonal credit rating which is the residual from the first stage regression, Equation 5.
SIZE = the natural log of the bond issue amount;
CALL = the ratio of years to call divided by years to maturity;
INTVOL = volatility of the prior ten days of the duration-matched Treasury equivalent;
The remaining independent variables are as defined earlier for Equation 5.
4. Data and Results
4.1 Sample Selection
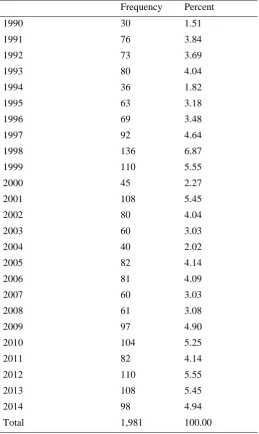
Table 1 reports the sample distribution. The sample is distributed evenly over the years. There is no evidence of industry clustering in the sample. The industries that contain the highest percentage of issuing new debts include: food, tobacco, textiles, paper, and chemicals (33.27%), manufacturing, machinery and electronics (30.49%), and agriculture, mining, oil, and construction (12.37 %)
Table 1. Sample Distribution
Panel A. Sample distribution - Year
Frequency Percent
1990 30 1.51
1991 76 3.84
1992 73 3.69
1993 80 4.04
1994 36 1.82
1995 63 3.18
1996 69 3.48
1997 92 4.64
1998 136 6.87
1999 110 5.55
2000 45 2.27
2001 108 5.45
2002 80 4.04
2003 60 3.03
2004 40 2.02
2005 82 4.14
2006 81 4.09
2007 60 3.03
2008 61 3.08
2009 97 4.90
2010 104 5.25
2011 82 4.14
2012 110 5.55
2013 108 5.45
2014 98 4.94
Panel B. Sample distribution - Industry
Industry (1-digit SIC) Frequency Percent
0-1 Agriculture, mining, oil, and construction 245 12.37% 2 Food, tobacco, textiles, paper, and chemicals 659 33.27%
3 Manufacturing, machinery, and electronics 604 30.49%
4 Transportation and communications 150 7.57%
5 Wholesale and retail 166 8.38%
7 Services 119 6.01%
8-9 Health, legal, and educational services and other 38 1.92%
Total 1981 100.00%
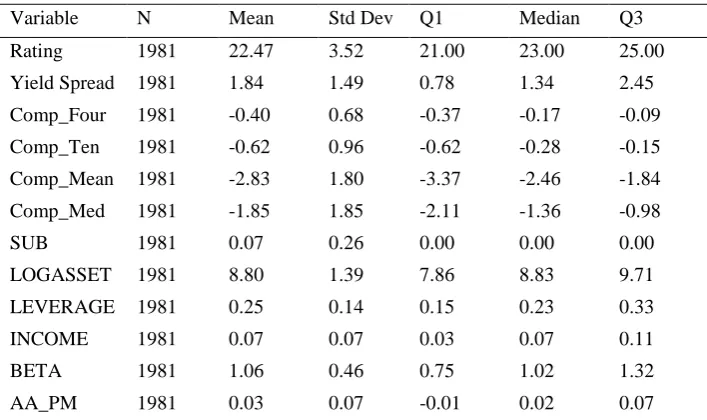
Table 2 reports the descriptive statistics for our sample. The mean yield spread is 184 basis points, with a median of 134 basis points and a standard deviation of 149 basis points. The average firm in the sample has Moody’s credit rating of Baa1, a leverage ratio of 25%. The firms are profitable, with ROA of 7%, and relatively large, with mean total assets of $6,634 million. Only 7 percent of the sample issued subordinated bonds.
In Table 2 we also present the descriptive statistics of the four comparability measures. Recall that all the measures are negative by construction and a value closer to zero denotes more comparability. Comp_Four and Comp_Ten have means values of -0.40 and -0.62 respectively while Comp_Mean and Comp_Med have mean values of -2.83 and -1.85 respectively. All values are similar to the values reported by prior studies.
Table 2. Descriptive Statistics
Variable N Mean Std Dev Q1 Median Q3
Rating 1981 22.47 3.52 21.00 23.00 25.00
Yield Spread 1981 1.84 1.49 0.78 1.34 2.45
Comp_Four 1981 -0.40 0.68 -0.37 -0.17 -0.09
Comp_Ten 1981 -0.62 0.96 -0.62 -0.28 -0.15
Comp_Mean 1981 -2.83 1.80 -3.37 -2.46 -1.84
Comp_Med 1981 -1.85 1.85 -2.11 -1.36 -0.98
SUB 1981 0.07 0.26 0.00 0.00 0.00
LOGASSET 1981 8.80 1.39 7.86 8.83 9.71
LEVERAGE 1981 0.25 0.14 0.15 0.23 0.33
INCOME 1981 0.07 0.07 0.03 0.07 0.11
BETA 1981 1.06 0.46 0.75 1.02 1.32
AA_PM 1981 0.03 0.07 -0.01 0.02 0.07
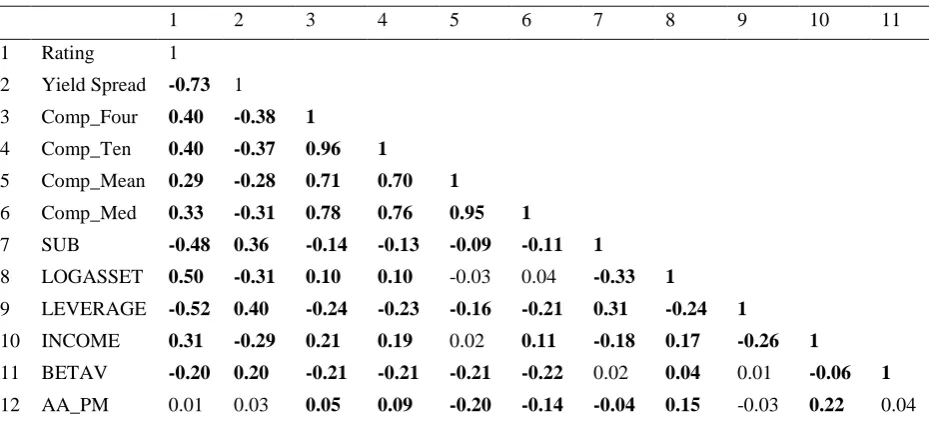
Table 3 provides correlation coefficients between bond credit rating, yield spread, comparability measures, and independent variables. Three observations are noteworthy. First, all four comparability measures are highly correlated, with correlation coefficients from 0.70 to 0.96, indicating that there is no construct validity issue. That is the four measures proxy for the same construct – accounting comparability. Second, credit ratings are positively related to each of the four comparability measures. Thus, from a univariate perspective, high accounting comparability is associated with a high credit rating. Third, in a similar manner, each of the four comparability measures is negatively associated with yield spread. This suggests, if a company accounting is more comparable to other companies in the same industry, the bond investors require a lower premium for the bonds. Taken together, the correlation table provides initial evidence that bond rating agencies and bond investors view accounting comparability positively and adjust the bond rating and pricing accordingly.
Table 3. Correlation matrix
1 2 3 4 5 6 7 8 9 10 11
1 Rating 1
2 Yield Spread -0.73 1
3 Comp_Four 0.40 -0.38 1
4 Comp_Ten 0.40 -0.37 0.96 1
5 Comp_Mean 0.29 -0.28 0.71 0.70 1
6 Comp_Med 0.33 -0.31 0.78 0.76 0.95 1
7 SUB -0.48 0.36 -0.14 -0.13 -0.09 -0.11 1
8 LOGASSET 0.50 -0.31 0.10 0.10 -0.03 0.04 -0.33 1
9 LEVERAGE -0.52 0.40 -0.24 -0.23 -0.16 -0.21 0.31 -0.24 1
10 INCOME 0.31 -0.29 0.21 0.19 0.02 0.11 -0.18 0.17 -0.26 1
11 BETAV -0.20 0.20 -0.21 -0.21 -0.21 -0.22 0.02 0.04 0.01 -0.06 1
12 AA_PM 0.01 0.03 0.05 0.09 -0.20 -0.14 -0.04 0.15 -0.03 0.22 0.04
This table reports Pearson correlation for bond rating, yield spread, comparability measures and other control variables. RATING is the ordinal representation of the bond issue’s initial rating . YLDSPREAD is the spread between the issue yield and its duration-matched Treasury equivalent; for firms with multiple bond issues, a weighted average spread is calculated based on the bond’s issue size. Comp_Four (Ten, Mean, Med) are the four measures of financial statement comparability. Log ASSETS represents the natural log of total assets. LEVERAGE is long-term debt divided by total assets. INCOME is operating income for the year divided by total assets. AA_PM is performance matched discretionary accruals. Bold indicates significance at a p-value < 0.01.
4.2 Bond Ratings and Comparability
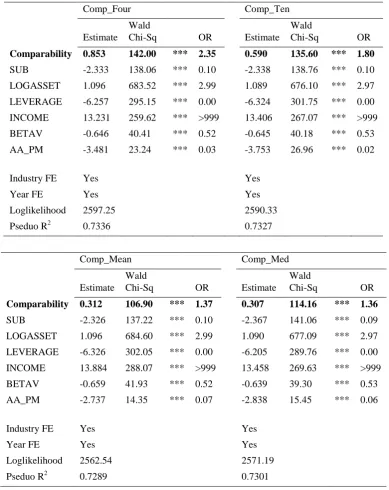
To empirically test whether bond rating agencies incorporate comparability into their ratings, we employ ordinal logistic regression with results reported in Table 4. The summary statistics indicate the models are robust (Pseudo R2s over 72%), suggesting the variables explain a significant amount of variation of bond ratings. All control variables are significant and have their correct theoretical signs.
Table 4. Logistic Regression Results - Bond Rating Models (n=1,981)
RATING = β0 + β1 COMPARABILITY + β2 SUB + β3 Log ASSETS + β4 LEVERAGE + β5 INCOME + β6 BETA β7 AA_PM + ∑ βi FFINDi + ∑ βt YEARt
Comp_Four Comp_Ten
Estimate Wald
Chi-Sq OR Estimate
Wald
Chi-Sq OR
Comparability 0.853 142.00 *** 2.35 0.590 135.60 *** 1.80
SUB -2.333 138.06 *** 0.10 -2.338 138.76 *** 0.10 LOGASSET 1.096 683.52 *** 2.99 1.089 676.10 *** 2.97 LEVERAGE -6.257 295.15 *** 0.00 -6.324 301.75 *** 0.00 INCOME 13.231 259.62 *** >999 13.406 267.07 *** >999 BETAV -0.646 40.41 *** 0.52 -0.645 40.18 *** 0.53 AA_PM -3.481 23.24 *** 0.03 -3.753 26.96 *** 0.02
Industry FE Yes Yes
Year FE Yes Yes
Loglikelihood 2597.25 2590.33
Pseduo R2 0.7336 0.7327
Comp_Mean Comp_Med
Estimate Wald
Chi-Sq OR Estimate
Wald
Chi-Sq OR
Comparability 0.312 106.90 *** 1.37 0.307 114.16 *** 1.36
SUB -2.326 137.22 *** 0.10 -2.367 141.06 *** 0.09 LOGASSET 1.096 684.60 *** 2.99 1.090 677.09 *** 2.97 LEVERAGE -6.326 302.05 *** 0.00 -6.205 289.76 *** 0.00 INCOME 13.884 288.07 *** >999 13.458 269.63 *** >999 BETAV -0.659 41.93 *** 0.52 -0.639 39.30 *** 0.53 AA_PM -2.737 14.35 *** 0.07 -2.838 15.45 *** 0.06
Industry FE Yes Yes
Year FE Yes Yes
Loglikelihood 2562.54 2571.19
Pseduo R2 0.7289 0.7301
operating income for the year divided by total assets; INCOME is expected to have a positive association with bond rating. BETA is the firm’s common stock Beta; firms with a higher beta are considered riskier, hence BETA is expected to have negative association with bond rating. AA_PM – performance matched discretionary accruals 4.3 Bond Yield Spread and Comparability
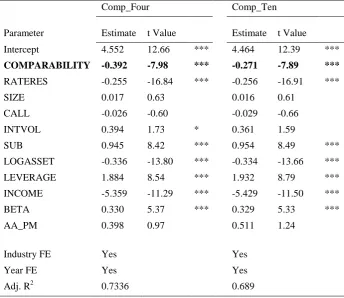
An alternative approach to investigate the effect of accounting comparability on cost of debt is to examine the impact of comparability on bond yield spreads. While bond ratings reflect the decision of rating analysts, the yield at issuance is a collective market measure of creditors’ confidence in the default risk of the issue. By examining new issues, we are able to observe a concise assessment by creditors of the issue without having to worry about timing, thin trading, and other informational delays. Table 5 provides the results from the regressions.
Table 5. Regression Results - Bond Yield Models (n=1,981)
YLDSPREAD = β0 + β1 COMPARABILITY + β2 ORTHRATE + β3 SIZE + β4 CALL + β5 INTVOL + β6 SUB + β7 Log ASSETS + β8 LEVERAGE + β9 INCOME + β10 BETA + β11 AA_PM + ∑ βi FFINDi + ∑ βt YEARt +
Comp_Four Comp_Ten
Parameter Estimate t Value Estimate t Value
Intercept 4.552 12.66 *** 4.464 12.39 ***
COMPARABILITY -0.392 -7.98 *** -0.271 -7.89 ***
RATERES -0.255 -16.84 *** -0.256 -16.91 ***
SIZE 0.017 0.63 0.016 0.61
CALL -0.026 -0.60 -0.029 -0.66
INTVOL 0.394 1.73 * 0.361 1.59
SUB 0.945 8.42 *** 0.954 8.49 ***
LOGASSET -0.336 -13.80 *** -0.334 -13.66 ***
LEVERAGE 1.884 8.54 *** 1.932 8.79 ***
INCOME -5.359 -11.29 *** -5.429 -11.50 ***
BETA 0.330 5.37 *** 0.329 5.33 ***
AA_PM 0.398 0.97 0.511 1.24
Industry FE Yes Yes
Year FE Yes Yes
Comp_Mean Comp_Med
Parameter Estimate t Value Estimate t Value
Intercept 4.478 12.41 *** 4.601 12.80 ***
COMPARABILITY -0.131 -5.45 *** -0.118 -5.35 ***
RATERES -0.261 -17.58 *** -0.261 -17.60 ***
SIZE 0.013 0.48 0.013 0.47
CALL -0.028 -0.64 -0.026 -0.58
INTVOL 0.367 1.60 0.380 1.67 *
SUB 0.967 8.57 *** 0.972 8.59 ***
LOGASSET -0.339 -13.87 *** -0.336 -13.70 ***
LEVERAGE 1.950 8.90 *** 1.902 8.53 ***
INCOME -5.787 -12.09 *** -5.645 -11.70 ***
BETA 0.345 5.69 *** 0.338 5.50 ***
AA_PM 0.118 0.29 0.175 0.43
Industry FE Yes Yes
Year FE Yes Yes
Adj. R2 0.6872 0.6863
Standard errors are clustered by firm. This table provides the results on the relation between bond yield spread and comparablity and other control variables. A two stage regression procedure is utilized following prior research, p-values are based on two-tailed tests. YLDSPREAD is the spread between the issue yield and its duration-matched Treasury equivalent; for firms with multiple bond issues, YLDSPREAD is calculated as a weighted average based on the bond’s issue size. Comp_Four (Ten, Mean, Med) are the four measures of financial statement comparability. ORTHRATE is the security specific adjusted credit rating; it is the residual from the first stage regression. ORTHRATE = RATING – ( β0 + β1 EM + β2 SUB + β3 ASSETS + β4 DEBT + β5 INCOME + β6 BETA ). SIZE is the natural log of the bond issue amount. CALL is the ratio of years to call divided by years to maturity. INTVOL is the volatility of the prior ten days of the duration-matched Treasury equivalent. SUB = 1 for subordinated bonds and 0 otherwise. Log ASSETS = the log of the firms total assets. LEVERAGE = the firm’s long-term debt scaled by total assets. INCOME= the operating income of the firm scaled by total assets. BETA = the firm’s common stock beta. AA_PM – performance matched discretionary accruals
Our results for bond yields are consistent with those presented previously for ratings. All four comparability measures are negatively related to lower bond yields at (p-value<0.01), providing support for H2. These are consistent with investors requiring an lower yield premium to purchase bonds from firms with high comparability.
5. Conclusion
The FASB conceptual framework defines comparability as “the qualitative characteristic that enables users to identify and understand similarities in, and differences among, financial statement items.” The accounting comparability is viewed as an important accounting quality (Kothari et al. 2010). Therefore, we examine the impact of accounting comparability on cost of new debt issues. New debt issues provide us an ideal sample to investigate this question in that the ratings are provided by the independent bond rating analysts after a detailed and complete analysis. It also avoids any timing delays in the reflection of current price duo to bonds that are thinly traded.
References
Anderson, R.C., S. A. Mansi, D. M. Reeb. (2004). Board characteristics, accounting report integrity, and the cost of debt. Journal of Accounting and Economics, 37(3), 315-342. https://doi.org/10.1016/j.jacceco.2004.01.004 Ashbaugh-Skaife, H., D. Collins, R. LaFond. (2006). The Effects of Corporate Governance on Firms' Credit Ratings.
Journal of Accounting and Economics, 42, 203-243. https://doi.org/10.1016/j.jacceco.2006.02.003
Bharath, S. T., S. Dahiya, A. Saunders, & A. Srinivasan. (2011). Lending relationships and loan contract terms. Review of Financial Studies, 24(4), 1141–1203. https://doi.org/10.1093/rfs/hhp064
Chen, C., Collins, D. W., Kravet, T., & Mergenthaler, R. (2018). Financial Statement Comparability and the Efficiency of Acquisition Decisions. Contemporary Accounting Research, 35(1), 164-202. https://doi.org/10.1111/1911-3846.12380
Covitz, D.M. & P. Harrison. (2003). Testing conflicts of interest at bond rating agencies with market anticipation: Evidence that reputation incentives dominate. Working paper, Federal Reserve Board.
Crabtree, A.D., & J.J. Maher. (2009). The influences of differences in taxable income and book income on the bond credit market. Journal of the American Taxation Association, 31(1), 75-99. https://doi.org/10.2308/jata.2009.31.1.75
De Franco, G., S. P. Kothari, & R. S. Verdi. (2011). The benefits of financial statement comparability. Journal of Accounting Research, 49(4), 895–931. https://doi.org/10.1111/j.1475-679X.2011.00415.x
Dichev, I. D., & Piotroski, J. D. (2001). The long run stock returns following bond ratings changes. Journal of Finance, 56(1), 173-203. https://doi.org/10.1111/0022-1082.00322
Easley, D., & M. O'Hara. (2004). Information and the cost of capital. Journal of Finance, 59(4), 1553–1583. https://doi.org/10.1111/j.1540-6261.2004.00672.x
Fang, X., Li, Y., Xin, B., & Zhang, W. (2016). Financial statement comparability and debt contracting: Evidence from the syndicated loan market. Accounting Horizons, 30(2), 277–303. https://doi.org/10.2308/acch-51437 Francis, J., R. LaFond, P. Olsson, & K. Schipper. (2005). The market pricing of accruals quality. Journal of
Accounting and Economics, 39(2), 295-327. https://doi.org/10.1016/j.jacceco.2004.06.003
Francis, J., D. Nanda, & P. Olsson. (2008). Voluntary disclosure, earnings quality, and cost of capital. Journal of Accounting Research, 46(1), 53-99. https://doi.org/10.1111/j.1475-679X.2008.00267.x
Holthausen, R. W., & Leftwich, R. W. (1986). The effect of bond rating changes on common stock prices. Journal of Financial Economics, 17, 57-90. https://doi.org/10.1016/0304-405X(86)90006-1
Imhof, M. J., Seavey, S. E., & Smith, D. B. (2017). Comparability and cost of equity capital. Accounting Horizons, 31(2), 125-138. https://doi.org/10.2308/acch-51710
Jiang, J. (2008). Beating earnings benchmarks and the cost of debt. The Accounting Review, 83(2), 377-416. https://doi.org/10.2308/accr.2008.83.2.377
Kim, S., P. Kraft, & S. Ryan. (2013). Financial statement comparability and credit risk. Review of Accounting Studies, 18(3), 783–823. https://doi.org/10.1007/s11142-013-9233-z
Kaplan, R.S. & G. Urwitz. (1979). Statistical models of bond ratings. Journal of Business, 52, 231-262. https://doi.org/10.1086/296045
Kim, Y. & S. Nabar. (2007). Bankruptcy probability changes and the differential informativeness of bond upgrades and downgrades. Journal of Banking and Finance, 31(12), 3843-3861. https://doi.org/10.1016/j.jbankfin.2007.02.008
Lambert, R., Leuz, C., & Verrecchia, R. E. (2007). Accounting information, disclosure, and the cost of capital. Journal of Accounting Research, 45(2), 385–420. https://doi.org/10.1111/j.1475-679X.2007.00238.x
Kliger, D. & O. Sarig. (2000). The information value of bond ratings. Journal of Finance, 55(6), 2879-2902. https://doi.org/10.1111/0022-1082.00311
Mansi, S. A., W. F. Maxwell, & D. P. Miller. (2004). Does auditor quality and tenure matter to investors? Evidence from the bond market. Journal of Accounting Research, 42(4), 755-793. https://doi.org/10.1111/j.1475-679X.2004.00156.x
Mansi, S. A., W. F. Maxwell, & D. P. Miller. (2011). Analyst forecast characteristics and the cost of debt. Review of Accounting Studies, 16 (March), 116-142. https://doi.org/10.1007/s11142-010-9127-2
Pittman, J.A., & S. Fortin. (2004). Auditor choice and the cost of debt capital for newly public firms. Journal of Accounting and Economics, 37(1), 113-136. https://doi.org/10.1016/j.jacceco.2003.06.005
Sohn, B C. (2016). The effect of accounting comparability on accrual-based and real earnings management. Journal of Accounting and Public Policy, 35, 513-539. https://doi.org/10.1016/j.jaccpubpol.2016.06.003
Thomson Reuters debt
http://dmi.thomsonreuters.com/Content/Files/2016%20Debt%20Capital%20Markets%20Review.pdf Thomson Reuters equity http://share.thomsonreuters.com/general/PR/ECM_4Q_2016_E.pdf
Wall Street Journal. (2001). Why credit agencies didn't switch off Enron. Wall Street Journal November 29: C1. Wall Street Journal. (2002). Moody's and S&P may accelerate process for cutting credit ratings. Wall Street Journal