Published by Canadian Center of Science and Education
How Cash Flow Volatility Affects Debt Financing and Accounts
Payable
Pierluigi Santosuosso1 1 School of Economics, Sapienza University of Rome, Rome, Italy
Correspondence: Pierluigi Santosuosso, School of Economics, Sapienza University of Rome, Rome, Italy. Tel: 39-6-4976-6460. E-mail: [email protected]
Received: April 24, 2015 Accepted: July 9, 2015 Online Published: July 25, 2015 doi:10.5539/ijef.v7n8p138 URL: http://dx.doi.org/10.5539/ijef.v7n8p138
Abstract
This paper investigates how volatility of cash flow from operations affects debt financing and accounts payable using a sample of Italian listed firms. Firms with different levels of cash flow were also examined. We find that firms that have more cash flow volatility have lower long-term debt to total debt, whatever the average level of their cash flow. We also show that accounts payable is positively associated with cash flow volatility, in particular for firms with a higher level of cash flow. Lastly, research findings reveal that firm leverage as measured by the total debt to assets ratio is negatively associated with cash flow volatility when firms have a lower level of cash flow, while the same relationship was not found for firms with a higher cash flow level. Keywords: cash flow volatility, capital structure, leverage, accounts payable, Italian firms
1. Introduction
Several surveys conducted around the world have analysed financial managers’ opinions about the factors which affect capital structure policy in practice. The volatility of cash flow and/or the volatility of earnings are considered to be two of the most important factors that influence the choices of financial managers. Based on the responses of chief financial officers of a US firm sample, one of the most cited surveys indicates that cash flow and earnings volatility are the third most important factor affecting decisions about issuing debt (Graham & Harvey, 2001). In the US and in four European countries (United Kingdom, France, Germany and Holland), cash flow and earnings volatility are considered the second or the third most relevant factor to drive the choices of chief financial officers (Brounen, de Jong, & Koedijk, 2004) and the fourth most important determinant of capital structure choice when the analysis is extended to managers’ responses in a broader sample of companies in 16 European countries (Bancel & Mittoo, 2004). Surveys conducted in other countries confirm the importance of the volatility of cash flow in capital structure policy. For example, Korean managers consider cash flows and earnings volatility to be the most important after financial flexibility (Lee, Oh, & Park, 2014).
This paper attempts to determine whether managers’ opinions about cash flow volatility are translated into capital structure choices. A negative relationship between cash flow volatility and firm leverage is commonly mentioned in several studies about capital structure (e.g., Harris & Raviv, 1991; Frank & Goyal, 2009). According to the trade-off theory (Kraus & Lintzenberger, 1973; Scott, 1977; Kim, 1978), it is generally accepted that the higher the volatility of cash flow, the lower the amount of debt financing that ceteris paribus is needed to maintain an optimal capital structure that balances financial distress and bankruptcy cost with debt tax-shields and other benefits (Bradley, Jarrell & Kim, 1984; Kale, Noe, & Ramirez, 1991).
Using a sample composed of non-financial firms listed on the Italian stock exchange, we address the following research questions. First, this paper seeks to verify the correlation between cash flow volatility and debt financing. Second, the aim of this paper is to investigate the association between cash flow volatility and other types of liabilities unexplored in this field of study, such as the accounts payable. In our sample, the average amount of debt financing and accounts payable represents an important portion of total liabilities, equal to almost 70% percent of the total amount. These correlations were also examined by grouping firms with different levels of cash flow. We expect that cash flow volatility can induce managers to overcome a cash flow shortage by modifying firm leverage and/or the amount of accounts payable and that the amount of cash flow can alter capital structure decisions and thus the above-mentioned correlations.
The remainder of this paper is organized as follows: the second section gives a brief overview of the related literature, the third section shows how the firm sample was selected and the survey methodology, the fourth section presents the results whilst the last section summarizes concluding remarks.
2. Literature Review
In line with the proposition stated by the trade-off theory of capital structure, the existence of an inverse correlation between cash flow volatility and leverage is based on the assumption that firms with high cash flow volatility can reduce the expected costs of financial distress and bankruptcy by lowering firm leverage. Although a negative correlation between cash flow volatility and/or earnings volatility and leverage is commonly mentioned in several studies (e.g., Harris & Raviv, 1991; Frank & Goyal, 2009), there is no general agreement on the existence of such a relation and under what circumstances it would be valid.
A negative relationship between cash flow volatility and firm leverage was found in previous research on this matter by Bradley, Jarrell and Kim (1984) and more recently by several studies addressing specific circumstances. Kale, Noe and Ramirez (1991) documented the existence of a U-shaped relation between the coefficient of variation of cash flows and the optimal debt level, suggesting the existence of a negative relation for low levels of debt and a positive correlation when the level of debt is high. Graham and Leary (2011) found that high leverage firms with longer maturity debt have on average less volatile earnings, defined as the standard deviation of operating income to assets over 10 years. Akhtar (2012) documented that cash flow volatility, measured as the standard deviation of operating income, is negatively related with long-term market leverage ratios during the trough times of business cycles. Different measures of volatility and various circumstances have also been examined. For instance, Dudley and James (2014) found a significant negative association between leverage and asset volatility by measuring volatility as the variance of industry operating income while Levine and Wu (2014) confirmed the inverse relation using panel data on a corporate merger event.
In contrast, Titman and Wessels (1988) did not find any association between earnings volatility and various measures of leverage whilst, Lemmon, Roberts and Zender (2008) argued that much of the explanatory power of capital structure determinants, including the standard deviation of operating income used as proxy of cash flow volatility, is due to cross-sectional rather than time-series variations.
In addition to the research that has specifically addressed this issue, some evidence about a possible relationship between cash flow volatility and firm leverage can be found in studies which have analysed investment policy and those which have examined the cost of debt and its determinants.
As regards the effects of cash flow volatility and/or earnings volatility on investments, some empirical studies have shown that firms facing high earnings volatility tend to forgo investments rather than use external capital (Minton & Schrand, 1999), according to the Pecking order theory that assumes firms prefer funds generated internally, then the issuing of debt and lastly the issuing of new shares (Myers, 1984; Myers & Majluf, 1984). The correlation seems to depend on various circumstances. For example, the relationship varies depending on the cash flow level, with an increased amount of investments at a higher level of cash flow (Minton & Schrand, 1999). The impact of cash flow volatility on investment also differs between financially constrained and unconstrained firms. In particular, recent evidence has suggested that financially constrained firms decrease investment in the case of persistently high cash flow volatility (O’Connor Keefe & Tate, 2013). In contrast, some studies have reported that investments in financially constrained firms are positively affected by cash flow volatility (Boyle & Guthrie, 2003; Hirth & Viswanatha, 2011).
As far as studies about the cost of debt are concerned, empirical research (Minton & Schrand, 1999) found that cash flow volatility and the cost of debt are positively correlated, specifically in the presence of information asymmetry and other capital market imperfections. Although some studies have found a weak inverse relationship between credit ratings and earnings volatility or did not find any association between credit ratings and operating cash flow volatility (Shivdasani & Zenner, 2005), the aforementioned volatility seems to play an important role in pricing corporate bond (Mittoo & Zhang, 2010; Douglas, Huang, and Vetzal (2009) and in firm value creation (Rountree, Weston, & Allayannis, 2008).
3. Firm sample and Methodology
The sample examined in this study is made up of 198 Italian listed firms in the period 2005-2013. Firms were included in the sample if data about cash flow from operations were available for at least five years. We excluded banks, finance and insurance companies from the sample. On the basis of these selection criteria, all non-financial companies listed on the Italian Stock Exchange were included in the sample. The data were obtained from the Thomson Reuters database, yielding an unbalanced panel of 1,679 firm-year observations.
We computed cash flow volatility (CFV) as the coefficient of variation of cash flow obtained by dividing the standard deviation by the mean of the annual cash flow from operations for 9 years, or for a shorter period if data were not available, from 2005 to 2013. In order to ascertain the correlation between CFV and proxies of debt structure, the firm sample was divided into two main groups: firms with a higher CFV and firms with a lower CFV. We assumed that firms with a high CFV are above the median of the aforementioned coefficient of variation, whilst firms with a low CFV are below the median. Each of the two groups of firms were further divided into two subgroups on the basis of the average value of the cash flow to assets ratio in order to test whether the levels of cash flow are able to affect the correlation between CFV and the firm’s debt structure. In particular, firms with a higher level of cash flow and firms with a lower level fall respectively into the portion above and below the median of the aforementioned cash flow to assets ratio.
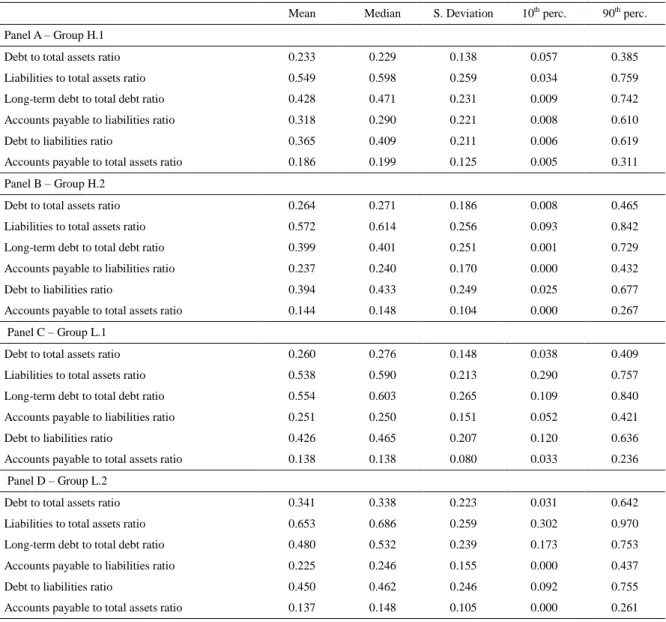
The descriptive statistics of the firms’ debt structure for each of the four groups are shown in Table 1. Table 1. Descriptive statistics
Mean Median S. Deviation 10th perc. 90th perc. Panel A – Group H.1
Debt to total assets ratio 0.233 0.229 0.138 0.057 0.385
Liabilities to total assets ratio 0.549 0.598 0.259 0.034 0.759 Long-term debt to total debt ratio 0.428 0.471 0.231 0.009 0.742 Accounts payable to liabilities ratio 0.318 0.290 0.221 0.008 0.610
Debt to liabilities ratio 0.365 0.409 0.211 0.006 0.619
Accounts payable to total assets ratio 0.186 0.199 0.125 0.005 0.311 Panel B – Group H.2
Debt to total assets ratio 0.264 0.271 0.186 0.008 0.465
Liabilities to total assets ratio 0.572 0.614 0.256 0.093 0.842 Long-term debt to total debt ratio 0.399 0.401 0.251 0.001 0.729 Accounts payable to liabilities ratio 0.237 0.240 0.170 0.000 0.432
Debt to liabilities ratio 0.394 0.433 0.249 0.025 0.677
Accounts payable to total assets ratio 0.144 0.148 0.104 0.000 0.267 Panel C – Group L.1
Debt to total assets ratio 0.260 0.276 0.148 0.038 0.409
Liabilities to total assets ratio 0.538 0.590 0.213 0.290 0.757 Long-term debt to total debt ratio 0.554 0.603 0.265 0.109 0.840 Accounts payable to liabilities ratio 0.251 0.250 0.151 0.052 0.421
Debt to liabilities ratio 0.426 0.465 0.207 0.120 0.636
Accounts payable to total assets ratio 0.138 0.138 0.080 0.033 0.236 Panel D – Group L.2
Debt to total assets ratio 0.341 0.338 0.223 0.031 0.642
Liabilities to total assets ratio 0.653 0.686 0.259 0.302 0.970 Long-term debt to total debt ratio 0.480 0.532 0.239 0.173 0.753 Accounts payable to liabilities ratio 0.225 0.246 0.155 0.000 0.437
Debt to liabilities ratio 0.450 0.462 0.246 0.092 0.755
Accounts payable to total assets ratio 0.137 0.148 0.105 0.000 0.261
The group of firms H.1 is characterized by high CFV and a high level of cash flow (Panel A), group H.2 contains firms with high CFV and a low level of cash flow (Panel B), group L.1 refers to firms with low CFV and a high level of cash flow (Panel C) and group L.2 is made up of firms which have low CFV and cash flow level (Panel D). Three main features emerged from the differences in the firms’ characteristics. First, firms with high CFV have lower leverage. Specifically, the average value of the debt to assets ratio and the debt to liabilities ratio range, respectively, from 23.3% and 36.5% for the group with the highest CFV and cash flow level to 34.1% and
45% for the group with the lowest CFV and level of cash flow. Second, the long-term debt to total debt ratio decreases on average for the aforementioned groups of firms with the highest CFV and increases for the groups of firms with the lowest CFV. Third, firms with high CFV have higher amount of accounts payable. In particular, the average accounts payable to total assets ratio is equal to 18.6% in the group with the highest CFV and cash flow level and equals 13.7% in the group with the lowest CFV and level of cash flow.
The correlation between CFV and proxies of debt structure was therefore tested using the annual observations for each firm in our sample on the basis of the logistic regression model. The model has the following general form:
𝑙𝑜𝑔𝑖𝑡(𝑝) = log(𝑝/(1 − 𝑝)) = 𝛽0+ 𝛽1𝑥1+ 𝛽2𝑥2+. . . +𝛽𝑝𝑥𝑝 (1)
where log(p/(1-p)) is the natural logarithm of the odds, p is the probability between 0 and 1 that the dependent variable will occur, xp is the pth explanatory (predictor) variable and βp is the pth parameter of the logistic model
obtained by the method of maximum likelihood.
The first set of regressions involved the binary dependent variable Y (firms with high cash flow volatility Y=1; firms with low cash flow volatility Y=0) and the following financial ratios xp as independent variables. We
examined the debt to total assets ratio and the accounts payable to total assets ratio in order to analyze the two main components of debt structure. As shown in Table 1, the sum of debt and accounts payable ranges on average from 63.1% to 68.3% over the amount of liabilities. The regression analysis was performed for the entire sample of 198 firms and for the two following subsamples: the first subsample is composed offirms in groups H.1 and L.1 with a higher level of cash flow; the second subsample is made up of companies in groups H.2 and L.2 with a lower cash flow level.
The second set of regressions focused more specifically on the components of liabilities. We used CFV as binary dependent variable Y (firms with high cash flow volatility Y=1; firms with low cash flow volatility Y=0) and the following financial ratios xp as independent variables: the liabilities to total assets ratio, the debt to liabilities
ratio, the long-term debt to total debt ratio and the accounts payable to liabilities ratio. The regressions were performed for the entire firm sample and for the two aforementioned subsamples which differ in their level of cash flow to assets ratio.
The correlation of variables used in the first stage of the regression analysis related to the debt to total assets ratio and to the accounts payable to total assets ratio is -0.11. The correlation matrix for the variables related to the components of liabilities is presented in Table 2. The results confirm the absence of the multicollinearity problem. The Variable Inflation Factor (VIF) was also computed to test the multicollinearity, as shown by the VIF of the following independent variables: the liabilities to total assets ratio (1.161), the debt to liabilities ratio (1.450), the long-term debt to total debt ratio (1.121) and the accounts payable to liabilities ratio (1.445).
Table 2. Correlation matrix
Liabilities to assets Debt to liabilities Long-term debt to total debt
Accounts payable to liabilities Liabilities to assets 1.0000
Debt to Liabilities 0.3304 1.0000
Long-term debt to total debt -0.0138 0.2722 1.0000
Accounts payable to liabilities -0.2806 -0.5254 -0.2743 1.0000
4. Results
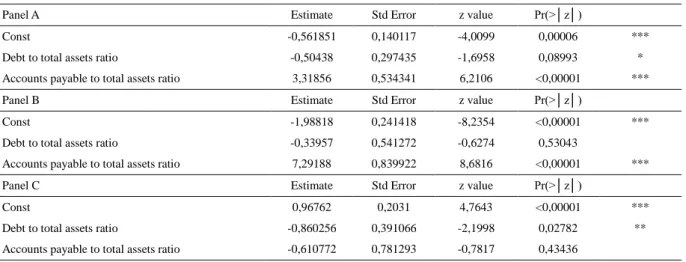
Panel A of Table 3 presents the results of the regression analysis for the entire firm sample. The research findings revealed the existence of a significant positive correlation between CFV and the accounts payable to assets ratio and a negative association between CFV and the debt to assets ratio. Debt structure characteristics were explored in more detail by analyzing separately the subsamples with different levels of cash flow. Panel B and panel C of Table 3 show, respectively, the results of regressions using the subsample made up of the groups of firms H.1 and L.1 with a higher level of cash flow and the subsample of firms composed of groups H.2 and L.2 with a lower cash flow level. For the first subsample of firms (H.1 and L.1), only the accounts payable to assets ratio positively explained the probability of having a high level of CFV. Vice versa, for the second subsample of firms (H.2 and L.2), the regression analysis confirmed only the negative correlation between CFV and debt to assets
ratio. Taken together, the regression results shown in Table 3 suggest that firms with high CFV respond to shortfalls in cash by increasing the amount of accounts payable in the case of a higher level of cash flow and by decreasing the leverage if the cash flow level is lower. As far as the correlation between the CFV and leverage is concerned, the negative relationship is confirmed by most studies on this topic (e.g., Bradley, Jarrell, & Kim, 1984), although the correlation varies depending on different circumstances as mentioned in section 2 (e.g., Kale, Noe, & Ramirez, 1991).
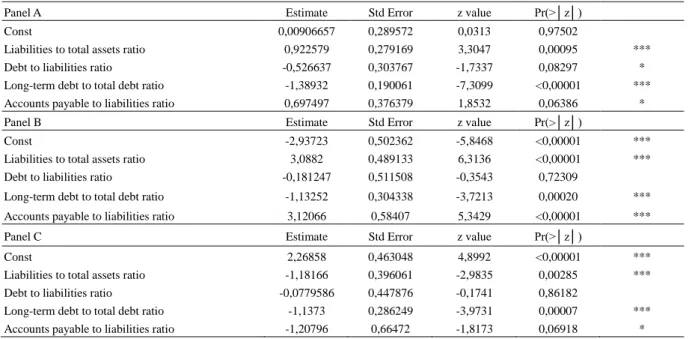
Panel A of Table 4 provides evidence about the correlations between CFV and proxies of the components of liabilities for the entire firm sample. The regression analysis revealed that the probability of having high CFV increases as the debt to total liabilities ratio decreases. The inverse association is particularly significant for long-term debts, as shown by the strong negative estimate of the long-term debt to total debt ratio. This result is consistent with the research findings of other studies (Graham & Leary, 2011; Akhtar, 2012) that outlined the negative correlation between various proxies of CFV and long-term leverage ratios. On the contrary, research findings documented a positive probability of having a large amount of accounts payable for firms characterized by a high level of CFV, as shown in panel A of Table 4 by the positive estimate of the accounts payable to liabilities ratio. And, when all liabilities are considered, a positive association was also found between CFV and the total liabilities to total assets ratio.
Table 3. Debt, accounts payable and regression results
Panel A Estimate Std Error z value Pr(>│z│)
Const -0,561851 0,140117 -4,0099 0,00006 ***
Debt to total assets ratio -0,50438 0,297435 -1,6958 0,08993 * Accounts payable to total assets ratio 3,31856 0,534341 6,2106 <0,00001 ***
Panel B Estimate Std Error z value Pr(>│z│)
Const -1,98818 0,241418 -8,2354 <0,00001 ***
Debt to total assets ratio -0,33957 0,541272 -0,6274 0,53043
Accounts payable to total assets ratio 7,29188 0,839922 8,6816 <0,00001 ***
Panel C Estimate Std Error z value Pr(>│z│)
Const 0,96762 0,2031 4,7643 <0,00001 ***
Debt to total assets ratio -0,860256 0,391066 -2,1998 0,02782 ** Accounts payable to total assets ratio -0,610772 0,781293 -0,7817 0,43436
Note. *** Significant at the 0.01 level, ** Significant at the 0.05 level, * Significant at the 0.10 level (two-tailed).
Panel B of Table 4 shows the regression results for the subsample made up of firms in groups H.1 and L.1 with a higher level of cash flow. Although the debt to liabilities ratio did not have any statistical significance, the long-term debt to total debt ratio continues to have a negative explanatory power on CFV, whilst a significant positive correlation between CFV and the amount of accounts payable over total liabilities was found. Moreover, as in the regression results observed for the entire firm sample, a positive association was found between the probability of having high CFV and the total amount of liabilities over assets.
Regression results for the subsample composed of firms in groups H.2 and L.2 with a lower cash flow level are shown in panel C of Table 4. The estimate of the long-term debt to total debt continues, as in the previous regressions, to have a negative significant explanatory power on CFV. Unlike the results of the previous regressions, research findings revealed a negative association between the probability of having a high CFV and the accounts payable to liabilities ratio and also the liabilities to total assets ratio. In other words, the regression results suggest that firms with higher CFV did not respond to shortfalls in cash by increasing the amount of accounts payable when the cash flow level is lower.
Table 4. Liabilities and regression results
Panel A Estimate Std Error z value Pr(>│z│)
Const 0,00906657 0,289572 0,0313 0,97502
Liabilities to total assets ratio 0,922579 0,279169 3,3047 0,00095 *** Debt to liabilities ratio -0,526637 0,303767 -1,7337 0,08297 * Long-term debt to total debt ratio -1,38932 0,190061 -7,3099 <0,00001 *** Accounts payable to liabilities ratio 0,697497 0,376379 1,8532 0,06386 *
Panel B Estimate Std Error z value Pr(>│z│)
Const -2,93723 0,502362 -5,8468 <0,00001 ***
Liabilities to total assets ratio 3,0882 0,489133 6,3136 <0,00001 *** Debt to liabilities ratio -0,181247 0,511508 -0,3543 0,72309
Long-term debt to total debt ratio -1,13252 0,304338 -3,7213 0,00020 *** Accounts payable to liabilities ratio 3,12066 0,58407 5,3429 <0,00001 ***
Panel C Estimate Std Error z value Pr(>│z│)
Const 2,26858 0,463048 4,8992 <0,00001 ***
Liabilities to total assets ratio -1,18166 0,396061 -2,9835 0,00285 *** Debt to liabilities ratio -0,0779586 0,447876 -0,1741 0,86182
Long-term debt to total debt ratio -1,1373 0,286249 -3,9731 0,00007 *** Accounts payable to liabilities ratio -1,20796 0,66472 -1,8173 0,06918 *
Note. *** Significant at the 0.01 level, ** Significant at the 0.05 level, * Significant at the 0.10 level (two-tailed).
5. Conclusions
Several surveys have documented that cash flow volatility is one of the most important factors that affect the choices of a financial officer. This paper has investigated the correlation between cash flow volatility and capital structure using a sample of Italian listed firms for the period 2005-2013. The association has been analyzed for different levels of cash flow by examining some of the main components of liabilities, such as debt and accounts payable.
Three main findings emerge from the present research. First, we found that firms with higher CFV have a lower portion of long-term debt whatever the average level of cash flow, as shown by the significant negative correlation between CFV and the long-term debt to total debt ratio. Second, a more surprising correlation emerged with the accounts payable. Accounts payable is positively associated with CFV both in relation to total assets and to total liabilities, as also confirmed by the descriptive statistics. In particular, a moderate correlation was found for the entire firm sample and a significant correlation was detected for firms with a higher level of cash flow. These results allow us to hypothesize that firms with higher CFV and a higher average amount of cash flow to assets are able to meet shortfalls in cash by increasing accounts payable. The same correlation was not found for firms with a lower level of cash flow. Third, firm leverage, as measured by the debt to total assets ratio, is negatively associated with CFV. Specifically, the inverse correlation between leverage and CFV is more significant in the case of a low level of cash flow, while the same relationship was not found when firms have a higher cash flow level.
Taking these results together, the analysis suggested that the relation between cash flow volatility and capital structure is mainly affected by long-term debt and accounts payable and that the cash flow level is an important determinant in explaining these relations. These findings contribute to the existing knowledge about the role that CFV plays in capital structure and may be useful for lenders and investors in their decision-making process. References
Akhtar, S. (2012). Capital structure and business cycles. Accounting and Finance, 52, 25-48. http://dx.doi.org/10.1111/j.1467-629X.2011.00425.x
Bancel, F., & Mittoo, U. R. (2004). Cross-country determinants of capital structure choice: A survey of European firms. Financial Management, 33(4), 103-132.
Boyle, G. W., & Guthrie, G. A. (2003). Investment, uncertainty, and liquidity. The Journal of Finance, 58(5), 2143-2166. http://dx.doi.org/10.1111/1540-6261.00600
Bradley, M., Jarrell, G. A., & Kim, E. H. (1984). On the existence of an optimal capital structure: theory and evidence. The Journal of Finance, 39(3), 857-878. http://dx.doi.org/10.1111/j.1540-6261.1984.tb03680.x
Brounen, D., De Jong, A., & Koedijk, K. (2004). Corporate finance in Europe: Confronting theory with practice.
Financial Management, 33(4), 71-101. http://dx.doi.org/10.2139/ssrn.559415
Douglas, A. V. S., Huang, A. G., & Vetzal, K. R. (2012). Cash flow volatility and corporate bond yield spreads. http://dx.doi.org/10.2139/ssrn.2150685
Dudley, E., & James, C. (2014). Cash flow volatility and capital structure choice. Retrieved from http://ssrn.com/abstract=2492152
Frank, M. Z., & Goyal, V. K. (2009). Capital structure decisions: Which factors are reliably important? Financial Management, 38(1), 1-37. http://dx.doi.org/10.1111/j.1755-053X.2009.01026.x
Graham, J. R., & Harvey, C. R. (2001). The theory and practice of corporate finance: Evidence from the field.
Journal of Financial Economics, 60, 187-243. http://dx.doi.org/10.1016/S0304-405X(01)00044-7
Graham, J. R., & Leary, M. T. (2011). A review of empirical capital structure research and directions for the future. Annual Review of Financial Economics, 3. Retrieved from http://ssrn.com/abstract=1729388.http://dx.doi.org/10.2139/ssrn.1729388
Harris, M., & Raviv, A. (1991). The Theory of Capital Structure. The Journal of Finance, 46(1), 297-355. Hirth, S., & Viswanatha, M. (2011). Financing constraints, cash-flow risk, and corporate investment. Journal of
Corporate Finance, 17, 1496-1509. http://dx.doi.org/10.1016/j.jcorpfin.2011.09.002
Kale, J. R., Noe, T. H., & Ramirez, G. G. (1991). The effect of business risk on corporate capital structure: Theory and evidence. The Journal of Finance, 46(5), 1693-1715. http://dx.doi.org/10.1111/j.1540-6261.1991.tb04640.x
Kim, E. H. (1978). Mean-Variance of optimal capital structure and corporate debt capacity. The Journal of Finance, 33(1), 63-45. http://dx.doi.org/10.1111/j.1540-6261.1978.tb03388.x
Kraus, A., & Litzemberger, R. H. (1973). A state-preference model of optimal financial leverage. The Journal of Finance, 28(4), 911-922. http://dx.doi.org/10.1111/j.1540-6261.1991.tb03753.x
Lee, H., Oh, S., & Park, K. (2014). How do capital structure policies of emerging markets differ from those of developed economies? Survey evidence from Korea. Emerging Markets Finance & Trade, 50(2), 34-72. http://dx.doi.org/10.2753/REE1540-496X500203
Lemmon, M. L., Roberts, M. R., & Zender, J. F. (2008). Back to the beginning: Persistence and the cross-Section of corporate capital structure. The Journal of Finance, 63(4), 1575-1608. http://dx.doi.org/10.1111/j.1540-6261.2008.01369.x
Levine, O., & Wu, Y. (2015). Asset volatility and financial policy: Evidence from corporate mergers. http://dx.doi.org/10.2139/ssrn.2399154
Minton, B. A., & Schrand, C. (1999). The impact of cash flow volatility on discretionary investment and the costs of debt and equity financing. Journal of Financial Economics, 54, 423-460. http://dx.doi.org/10.1016/S0304-405X(99)00042-2
Mittoo, U. R., & Zhang, Z. (2010). Bond market access, credit quality, and capital structure: Canadian evidence.
The Financial Review, 45, 579-602. http://dx.doi.org/10.1111/j.1540-6288.2010.00262.x
Myers, S. C. (1984). The capital structure puzzle. The Journal of Finance, 39, 575-592. http://dx.doi.org/10.2307/2327916
Myers, S. C., & Majluf, N. (1984). Corporate financing and investment decisions when firms have information that investors do not have. Journal of Financial Economics, 13(2), 187-221. http://dx.doi.org/10.1016/0304-405X(84)90023-0
O’Connor Keefe, M., & Tate, J. (2013). Is the relationship between investment and conditional cash flow volatility ambiguous, asymmetric or both? Accounting and Finance, 53, 913-947. http://dx.doi.org/10.1111/acfi.12034
Rountree, B., Weston, J. P., & Allayannis, G. (2008). Do investors value smooth performance? Journal of Financial Economics, 90, 237-251. http://dx.doi.org/10.1016/j.jfineco.2008.02.002
Scott, Jr. J. H. (1977). Bankruptcy, secured debt, and optimal capital structure. The Journal of Finance, 32, 1-19. http://dx.doi.org/10.1111/j.1540-6261.1977.tb03237.x
Journal of Applied Corporate Finance, 17(1), 26-35. http://dx.doi.org/10.1111/j.1745-6622.2005.025_1.x Titman, S., & Wessels, R. (1988). The Determinants of capital structure choice. The Journal of Finance, 43(1),
1-19. http://dx.doi.org/10.1111/j.1540-6261.1988.tb02585.x
Copyrights
Copyright for this article is retained by the author(s), with first publication rights granted to the journal.
This is an open-access article distributed under the terms and conditions of the Creative Commons Attribution license (http://creativecommons.org/licenses/by/3.0/).