Optimization of compression formulation and load of food-grade
tracers for grain traceability using central composite design
Liang Kun
,
Zhang Lingling
,
Lu Wei
,
Cedric Sean Okinda
,
Shen Mingxia
*(College of Engineering/Key Laboratory of Intelligent Equipment for Agriculture of Jiangsu Province, Nanjing Agricultural University, Nanjing 210031, China)
Abstract: Food-grade tracers have been developed as an identification technology for grain traceability from original harvest to final destination for transportation. The characteristics of food-grade tracers must be able to satisfy the environmental demands for grain traceability. To optimize the food-grade tracer production process, the effects of direct compression formulation and load on the mechanical characteristics were studied using response surface methodology (RSM) with central composite design (CCD). Among the four tested formulations, Formulations #2 (consisting of 35.00% lactose 100 mesh, 64.50% microcrystalline cellulose 102 and 0.50% magnesium stearate) and #4 (consisting of 38.00% lactose 100 mesh, 50.00% microcrystalline cellulose 102, 11.00% pregelatinized starch and 1.00% magnesium stearate) were selected for tracer production based on their physical properties as powders. The value of Carr’s flowability index was 68 for both Formulations #2 and #4, which was the highest among all the formulations. Therefore, Formulations #2 and #4 also had the best powder flowability. The magnesium stearate ratio (1.00%-3.00%) and pressure (6.00-16.00 kgf) were used as independent variables to detect changes in the breaking rate, peak shear force and friction coefficient of tracers compressed by the selected formulations. The optimal production parameters could be achieved at a magnesium stearate ratio of 2.25% and pressure of 16.00 kgf for Formulation #2 and at a magnesium stearate ratio of 1.02% and pressure of 16.00 kgf for Formulation #4. Under these optimal conditions, the tracers had good impact characteristics (breaking rate), compression characteristics (peak shear force) and frictional characteristics (friction coefficient). Moreover, Formulation #2 was more suitable for production because compared to Formulation #4, its breaking rate and friction coefficient values were lower, and its peak shear force value was higher.
Keywords: grain traceability, food-grade tracer, optimization, food safety, formulation, mechanical property, central composite design
DOI: 10.25165/j.ijabe.20171006.3531
Citation: Liang K, Zhang L L, Lu W, Okinda C S, Shen M X. Optimization of compression formulation and load of food-grade tracers for grain traceability using central composite design. Int J Agric & Biol Eng, 2017; 10(6): 221–230.
1 Introduction
Grain production and consumption in China account
Received date: 2017-05-30 Accepted date: 2017-08-26
Biographies: Liang Kun, PhD, Lecturer, research interests: non-detection and traceability of agricultural products, Email: [email protected]; Zhang Lingling, undergraduate, research interests: non-detection and traceability of agricultural products, Email: [email protected]; Lu Wei, PhD, Associate Professor, research interests: robotics and nondestructive testing, Email: [email protected]; Cedric Sean Okinda, PhD candidate, research interests: computer application in agriculture, Email: [email protected].
*Corresponding author: Shen Mingxia, PhD, Professor, research interests: intelligent measurement and control, No. 40, Dianjiangtai Road, Pukou District, Nanjing 210031, Jiangsu, China. Tel: +86-25-58606502, Email: [email protected].
for 30% of total grain consumption worldwide, and grain
food safety is a key safety issue for food production.
Cereal grains, including wheat, beans, rice and coarse
grains, and other grains are defined as grain foods by the
Food and Agriculture Organization (FAO)[1]. Numerous
food safety issues have occurred recently[2], promoting
the demand for traceability and transparency in foodstuffs,
and thus, for tools applied in effective tracing and quality
control from harvest to storage, and finally to transport[3].
To enable better tracking and tracing of agricultural food
products, many countries have introduced stricter
regulations and smarter industrial development
strategies[4-6]. As an effective means to ensure food
safety, a tracing system can effectively realize traceability
system, identity preservation (IP) is a key technology
during information flow to achieve the rapid and effective
identification of product information[8]. Ensuring IP in
grain traceability would increase consumers’ confidence
and provide an advantage in the market[9]. By marking
and labeling food grains in a way that ensures IP, when
agricultural product quality and safety incidents occur, it
is possible to trace the original agricultural products
rapidly and promptly, and the timely recall of substandard
agricultural products could reduce the losses suffered by
producers. Therefore, a tracing system with effective IP
is important for promoting food grain safety.
Local labeling and marketability from harvest to final
destination are necessary to ensure grain traceability
during transportation. However, associating unique and
accurate labels with these types of bulk products in order
to facilitate the direct identification of different lots is
difficult[10]. Grains such as wheat and corn have small
individual sizes but are handled in massive quantities.
Moreover, grain from various origins is typically mixed
according to its different uses and grades at multiple
points in the supply chain, making it impossible to
determine the point of origin[11]. To address this
problem, some iron pellets with radio-frequency
identification (RFID) technology were developed and
applied to achieve grain traceability in continuous grain
flows[12]. However, the use of RFID-based
identification technology in grain traceability requires
that it can be safely removed from the final product by
specific tracing devices. The high costs associated with
this process have limited its widespread application.
Subsequently, food-grade tracers, such as pill-sized
particles, were proposed as a safe and low-cost
identification technology for grain traceability, followed
by a series of studies on food grain tracers. The earliest
food-grade tracers were made of semolina using a pellet
mill. This tracer was 6 mm in length and 4 mm in
diameter, and it weighed 87 mg[13]. Food-grade tracers,
such as starch- or sugar-based pharmaceutical caplets
with a printed barcode on the surface, have been
developed. However, such starch-based tracers tend to
absorb water, and their hardness declines as more water is
absorbed, making them unsuitable for grain traceability
applications during storage and transport[14].
Subsequently, a coating solution was applied to cellulose-
and sugar-based tracers to prevent damage and moisture
absorption, and the effects of different types of tracers and coating materials on the tracers’ physical properties were assessed[15]. Based on that study, food-grade
tracers with a Data Matrix code printed on their surface
were developed. The ruggedness of the code on the
surface against abrasion and impact, as well as the effect
of moisture conditioning, was assessed[16,17].
In a grain tracing system, it is necessary to assess the
characterization of food-grade tracers in order to maintain
the shape of the food-grade tracer and to avoid damage to
the codes marked on the surface of a tracer. During the
processes of harvesting, transportation, drying and
storage, the food-grade tracers will be compressed by the
load and can be deformed or even broken. Some
researchers have investigated grains’ mechanical
characteristics to avoid damage during harvesting,
handling, grading, and transporting[18-20]. Food-grade
tracers also experience damage and friction during grain
storage and transportation. Production process
parameters will affect the mechanical characteristics of
tracers and, thereby, the subsequent coating and printing
process. However, little research has been devoted to
assessing the effects of the production process parameters
on the characterization of food-grade tracers. The
food-grade grain tracers are generally made through a
procedure involving compression, coating and printing.
Direct compression is a simple and efficient method for
compacting the premixed excipient directly to produce
tracers[15]. Coating tracers with materials such as edible
shellac and hydroxypropyl methylcellulose can improve
their surface characteristics and minimize mechanical
damage[15]. During printing, a readable code with
traceability information is marked on the surface of
tracers by an ink jet printer[16,17]. Among these three
procedures, the compressing process has the most
important effect on the mechanical characteristics of the
tracers. In this process, the pressure of the tablet press
machine and the formulation are the main factors that
affect the mechanical characteristics of the tracers.
November, 2017 Liang K, et al. Optimization of compression formulation and load for grain traceability Vol. 10 No.6 223
used in formulations, and its concentration also impacts
the mechanical properties of the compressed tablets.
Therefore, in this work, we investigated the
influences of tracer production process parameters (i.e.,
direct compressible formulation and compression load)
on the impact characteristics (i.e., the breaking rate),
compression characteristics (i.e., the peak shear force)
and frictional characteristics (i.e., the friction coefficient)
of food-grade tracers. The response surface
methodology with a central composite design (CCD)
approach was used to establish the relationship between
the response of the tracer characteristics measured and the
optimized pressure level and magnesium stearate content
in the formulation. This research provides a reference
for low-cost, environmentally adaptable and easily
applied production technologies for the development of
food-grade tracers in grain supply chains.
2 Materials and methods
2.1 Materials
The excipient selection for a direct compression
formulation was performed based on the powder
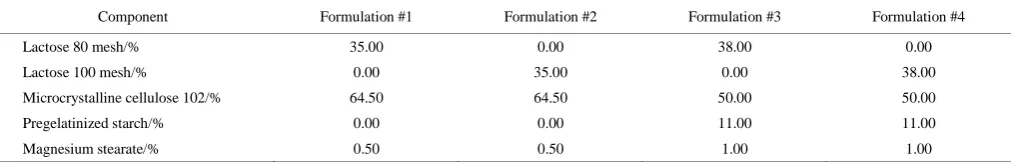
characteristics[21]. Table 1 shows the four types of
powder formulations, each of which consists of a
mixture of three or four of the following powders:
microcrystalline cellulose 102, pregelatinized starch,
and magnesium stearate (Anhui Sunhere Pharmaceutical
Excipients Co., Ltd., China), as well as lactose 80 mesh
and lactose 100 mesh (Zhenjiang Kangfu Biological
Engineering Co., Ltd., China). A sample of each type
of formulation (approximately 100 g) was mixed with a
trough-type mixer (CH10, Tianfeng Pharmaceutical
Machinery Co., Ltd., Shanghai, China) for 0.5 h. The
powder characteristics (i.e., the angle of repose, angle of
spatula, compressibility, uniformity and flowability
index) of the four types of mixed powder were
determined by an intelligent powder physical property
tester (BT-1001, Dandong Bettersize Instruments Ltd.,
Dandong, China). The two formulations with the
highest flowability index also had the best powder
flowability and therefore were selected for the following
optimization experiments.
Table 1 Four grain tracer formulations
Component Formulation #1 Formulation #2 Formulation #3 Formulation #4
Lactose 80 mesh/% 35.00 0.00 38.00 0.00
Lactose 100 mesh/% 0.00 35.00 0.00 38.00
Microcrystalline cellulose 102/% 64.50 64.50 50.00 50.00
Pregelatinized starch/% 0.00 0.00 11.00 11.00
Magnesium stearate/% 0.50 0.50 1.00 1.00
2.2 Tracer production
Each selected formulation (without magnesium
stearate) was mixed thoroughly using the trough-type
mixer for 15 min and then mixed again for 3 min after
adding magnesium stearate in different proportions. The
total weight of each formulation powder was 1000 g. A
rotary tablet press (ZPS8, Shanghai Tianxiang Chentai
Pharmaceutical Machinery Co., Ltd., Shanghai, China)
was used to compress the two tracer formulations. The
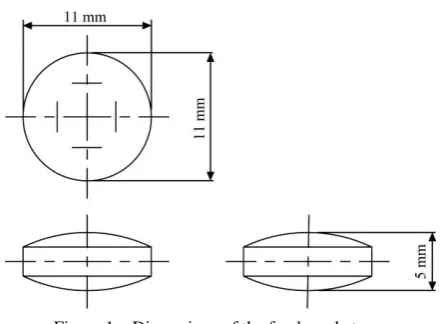
tracers were designed to be round particles so that they
would be appropriate for printing QR codes on the
surface in the future. The tracers were 11 mm in
diameter and 5 mm in thick (Figure 1). The pressure of
the tablet press machine is an important factor affecting
the properties of grain tracers, which include the hardness
of the tracers. In general, the greater the pressure is, the
stronger and harder the tablet is[22]. Currently, in the
tablet manufacturing process, the pressure for tablet
production is dynamic, and measuring the pressure is
difficult. In addition, the pressure will change when
using different equipment, different tablet formulations
and different tablet thicknesses. To adjust the pressure
in the production process, Sacchetti et al.[23] adjusted the
pressure of the tablet machine to ensure the appropriate
hardness value. A tablet hardness tester (YPD-300D,
Shanghai Huanghai Medicine Checking Instrument Co.,
Ltd., Shanghai, China) was used to indirectly measure the
average pressure. The pressure of the tablet press was
constantly adjusted, and the hardness of the tablet was
measured by the hardness tester until the hardness of the
tablet reached the required pressure. To maintain a
to ensure that the hardness of tablet did not fluctuate by
more than 1 kgf.
Figure 1 Dimensions of the food-grade tracer 2.3 Tracer characterizationtest
2.3.1 Breaking rate determination
The breaking rate of the grain tracers was estimated
using 100 tracer samples by counting the number of
damaged tracers after an impact test. Tracer samples
were dropped from a 17-m high stairwell onto a concrete
surface and then collected to determine the number of
damaged tracers and calculate the breaking rate by
Equation (1):
1
1 100%
N Y
N
(1)
where, N1 is the number of cracked samples after the
impact test; N is the total number of tracer samples, and
Y1 is the breaking rate.
2.3.2 Peak shear force determination
A shear test was conducted using a texture analyzer
(TMS-PRO, Food Technology Corporation, USA) to
measure the shear force of the food-grade tracer samples.
A CA-1 single blade shear cell was fitted to a texture
analyzer equipped with a 1000 N load cell. The trigger
force was 0.5 N. Each sample was subjected to a test
speed of 30 mm/min and a post-test speed of 80 mm/min.
The peak shear force was calculated automatically by the
software associated with the equipment based on the
force-displacement plot. For each treatment in the
experimental design, twenty independent measurements
were performed according to American Society of
Agricultural Engineers (ASAE) standard S368[24], and the
average value was determined.
2.3.3 Friction coefficient determination
Predicting the friction coefficients of grains, forage
materials, and other agricultural products on wood, metal
and other structural surfaces is necessary for harvesting,
storing and transporting, etc.[25]. As described by Yang
et al.[26], the experimental setup to measure the dynamic
coefficients of friction between food-grade tracers and
wheat was a coefficient of friction tester (MXD-01,
Labthink Instruments Co., Ltd., Jinan, China). A single
layer of wheat grain was evenly fixed on one side of a
double-sided foam adhesive, and the other side was fixed
on the test bench of the friction coefficient meter. Three
tracers were placed into the grooves of the customized
slider, ensuring that the wheat was in contact with the
tracers. The slider was driven by a traction device to
slide at a constant speed of 100 mm/min over the surface
of the wheat. Each experiment was repeated three times,
and the average value was calculated.
2.4 Experimental design and statistical analysis
The pressure and magnesium stearate ratio in the
formulation are the important factors during the
production process that affect the performance of
food-grade tracers. Pressure will affect the tablet
appearance[27]: the greater the pressure, the smoother and
more solid the tracers, thereby providing better
mechanical properties, such as impact, compression, and
frictional characteristics. As a commonly used lubricant,
magnesium stearate can improve the flowability of
powders[28] and smooth the tracers. However,
increasing the concentration of magnesium stearate will
also affect the tensile strength of the tablets[29]. Thus,
the magnesium stearate ratio has a significant influence
on the mechanical characteristics of tracers. Optimizing
the pressure and magnesium stearate ratio can afford
tracers with better mechanical properties.
The CCD of RSM was used to analyze and optimize
the two factors (i.e., the magnesium stearate ratio (X1) and
the pressure (X2)) (Table 2). The impact, compression
and frictional characteristic parameters of the breaking
rate (Y1), peak shear force (Y2) and friction coefficient
(Y3), respectively, were dependent variables. A
generalized linear model with a binomial response
distribution was employed, as shown in Equation (2):
2 2
0 1 1 2 2 11 1 22 2 12 1 2
November, 2017 Liang K, et al. Optimization of compression formulation and load for grain traceability Vol. 10 No.6 225
where, Y is the response; X1 and X2 are the variables; b0 is
the constant; b1 and b2 are the coefficients of the linear
terms; b11 and b22 are the coefficients of the quadratic
terms, and b12 is the coefficient of the interaction terms.
According to the CCD, thirteen treatments were
conducted (Table 5). Statistical analysis and regression
models were performed with the help of the Design
Expert package (Version 8.0.6, Stat-Ease, Inc.,
Minneapolis, MN, USA).
Table 2 Independent variables and their levels for CCD
Variables Symbol
Levels
–α –1 0 1 α
Magnesium stearate
ratio/% X1 0.59 1.00 2.00 3.00 3.41
Pressure/kgf X2 3.93 6.00 11.00 16.00 18.07
3 Results and discussion
3.1 Powder physical property measurements
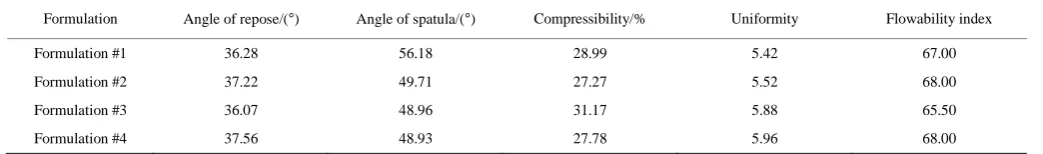
Table 3 shows the powder physical properties
measured for the four types of formulations. Powder
flowability was evaluated using Carr’s flowability index,
which was calculated using the angle of repose, angle of
spatula, compressibility and uniformity[30]. Four tests
were conducted to measure the angle of repose, angle of
spatula, compressibility and uniformity for the four
formulations. Each examination was assigned 25 scores,
and the flowability index was then calculated using the
point scores out of 100[31]. A point in the range of ‘90-100’ represents ‘excellent’ flowability, ‘80-89’ represents ‘good’ flowability, ‘70-79’ represents ‘fair’
flowability, ‘60-69’ represents ‘passable’ flowability, ‘40-49’ represents ‘poor’ flowability, ‘20-39’ represents ‘very poor’ flowability, and ‘0-19’ represents ‘extremely poor’ flowability[32]. All four formulations had passable
powder flowability. Higher values of Carr’s flowability
index reflected better flowability[33]. Therefore,
Formulations #2 and #4 had the best powder flowability,
and they were used in the following experiments.
Table 3 Flowability indexes of the four types of food-grade tracer formulations
Formulation Angle of repose/(°) Angle of spatula/(°) Compressibility/% Uniformity Flowability index
Formulation #1 36.28 56.18 28.99 5.42 67.00
Formulation #2 37.22 49.71 27.27 5.52 68.00
Formulation #3 36.07 48.96 31.17 5.88 65.50
Formulation #4 37.56 48.93 27.78 5.96 68.00
3.2 Results of CCD experimental design
As a frequently used lubricant, magnesium stearate is
applied to improve the quality and production efficiency
of tablets using the direct powder compression method[34];
however, its use can lead to issues such as reduced tracer
hardness. The formulations were slightly changed by
altering the magnesium stearate ratio in order to evaluate
the effect of the magnesium stearate concentration on the
impact characteristics (the breaking rate), compression
characteristics (the peak shear force) and frictional
characteristics (the friction coefficient) of food-grade
tracers. The levels of magnesium stearate in
Formulations #2 and #4 are shown in Table 4. The
characteristics of the grain tracers of Formulations #2 and
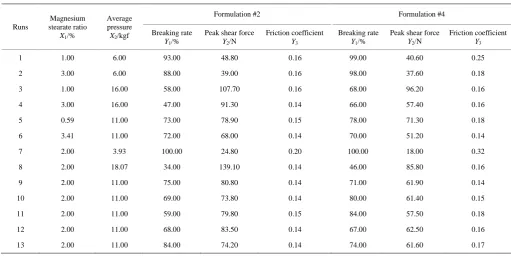
#4 subjected to 13 sets respectively are listed in Table 5.
For Formulation #2, the breaking rate varied from
34.00% to 100.00%, the peak shear force ranged from
24.80 N to 139.10 N, and the friction coefficient varied
from 0.14 to 0.20. For Formulation #4, the breaking rate
varied from 46.00% to 100.00%, the peak shear force
ranged from 18.00 N to 96.20 N, and the friction
coefficient varied from 0.14 to 0.32.
3.3 Establishment of regression models
Based on the design and results of the CCD tests
shown in Table 5, Design Expert software was used to fit
the regression models of the breaking rate, peak shear
force and friction coefficient for Formulations #2 and #4.
The regression equations are listed in Table 6.
Analysis of variance (ANOVA) was used to analyze
the models for significance and the suitability of the
terms. The p-values, coefficients of determination (R2),
adjusted R2 values and adequate precisions of all the
response models are shown in Table 7. For Formulation
#2, the p-value of the friction coefficient (Y3) was 0.0148,
whereas those of the others (Y1, Y2) were less than 0.01.
and the others were extremely significant at a 95%
confidence level. Values of R2 exceeding 0.8 indicated
that the models of the breaking rate (Y1), peak shear force
(Y2) and friction coefficient (Y3) fitted the experimental
results well. The adequate precisions of the models
were greater than 4, indicating that the models were all
adequate. For Formulation #4, the p-values were all less
than 0.01, revealing that the models of the breaking rate
(Y1), peak shear force (Y2) and friction coefficient (Y3)
were extremely significant at a 95% confidence level.
The R2 values exceeded 0.8, and the adequate precision
values were greater than 4. The regression models of
the breaking rate (Y1), peak shear force (Y2) and friction
coefficient (Y3) for Formulation #4 were all adequate.
Table 4 Compositions and proportions of Formulations #2 and #4 at different magnesium stearate ratios
Component
Magnesium stearate ratio (X1)
–α –1 0 1 α
Formulation #2
Magnesium stearate/% 0.59 1.00 2.00 3.00 3.41
Lactose 100 mesh/% 35.00 34.00 33.00 34.00 32.00
Microcrystalline cellulose 102/% 64.41 65.00 65.00 63.00 64.59
Formulation #4
Magnesium stearate/% 0.59 1.00 2.00 3.00 3.41
Lactose 100 mesh/% 38.00 38.00 37.50 36.00 36.00
Microcrystalline cellulose 102/% 50.41 50.00 49.50 50.00 49.50
Pregelatinized starch/% 11.00 11.00 11.00 11.00 11.00
Table 5 Experimental design and results for Formulations #2 and #4
Runs
Magnesium stearate ratio
X1/%
Average pressure
X2/kgf
Formulation #2 Formulation #4
Breaking rate
Y1/%
Peak shear force
Y2/N
Friction coefficient
Y3
Breaking rate
Y1/%
Peak shear force
Y2/N
Friction coefficient
Y3
1 1.00 6.00 93.00 48.80 0.16 99.00 40.60 0.25
2 3.00 6.00 88.00 39.00 0.16 98.00 37.60 0.18
3 1.00 16.00 58.00 107.70 0.16 68.00 96.20 0.16
4 3.00 16.00 47.00 91.30 0.14 66.00 57.40 0.16
5 0.59 11.00 73.00 78.90 0.15 78.00 71.30 0.18
6 3.41 11.00 72.00 68.00 0.14 70.00 51.20 0.14
7 2.00 3.93 100.00 24.80 0.20 100.00 18.00 0.32
8 2.00 18.07 34.00 139.10 0.14 46.00 85.80 0.16
9 2.00 11.00 75.00 80.80 0.14 71.00 61.90 0.14
10 2.00 11.00 69.00 73.80 0.14 80.00 61.40 0.15
11 2.00 11.00 59.00 79.80 0.15 84.00 57.50 0.18
12 2.00 11.00 68.00 83.50 0.14 67.00 62.50 0.16
13 2.00 11.00 84.00 74.20 0.14 74.00 61.60 0.17
Table 6 Response values corresponding to the regression equations
Response value (Y) Regression equation
Formulation #2
Y1/% Y1 112.50903 3.62678 X12.25845X20.30000X X1 21.18750X120.062500X22
Y2/N Y2= 8.12594 14.36813 X1+7.24792X20.33000X X1 23.98500X12+0.010600X22
Y3 Y3=+0.22561+3.23223 10-3X1 0.012391X2 1.00000?10-3X X1 2+8.75000 10-4X12+5.35000?104X22
Formulation #4
Y1/% Y1=+128.72300 8.08921 X14.45119X20.050000X X1 2+1.71250X12+0.048500X22
Y2/N Y2=26.34144+8.99679X1+11.55479X21.79000X X1 2+0.47875X120.16785X22
Y3 Y3=+0.52709 0.041821X1 0.047857X2+3.50000?10-3X X1 2 3.12500?103X12+1.47500 10-3X22
November, 2017 Liang K, et al. Optimization of compression formulation and load for grain traceability Vol. 10 No.6 227
Table 7 ANOVA results of Formulations #2 and #4 regarding the adequacy of the regression models
Responses p-value R2 Adj-R2 Adeq Precision
Formulation #2
Y1 0.0023 0.8988 0.8265 11.483
Y2 0.0002 0.9529 0.9192 17.198
Y3 0.0148 0.8217 0.6944 8.337
Formulation #4
Y1 0.0060 0.8645 0.7677 9.731
Y2 <0.0001 0.9804 0.9665 29.696
Y3 0.0022 0.9001 0.8288 11.458
3.4 Response surface analysis of grain tracer
properties
3.4.1 Property analysis of Formulation #2
The mutual interaction effects of the magnesium
stearate ratio and pressure on the grain tracer properties
of Formulation #2 can be seen on the three-dimensional
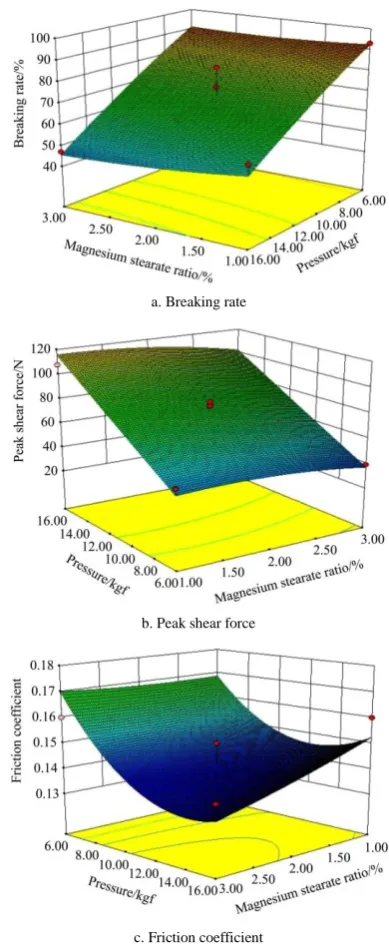
(3D) response surface plots in Figure 2. Figure 2a
depicts the effects of the interaction between the
magnesium stearate ratio and pressure on the breaking
rate. The pressure significantly affected the breaking
rate. Additionally, increasing the pressure resulted in a
linear increase in the breaking rate, which might be
explained by the powder being compacted more firmly as
the pressure increased. The binding force of the powder
was enhanced, the ability to resist external force
increased, and thus, the breaking rate decreased. The
magnesium stearate ratio exerted a slight effect on the
breaking rate. The breaking rate of food-grade tracers
gradually decreased as the magnesium stearate
concentration increased.
Figure 2b reveals the effects of the magnesium
stearate ratio and pressure on the peak shear force of
food-grade tracers. The peak shear force was observed
to increase as the pressure increased. According to Lee
et al.[14], high pressure can lead to tightly compact tracer
structures and increased shearing forces. The peak shear
force was negatively correlated with the magnesium
stearate concentration, and it decreased slightly as the
magnesium stearate concentration increased.
The effects of the magnesium stearate ratio and
pressure on friction coefficient are presented in Figure 2c.
The friction coefficient decreased as the pressure
increased until approximately 13.00 kgf. This behavior
may be attributable to the fact that higher pressure
increases the smoothness of the tracer[27], leading to a
decrease in the friction coefficient. The friction
coefficient tended to increase when pressure exceeded
13.00 kgf. In contrast, the magnesium stearate ratio was
negatively related to the friction coefficient at pressures
of 11.00-16.00 kgf. One explanation is that magnesium
stearate has good lubricity and acts to smooth the surface
of the tracer, thereby reducing the friction coefficient.
a. Breaking rate
b. Peak shear force
c. Friction coefficient
3.4.2 Property analysis of Formulation #4
The mutual interaction effects of the magnesium
stearate ratio and pressure on the grain tracer properties
of Formulation #4 can be seen on the 3D response surface
plots in Figure 3. The effects of the magnesium stearate
concentration and pressure on the breaking rate are
presented in Figure 3a. The pressure significantly
influenced the breaking rate of Formulation #4, as the
same manner observed from Formulation #2. The
breaking rate decreased linearly as the pressure increased
and decreased slowly as the magnesium stearate
concentration increased.
a. Breaking rate
b. Peak shear force
c. Friction coefficient
Figure 3 Effects of the magnesium stearate ratio and pressure on the physical properties of grain tracers of Formulation #4
Figure 3b reveals the effects of the magnesium
stearate ratio and pressure on the peak shear force. The
peak shear force increased sharply as the pressure
increased while the magnesium stearate ratio ranged from
1.00% to 2.00%. Additionally, the magnesium stearate
ratio did not affect the peak shear force significantly at
pressures of 6.00-10.00 kgf. However, when the
pressure exceeded 10.00 kgf, the peak shear force
decreased as the magnesium stearate ratio increased.
Figure 3c shows the effects of the magnesium stearate
ratio and pressure on the friction coefficient. The
friction coefficient decreased as the pressure increased,
but this tendency diminished when the pressure reached
approximately 12.00 kgf and then tended to increase.
When the pressure ranged from 6.00 kgf to 11.00 kgf, the
friction coefficient decreased as the magnesium stearate
ratio increased. However, when the pressure exceeded
11.00 kgf, the friction coefficient exhibited no obvious
change as the magnesium stearate ratio increased.
3.5 Optimization response and verification test
The aim of this investigation was to determine the
optimal process parameters required to achieve better
tracer characteristics. The optimization process was
conducted using Design Expert software, assigning constraints ‘in the range’ for independent variables, ‘minimized’ for the breaking rate and friction coefficient responses, and ‘maximized’ for the peak shear force. The optimal conditions recommended by the software
were a magnesium stearate ratio of 2.25% and a pressure
of 16.00 kgf for Formulation #2. The optimal
Formulation #2 was adjusted to 33.00% lactose
100 mesh, 64.75% microcrystalline cellulose 102 and
2.25% magnesium stearate. Under the optimal
conditions, the breaking rate 47.42%, peak shear force
110.82 N, and friction coefficient 0.140 were obtained.
For Formulation #4, the optimal conditions were found
to be a magnesium stearate ratio of 1.02% and a
pressure of 16.00 kgf, in which case the breaking rate
was 62.63%, the peak shear force was 96.00 N, and the
friction coefficient was 0.150. The optimal
Formulation #4 was adjusted to 38.00% lactose
100 mesh, 49.98% microcrystalline cellulose 102,
November, 2017 Liang K, et al. Optimization of compression formulation and load for grain traceability Vol. 10 No.6 229
stearate. Confirmation experiments were performed
under the optimal conditions to verify the accuracy of
the models. The experimental and predicted values are
tabulated in Table 8. Comparing the experimental and
predicted results revealed that they were relatively
similar, indicating that the models were highly reliable.
This optimization study revealed the pressure and
formulation suitable for food-grade tracer production
and can serve as a reference for the study and
application of the tracing system.
Table 8 Comparison of the predicted and experimental values of the responses
Responses
Formulation # 2 Formulation # 4
Predicted Experimental Error Predicted Experimental Error
Breaking rate/% 47.42 43.00 0.1027 62.63 55.00 0.1387 Peak shear force/N 110.82 104.00 0.0656 96.00 88.20 0.0884 Friction coefficient 0.140 0.133 0.0526 0.150 0.157 0.0446
Analyzing the experimental results showed that the
values of the breaking rate and friction coefficient were
smaller and that the values of the peak shear force of
Formulation #2 were larger than those of Formulation #4.
Therefore, Formulation #2 is more suitable for grain
tracer production.
4 Conclusions
This study evaluated the effects of production
parameters on the impact, compression, and frictional
characteristics of food-grade tracers and optimized the
process using the CCD of RSM. Among the four
formulations, Formulations #2 (consisting of 35.00%
lactose 100 mesh, 64.50% microcrystalline cellulose 102
and 0.50% magnesium stearate) and #4 (consisting of
38.00% lactose 100 mesh, 50.00% microcrystalline
cellulose 102, 11.00% pregelatinized starch and 1.00%
magnesium stearate) were selected for subsequent
optimization experiments because of their superior
flowability compared to the other formulations tested.
Empirical mathematical models relating the magnesium
stearate ratio and pressure to the responses of the
breaking rate, peak shear force and friction coefficient
were established. The optimal production conditions of
food-grade tracers were found to be a magnesium stearate
ratio of 2.25% and pressure of 16.00 kgf for Formulation
#2 and a magnesium stearate ratio of 1.02% and pressure
of 16.00 kgf for Formulation #4. Under the optimal
conditions, Formulation #2 consisted of 33.00% lactose
100 mesh, 64.75% microcrystalline cellulose 102 and
2.25% magnesium stearate, and Formulation #4 consisted
of 38.00% lactose 100 mesh, 49.98% microcrystalline
cellulose 102, 11.00% pregelatinized starch and 1.02%
magnesium stearate. The experimental response values
were extremely close to the predicted values obtained
from the fitted mathematic models. The experimental
results also showed that Formulation #2 was more
suitable for grain tracer production than Formulation #4
because of its superior characteristics.
Acknowledgments
This work was supported by the National Natural
Science Foundation of China (31401610), the
Fundamental Research Funds for the Central Universities
of China (KJON201557), the Outstanding Youth
Foundation Science and Technology Fund of College of
Engineering at Nanjing Agricultural University
(YQ201603), and the Jiangsu Agriculture Science and
Technology Innovation Fund (CX(16)1059).
[References]
[1] Zhu H, Jackson P, Wang W. Consumer anxieties about food grain safety in China. Food Control, 2017; 73: 1256–1264.
[2] Aung M M, k Chang Y S. Traceability in a food supply chain: Safety and quality perspectives. Food Control, 2014; 39: 172-184.
[3] Wang X, He Q, Matetic M, Jemric T, Zhang X. Development and evaluation on a wireless multi-gas-sensors system for improving traceability and transparency of table grape cold chain. Computers and Electronics in Agriculture, 2017; 135: 195–207.
[5] Can-Trace. Can-Trace develops traceability standards for all food products sold in Canada. www.can-trace.org. 2003. Accessed on [2017-05-21].
[6] EU. (EC) No. 178/2002 of the european parliament and of the council of 28 January 2002. Official Journal of the European Communities, 2002; L31: 1-24.
[7] Ceruti F C, Lazzari S, Lazzari F A. Traceability in the wheat production chain. 9th International Working Conference on Stored Product Protection, 2006; pp.1198-1205. [8] Lee K M, Armstrong P R, Thomasson J A, Sui R X, Casada
M, Herrman T J. Application of binomial and multinomial probability statistics to the sampling design process of a global grain tracing and recall system. Food Control, 2011; 22(7): 1085–1094.
[9] Herrman T J. White paper on traceability in the U. S. grain and plant protein feed ingredient industries.
[10] Comba L, Belforte G, Dabbene F, Gay P. Methods for traceability in food production processes involving bulk products. Biosystems Engineering, 2013; 116(1): 51–63. [11] Thakur M, Hurburgh C R. Framework for implementing
traceability system in the bulk grain supply chain. Journal of Food Engineering, 2009; 95(4): 617–626.
[12] Kvarnström B, Bergquist B, Vännman K. RFID to improve traceability in continuous granular flows—An experimental case study. Quality Engineering, 2011; 23(4): 343–357. [13] Hirai Y, Schrock M D, Oard D L, Herrman T J. Delivery
system of tracing caplets for wheat grain traceability. Applied Engineering in Agriculture,2006; 22(5): 747–750. [14] Sui R X, Thomasson J A, Herrman T. Development of
tracers for grain tracing system. Asabe Annual International Meeting, 2007.
[15] Lee K M, Armstrong P R, Thomasson J A, Sui R X, Casada M, Herrman T J. Development and characterization of food-grade tracers for the global grain tracing and recall system. Journal of Agricultural and Food Chemistry, 2010; 58(20): 10945–10957.
[16] Liang K, Thomasson J A, Lee K M, Shen M X, Ge Y, Herrman T J. Printing data matrix code on food-grade tracers for grain traceability. Biosystems Engineering, 2012; 113(4): 395–401.
[17] Liang K, Thomasson J A, Shen M X, Armstrong P R, Ge Y, Lee K M, et al. Ruggedness of 2D code printed on grain tracers for implementing a prospective grain traceability system to the bulk grain delivery system. Food Control, 2013; 33(2): 359–365.
[18] Kamst G F, Bonazzi C, Vasseur J, Bimbenet J J. Effect of deformation rate and moisture content on the mechanical properties of rice grains. Transactions of the ASAE, 2002; 45(1): 145–151.
[19] Güzel E, Akçalı İ D, İnce A. Behavior of peanut bulk under static loads. Journal of Food Engineering, 2007; 80(2): 385–390.
[20] Subramanian S, Viswanathan R. Bulk density and friction coefficients of selected minor millet grains and flours. Journal of Food Engineering, 2007; 81(1): 118–126.
[21] Sanghvi P P, Collins C C, Shukla A J. Evaluation of Preflo modified starches as new direct compression excipients. I. Tabletting characteristics. Pharmaceutical Research, 1993; 10(11): 1597–1603.
[22] Zhang Y L, Law Y, Chakrabarti S. Physical properties and compact analysis of commonly used direct compression binders. AAPS PharmSciTech, 2003; 4(4): 489-499. [23] Sacchetti M, Teerakapibal R, Kim K, Elder Jr E J. Role of
water sorption in tablet crushing strength, disintegration, and dissolution. AAPS Pharmscitech, 2017; 1–13.
[24] ASAE Standard. Compression test of food materials of Convex Shape. ASAE S368.4 DEC2000, 2008.
[25] Shafaei S M, Nourmohamadi-Moghadami A, Kamgar S. Analytical study of friction coefficients of pomegranate seed as essential parameters in design of post-harvest equipment. Information Processing in Agriculture, 2016; 3(3): 133–145. [26] Yang Z M, Guo Y M, Cui Q L, Li H B. Test and influence factors analysis of friction characteristics of millet. Transactions of the CSAE, 2016; 32(16): 258–264. (in Chinese)
[27] Matsumoto R, Kawakami K, Aoki S. Impact of compression pressure on tablet appearance. International Journal of Pharmaceutics, 2007; 341(1-2): 44-49.
[28] Faqih A M N, Mehrotra A, Hammond S V, Muzzio F J. Effect of moisture and magnesium stearate concentration on flow properties of cohesive granular materials. International Journal of Pharmaceutics, 2007; 336(2): 338-345.
[29] Iranloye T, Parrott E. Effects of compression force, particle size, and lubricants on dissolution rate. J Pharm Sci., 1978; 67(4): 535-539.
[30] Ganesan V, Rosentrater K A, Muthukumarappan K. Physical and flow properties of regular and reduced fat distillers dried grains with solubles (DDGS). Food and Bioprocess Technology, 2009; 2(2): 156–166.
[31] Carr R. Evaluating flow properties of solids. Chem. Eng., 1965; 72(2): 163–168.
[32] Otsuka T, Iwao Y, Miyagishima A, Itai S. Application of principal component analysis enables to effectively find important physical variables for optimization of fluid bed granulat or conditions. International Journal of Pharmaceutics, 2011; 409(1-2): 81-88.
[33] Sakurai Y, Mise R, Kimura S, Noguchi S, Iwao Y, Itai S. Novel method for improving the water dispersibility and flowability of fine green tea powder using a fluidized bed granulator. Journal of Food Engineering, 2017; 206: 118–124. [34] Nakamura S, Yamaguchi S, Hiraide R, Iga K, Sakamoto T,