Numerical simulation and experimental study on eggshell membrane
separation device
Yuan Chi
1*,
Yong Wang
1,
Mengfu Li
1,
Jie Ren
1,
Yujie Chi
2(1. College of Engineering, Northeast Agricultural University, Harbin 150030, China; 2. College of Food Science, Northeast Agricultural University, Harbin 150030, China)
Abstract: In order to provide theoretical guidance for separating egg membrane from eggshell by using mechanical agitation, CFD was used to explore the flow characteristics in stirred tank, using the Sliding Grid method to deal with the impeller rotational velocity zone in flow field, and using the Euler model to deal with liquid-solid two-phase flow. This study explored the influence of dish-shape bottom or flat-shape bottom, the clearance size between baffle and the side wall, and the axial height of impeller to bottom on suspension state of particles, solids holdup distribution, solid phase velocity and power number by CFD. Simulation results showed that better particles suspension effect in dish-shape tank can reduce particles accumulation at the bottom and power consumption. If there was a small clearance size (S) between the baffle and the side wall of the stirred tank, it would reduce particles accumulation at the bottom, and reduce the power consumption. However, too large S would decrease the suspension height of particles, not only cannot strengthen the main flow, but also lead to most fluid through clearance forming tangential flow, simulation results showed that S=6 mm was perfect. While decreased axial height of impeller (C) to bottom, particles accumulation at the bottom was decreased, but power consumption would increase, simulation results showed that C=H/5 (H is height of liquid surface) was perfect. According to the simulation results, the structure of the stirring tank was optimized. At the same time, the influences of stirring rotational velocity, stirring time, solid-liquid ratio and separating medium temperature on egg membrane recovery were also studied by experiment, and optimal parameter combination of factors was obtained. The experiment results showed while the stirring time was 17.1 min, stirring rotational velocity was 350 r/min, solid-liquid ratio was 1:17 g/mL, the separating medium temperature was 32°C, the membrane recovery rate can reach above 89%. The device improves the recovery and utilization of discarded eggshell, and provides a reference for the solid-liquid two-phase flow and related study.
Keywords: liquid-solid two-phase flow, mechanical stirring, field characteristics, eggshell membrane separation DOI: 10.25165/j.ijabe.20191202.3058
Citation: Chi Y, Wang Y, Li M F, Ren J, Chi Y J. Numerical simulation and experimental study on eggshell membrane separation device. Int J Agric & Biol Eng, 2019; 12(2): 173–183.
1 Introduction
Egg production of China ranked first in the world, at the same time, most of the eggshell was discarded. Eggshell contains the calcium carbonate and other inorganic substances that can be used as calcium source additive, etc. Egg membrane contains keratin, collagen protein, and other organic that can be used in biological, chemical, pharmaceutical and other aspects. If membrane can be separated from eggshell and be utilized respectively, the waste eggshell will have a great value[1-3]. The method of eggshell
membrane separation mainly include the physical and chemical methods. The low efficiency and high cost of chemical method is not suitable for industrial production[4,5]. In this paper, we used
the physical method to separate membrane from eggshell through mechanical agitation. There was little reference using this
Received date: 2017-10-29 Accepted date: 2018-12-16
Biographies: Yong Wang, MS candidate,research interests: fluid transmission and control, Email: [email protected]; MengfuLi, MS candidate, research interests: fluid transmission and control, Email: [email protected]; Jie Ren,
MS candidate, research interests: fluid transmission and control, Email: [email protected]; Chi Yujie, PhD, Professor, research interests: food science and engineering, Email: [email protected].
*Corresponding author: Yuan Chi, PhD, Associate Professor, research
interests: fluid transmission and control. College of Engineering Northeast Agricultural University, No.200, Changjiang Street, Xiangfang District, Harbin 150030, China. Tel: +86-18946164826, Emial: [email protected].
separation method which explored the characteristics of the solid-liquid two-phase flow in separation container. The suspension state of particles, solids holdup distribution, solid phase velocity and power number in the separation container have important influences on separating membrane from eggshell.
The capability and the reliability of these CFD-assisted methods were verified and discussed in order to find CFD methods which could be universally accepted and represent an objective design criterion to be applied to different configurations. Solid-liquid two-phase flow simulation can be easily dealt with by using the CFD model in the present work, which was found suitable for predicting the amount and position of suspended solid particles. Wadnerkar et al.[6] explored solid–liquid two phase
flow in stirred tanks from low to dense solid loading systems by CFD. Tamburini et al.[7] studied CFD simulations of dense
solid–liquid suspensions in baffled stirred tanks. Li et al.[8]
researched light density particle holdup distribution being effected by stirring rotational velocity, particle size and solid-holdup in stirred tank. Surprisingly, it was difficult to find synthetical study on particles suspension, distribution of solid phase velocity, distribution of solid holdup and power number in stirred tank.
distribution, solid phase velocity and power number by CFD. It provides a reference for the separating egg membrane from eggshell and related study.
2 Simulation study
2.1 Working conditions in simulation
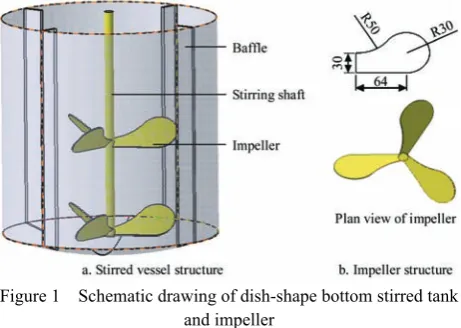
The structural parameters of the stirring tank were shown in Table 1. Schematic drawing of dish-shape bottom stirred tank and impeller were shown in Figure 1. The separating medium is water of which density ρl is 998 kg/m3, and dynamic viscosity μl is
0.001 Pa·s. Solid particles are eggshell particles of which density
ρs is 2500 kg/m3 and the range of the particle diameter size ds is
0.5-1.5 mm. Average solid-liquid ratio αs is 5%. Stirring
rotational velocity N is 200 r/min.
The structure of axial flow dual-impeller was adopted to enhance significantly turbulence intensity and was in favor of particles suspension[9]. Small angle to the horizontal which the
impeller was placed would reduce the overall axial velocity and turbulent kinetic energy, and have bad influence on particles suspension. Meanwhile, the large angle would increase power consumption dramatically. Therefore, the angle 45° has been selected according to the fluid simulation result while impeller was placed from 30° to 60°.
Figure 1 Schematic drawing of dish-shape bottom stirred tank and impeller
Table 1 Structural parameters in stirred tank
Item Value/mm
Item Value/mm
Height of the liquid surface/mm
H=250
Impeller number
n =3 Tank bottom shape
Dish-shape or flat-shape
Impeller diameter/mm
D =T/2 Stirred tank diameter/mm
T =340
Impeller thickness/mm
B=1.5 Baffle width/mm
W=T/10
Placed angle of impeller 45°
Distance between two layer impellers/mm
E =H/3 Clearance between baffle and side wall/mm
S= W/10
Distance between impeller and bottom/mm
C =H/5
2.2 Grid division
Modeling in Gambit used the Multiple Reference System (MRF) to solve the relative motion problem between the static zone and the stirring impeller rotation zone. In the modeling process, the stirred tank was divided into two regions, the cylindrical moving region including the stirring impeller, and the outer static region. A rotating coordinate system was adopted in the moving region and a vertical coordinate system was adopted in the static
region. The Interface between the two regions was used to exchange momentum, mass and energy. The stirred tank wall, the stirring impeller and the stirring shaft were set as wall boundary conditions, and the liquid surface was set as a free slip surface. The model was meshed by a tetrahedral unstructured mesh, and Tet/Hybrid (mainly in the form of a tetrahedral mesh, including a small number of hexahedrons, cones, and wedge meshes) was selected for the mesh generation after the grid number independence test. The total number of meshes used for simulation was 954 184 and the number of nodes was 1 845 627. 2.3 Control equation
There were two common methods to solve the multiphase flow model that were the Euler-Lagrange and the Euler-Euler. The Euler-Lagrange method ignored the interaction between particles, and even ignored the interaction between dispersed phase and continuous phase. Euler-Euler method provided three Euler-Euler multiphase flow models that were VOF, Mixture, and Euler model. Among them, the Euler model was the most complex model. Although being that, its calculation was more accurate than others. Yu Yong et al.[10] thought that Euler model was widely applied to
problems about accurate calculation of solid-liquid suspension and fluidized bed. Micale et al.[11] thought that the multiphase flow
model can simulate the solid-liquid two-phase flow well, reflect the relationship between suspension height and rotational velocity. Therefore, this paper used Euler model to study the flow characteristics of eggshell particles in stirred tank, in which the mass conservation equation was shown below:
Solid phase: ( s s) ( ) 0
s s s
t
u
∂ + ∇ =
∂
r
ρ α ρ α
(1)
Liquid phase: ( l l) ( ) 0
l l l
t
u
∂ + ∇ =
∂
r
ρ α ρ α
(2)
αs+αl=1 (3) where, t is flow time, s; ρs is solid phase density, kg/m3; ρl is liquid
phase density, kg/m3; α
sis solid phase holdup;αlis liquid phase
holdup;μsis solid phase fluid velocity, m/s; μl is liquid phase fluid
velocity, m/s; s is solid; l is liquid.
The momentum conservation equations are shown below: Liquid phase:
( l l l) ( )
l l l l l l ex l l
t
u u u p F g
∂ + ∇ ⋅ = − ∇ + ∇ ⋅ + +
∂ v
v v v
α ρ α ρ α τ α ρ
(4) Solid phase: ( ) ( )
s s s
s s s s s s s ex s s
s
u
u u p p F g
∂ + ∇ = − ∇ − ∇ + ∇ + +
∂
v v v
α ρ α ρ α τ α ρ
(5)
Particle impact shearing force:
2
( ) ( )
3
T
s= s s ∇ + ∇us us + s s− us ∇ ⋅us
v v v v
τ α μ α λ (6)
where, p is phase pressure, Pa; g is gravity acceleration, m/s2; k
ls is
two phases of liquid and solid drag coefficient; τsis particle shear
stress, Pa; λs is particle volume viscosity, Pa·s; μs is granular phase
shear viscosity, Pa·s; Fex is drag force.
Drag force was the most important interaction force between solid phase and liquid phase while the density ratio of solid to liquid ρs/ρl >2. In order to simplify the model calculation, drag
force was only used in this simulation, and the specific equation expression was in references[12,13].
2.4 Particle dynamic model
The relationship among particle shear stress τs, particle
took into account in particle dynamic model[14], so the particle
dynamic model was used to this simulation. Particle volume viscosity:
1/ 2
4
(1 ) ( ) 3
s= s s sd +e g°
θ
λ ρ α
π (7) Particle phase shear viscosity:
1/ 2
2
1 (1 )(3 1)
6(3 ) 5
4
(1 ) ( ) 5
s s s
s s
s s s
d
e e g
e
d e g
° ° ⎡ ⎤ = ⎢ + + − ⎥+ − ⎣ ⎦ +
ρ α θπ
μ α θ ρ α π (8) Particle pressure: 2
2 (1 )
s s s s s
p =α θd + α ρ +e g°θ (9)
where, θ is particle temperature; Е is particle collision coefficient; go is radial distribution function.
2.5 Flow model selection
The method of MRF (Multiple reference frame) was used to deal with the impeller rotational area in most of the references, because the treatment process of MRF was simple, it was suitable for steady flow field. The interaction relationship between impellers and baffle producing complex flow characteristics cannot be dealt well by MRF method. Comparing with the Sliding Grid method, some differences can be observed in flow field: in particular the simulation data were underestimated by the MRF simulation. Unsteady simulations were found to predict better the experimental data with respect to steady state simulations. Sliding Grid method was suitable for the unsteady state system with strong interaction between the impeller and the baffle. Ochieng et al.[15]
also pointed out that the unsteady model was used to predict well the solid-liquid suspension state and suspension height. Therefore, we used the Sliding Grid method and unsteady model to deal with flow field. The accuracy and convergence of standard turbulence model k-ε was not good, so the RNG k-ε turbulence model was adopted in this simulation[16-18].
2.6 Model initialization and boundary condition setting Particles were considered to be motionless on tank bottom and at their maximum packing volume fraction. The torque monitor window about impeller area was opened before calculation. While the final torque value had been basically no longer change, the flow field was considered to be stable.
For both phases no slip boundary conditions were assumed for all tank boundaries with the exception of the top surface where free slip conditions were imposed. Reynolds number of the side wall surface in stirred tank was relatively low, the effect of turbulent flow was not sufficient, and the intermolecular viscous force was larger, so the standard wall function can be used to solve the flow physical parameters. The interface was used to transfer mass, energy and momentum between dynamic and static regions. SIMPLE series algorithm was adopted in the coupling relationship between pressure and rotational velocity. The difference scheme of first order upwind and an implicit algorithm based on pressure were used in simulation.
3 Numerical simulation and analysis
3.1 Calculation parameters
Reynolds number (Re) can be obtained by the following equation: 2 Re 60 Nd =ρ
μ (10)
where, N is stirring rotational velocity, r/min; Ρ is medium density,
kg/m; D is impeller diameter, m; μ is dynamic viscosity, Pa·s. Power number (Np) is an important index to measure the turbulence state and the power consumption in the stirred tank.
3 5 60 P Np N d = ⎛ ⎞ ⎜ ⎟ ⎝ ⎠ ρ (11)
where, P is power, W; ρis medium density, kg/m3; N is stirring
rotational velocity, r/min; d is impeller diameter, m.
The stirring rotational velocity 200 r/min is adopted in simulation, and the Re of 200 r/min is 96 333>10 000, so the flow field was fully turbulent state. The power number is a constant and valid in the turbulent state. Therefore, the power consumption of stirring can be judged by the power number. 3.2 Influence of structure parameters of agitator on flow characteristics.
3.2.1 The influence of tank bottom structure on particles suspension, solid holdup, solid phase velocity and power number
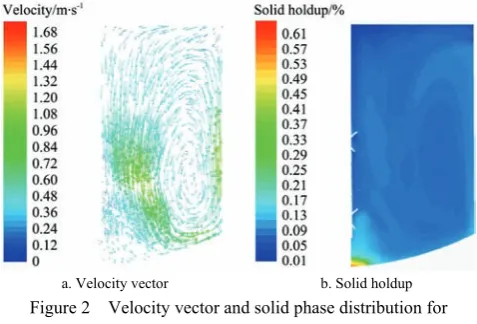
As shown in Figure 2, we can see the velocity vector and the solid phase distribution for dish-shape bottom stirred tank. The velocity vector was shown in Figure 2a, the whole flow field was axial type under the action of the impellers. The jet-flow generated by the lower impeller was inclined downwards, the majority of jet-flow moved radially to the side wall after they impacted bottom, and formed main circulation flow in the stirring tank. The minority of jet-flow would be back to the center of stirred tank and form vortex (dead zone), which was easy to cause particle accumulation at the bottom. The simulation results was in agreement with Ding et al.[19] that was six-bladed impeller in 2015.
The solid holdup distribution was shown in Figure 2b. Particles tracing was basically in agreement with velocity vectors.
a. Velocity vector b. Solid holdup Figure 2 Velocity vector and solid phase distribution for
dish-shape stirred tank
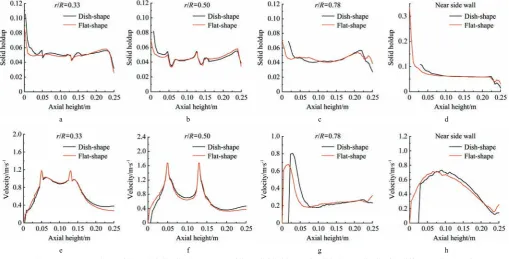
As it can be seen in Figures 3a-3d, the distribution curves of solid holdup and the solid phase velocity with flat-shape or dish-shape were compared. Figures 3a-3d were the axial distribution curves of solid holdup at different radial positions (Stirred rotational velocity N is 200 r/min, average solid holdup αs
is 5%, particle average diameter ds is 0.5 mm). The solid
seen that the increase amplitude of solid phase velocity of dish-shape was higher than flat-shape at the lower region of the axial height, which was favorable to particles suspension at the center of bottom and the position connecting bottom to the side wall. While the axial height was from middle region to upper
region, the solid phase velocity of dish-shape tank was slightly higher than that of flat-shape tank, which was favorable to particles suspension. The position connecting bottom to the side wall was easy to appear the vortex in flat-shape stirred tank, which was more likely to produce particles accumulation.
a b c d
e f g h Figure 3 Comparison of the axial distribution curves of the solid holdup and solid phase velocity for different stirred tank
The distribution of the solid holdup at the dish-shape bottom and flat-shape bottom were respectively shown in Figure 4. There was significantly particles accumulation at the center of bottom, at the no-facing water surface of baffles and at the edge of the flat-shape bottom.
a. Dish-shape bottom b. Flat-shape bottom Figure 4 Comparison of solid holdup distribution for different
stirred tank
Table 2 showed the torque and power number of impellers for two kinds of tank bottom structures. Compared to flat-shape stirred tank, the torque and power number of dish-shape stirred tank was small because the structure of dish-shape bottom was smoother than that of flat-shape stirred tank. So we chose the dish-shape stirred tank to simulate according to above analysis.
Table 2 Torque and power number for different tank
Bottom structure Impeller torque/N·m Power number
Flat-shape bottom 0.540 1.765
Dish-shape bottom 0.528 1.725
3.2.2 Effect of clearance size (S) from baffle to the side wall on particles suspension, solid holdup, solid phase velocity and power
number
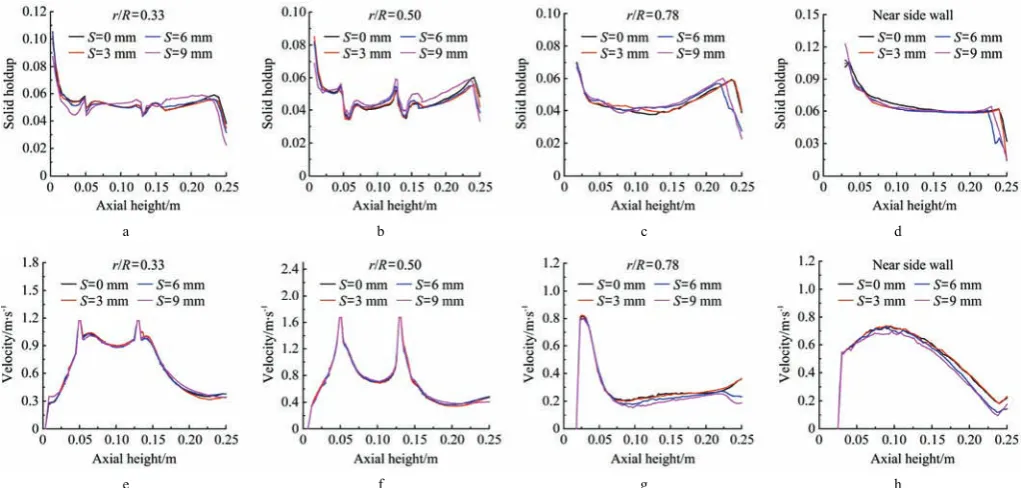
As shown in Figures 5a-5d, we can see the influence of the clearance size from baffle to the side wall in stirred tank on the axial distribution of the solid holdup at different radial positions (Stirred rotational velocity N is 200 r/min, average solid holdup αs
is 5%, particles average diameter size ds is 0.5 mm). The solid
holdup increased with the increase of S in the middle axial height, the result indicated that the uniformity of the solid holdup was increased. The solid holdup decreased with the increase of the S at the upper axial height, which indicated the suspension height of particles decreased with the increase of S. There was no obvious difference in other axial height.
Figures 5e-5g, and h showed the axial distribution curves of the solid phase velocity for different S. While the axial height was from lower region to middle region, there was no obvious difference. While the axial height was from middle to upper region, solid phase velocity decreased with the increase of S, which led to decrease the suspension height of particles, and the result was agreement with the axial distribution curves of the solid holdup.
As shown in Figure 6, we can clearly see that particles accumulation at bottom of stirred tank decreased with the increase of S.
Table 3 showed the torque and power number of impellers with different S. The simulation results showed that the power consumption of impellers decreased with the increase of S.
Table 3 Torque and power number of stirring for different S
Clearance/mm Impeller torque/N·m Power number
S=0 0.617 2.016
S=3 0.550 1.798
S=6 0.528 1.725
a b c d
e f g h Figure 5 Comparison of the axial distribution curves of the solid holdup and solid phase velocity for different S
a. Clearance S=0 mm b. Clearance S=3 mm c. Clearance S=6 mm d. Clearance S=9 mm Figure 6 Comparison of solid holdup distribution of bottom for different S
3.2.3 Influence of axial height of impeller© on particles suspension, solid holdup, solid phase velocity and power number
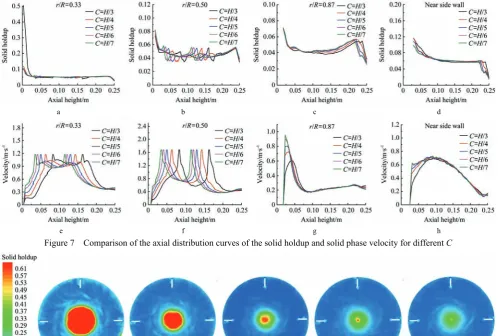
Figures 7a-7d showed the influence of C on the axial distribution of the solid holdup at different radial positions (Stirred rotational velocity N is 200 r/min, average solid holdup αs is 5%,
particles average diameter size ds is 0.5 mm). As shown in Figure
7a, b, there were maximum and minimum points of solid holdup in the vicinity of the impellers, which the position decreased with decrease of C. As shown in Figure 7c, while the radial position r/R was 0.78, the axial height was middle region, the solid holdup increased with decrease C, which was favorable to uniformity of the solid holdup in stirred tank. There was no obvious difference in other position.
Figures 7e-7h showed the influence of C on axial distribution curves of the solid phase velocity. As shown in Figures 7e and 7f, axial height was the position of impeller, the position of maximum point of solid phase velocity decreased with decrease of C. What’s more, solid phase velocity increased with decrease of C in the lower axial height, which was favorable to particles suspending at the center of bottom and at the edge of the bottom.
Figure 8 showed the distribution of the solid holdup at the bottom of the tank. It can be clearly seen that the particles accumulation at the central region of the bottom decreased with the decrease of the C.
Table 4 showed the torque and power number of the impeller
at different C. The simulation results showed that the torque increased with the decrease of the C, so the power consumption would increase.
Table 4 Torque and power number at different C
Height of impeller Impeller torque/N·m Power number
C=H/3 0.480 1.569
C=H/4 0.503 1.644
C=H/5 0.528 1.725
C=H/6 0.549 1.795
C=H/7 0.580 1.897
3.3 Summary of simulation results
The simulation results showed the influence of the bottom structure, clearance size between baffle and side wall, and axial height of impller on characteristics of flow field that included the solid holdup distribution, the solid phase velocity distribution, the power number, and the suspension state of particles.
a b c d
e f g h
Figure 7 Comparison of the axial distribution curves of the solid holdup and solid phase velocity for different C
a. C=H/3 b. C=H/4 c. C=H/5 d. C=H/6 e. C=H/7
Figure 8 Comparison of solid holdup distribution of bottom for different C The particles would be pushed to higher position while there
was no clearance (S=0 mm). If there was small clearance size between the baffle and the side wall of the stirred tank, the particles would pass through the clearance, the probability of collision between particles and the turbulent intensity in the flow field were greatly increased, which can reduce particles accumulation at the bottom of stirred tank, and reduce the power consumption. However, Enlarging S would decrease the suspension height of particles, not only cannot strengthen the main flow, but also lead to most fluid through clearance forming tangential flow. So we chose S=6 mm in the experiment.
Solid phase velocity increased with decrease of C in the lower axial height, which was favorable to particles suspension at the center of bottom and at the edge of the bottom. Meanwhile, the power number increased with decreased of the axial height of impellers. In order to reduce the accumulation of particles at the bottom and power consumption, we chose the C=H/5 in the experiment.
4 Experiment of membrane separating from eggshell
4.1 Comparing before optimization and optimized separation deviceUnder the conditions (Stirred time is 15 min, Stirred rotational velocity N is 300 r/min, average solid holdup αs is 5%, and
temperature of separating medium is 20°C). Experiments with optimized device have been carried out three times and were compared with the non-optimized device. The results showed that
the average recovery rate of the membrane with non-optimized device was 76.6%, the average recovery rate of the membrane with optimized device was 83.5%. Therefore, the optimized separation device can significantly improve the membrane recovery.
4.2 Experiment device and working principle 4.2.1 Experiment device
The experiment device of separating egg membrane from eggshell mainly consists of support, motor, reducer, torque sensor, stirring shaft, impeller, stirred tank, temperature controller and inverter control box, etc. The specific structure was shown in Figure 9.
1. Computer 2. Multichannel instrument 3. Motor 4. Test support 5. Strainer mesh 6. Pumping port 7. Baffle 8. Dish-shaped bottom 9. Valve 10. Impeller 11. Temperature controller 12. Tank 13. Stirring shaft 14. Torque sensor 15. Reducer
4.2.2 Figures of experiment and power consumption of impellers Dish-shaped bottom stirred tank was used in this experiment, the S between baffle and the side wall was 6 mm, and axial height of impellers C was H/5. Other structure parameters were agreement with simulation.
The separating medium was water of which density ρl was
998 kg/m3, dynamic viscosity μ
l was 0.001 Pa·s. Solid particles
were eggshell particles of which density ρs was 2300 kg/m3. The
particles size ds was 0.5-1.5 mm. Average solid holdup αswas
3.3%-6.7%.
Figure 10 Diagram of experiment 4.2.3 Power consumption of impeller
The torque of the impellers was detected by the torque sensor, and the power was calculated by the Equation as follow.
T 9.549P N
= (12)
where, P is Power, W; N is Stirring rotational velocity, r/min; T is Torque, N·m.
The power consumption of stirring was mainly affected by the stirring rotational velocity, and the measured and simulation of 5 kinds of rotational velocity were compared. The measurement of stirred power was acquired while the particle diameter size ds was
0.5 mm, solid-liquid ratio αs was 1:20 g/mL, separating medium
temperature was 30°C, the comparison results were shown in the Table 5. The results showed that measured value was higher than simulation, and the error range was 9%-18%.
Table 5 Simulation and measured power consumption of stirring at different rotational velocity
Rotational velocity/r·min-1 200 250 300 350 400
Simulation/W 11.058 22.241 37.711 59.252 87.244 Measurement/W 13.012 25.712 41.891 65.314 95.275 4.2.4 Working process
Eggshell was cleaned, dried, and crushed to particles of which diameter size was 0.5-1.5 mm, and the crushing stage has destroyed the connection between the eggshell and egg membrane. Weighing a certain amount of eggshell fragments was placed in the stirred tank to separate membrane from eggshell. The stirring rotational velocity, the separation medium temperature, and the
stirring time were adjusted. The interaction between separating medium and particles made membrane separating from eggshell. The outlet of the stirred tank which was connected water pump. The membrane would be sucked into the pump and transmitted to the inlet of the stirred tank where covered with filter. Therefore, the membrane was collected and the water was recycled into the tank.
4.3 Eggshell membrane separation experiment 4.3.1 Experiment conditions
Eggshell: Fresh raw eggshell were collected from canteen in Northeast Agricultural University, The variety of the eggs is hailanhe ,the long axis of the eggs were from 52.3 to 55.4 mm, the short axis of the eggs were from 41.5 to 44.3 mm, Eggshell thickness range were from 0.30 to 0.32 mm and the eggshell average weight is 7.46 g.
Temperature controller: WENT-NT; Grinder: JFSD-100-ΙΙ;
Frequency converter: VFD-M; Water pump: TP-3000; Separating medium: Water.
4.3.2 Determination of residual calcium in membrane
30 mL HCl 1 mol/L and a certain amount of separated membrane were putted into the beaker under the condition of 30°C lasting for 3 h. After centrifugation the supernatant is transferred to a 50 mL volumetric flask and diluted to the scale, and another group HCL 1mol/L was used as blank control. The method of EDTA was used to determine the residual rate of Ca in egg membrane[21].
4.3.3 Evaluation criteria of the recovery rate of eggshell.
Because of the complexity of the measurement of the residual membrane of separated eggshell (The residual rate of membrane consists of two parts: one part is separated membrane cannot be collected, the other part is non-separated membrane), the recovery rate of membrane was used as the evaluation index. A certain amount of raw eggshells can be weighed, smashed, and divided into three groups, then it was soaked in HCl 1 mol/L. For a period of time, the CaCO3 adhered to the egg membrane was
completely separated, then the egg membrane was collected by means of flotation in water due to the different densities between the eggshell and the membrane. The membrane was dried and weighed, and the average ratio of membrane to eggshells (total quality of eggshells and membrane) was 3%, and residual rate of Ca in the membrane was about 0.21%. Therefore, we regarded mean value 3.00% as egg membrane content in eggshells for the subsequent experiments. For example, in experiments, M grams eggshell fragment should contain 3%×M grams membrane according to egg membrane content. If we got m grams membrane in the separation experiment, the recovery rate would be
100% 3%
m M
= ×
×
α
(13)
4.4 Experimental design of quadratic regression orthogonally rotation combination
rate of egg membrane in each group was calculated, and the influence of various factors on the experiment index was analyzed. The level coding table of influence factor was shown in Table 6.
Table 6 Level of experimental factors and coding
Coded symbol
Experimental factors Stirring time
x1/min
Stirring speed
x2/r·min-1
Solid-liquid ratio
x3/g·mL-1
Temperature
x4/°C
+γ 25 400 1:15 50.0
+1 21 350 1:17 42.5
0 17 300 1:20 35.0
–1 13 250 1:24 27.5
–γ 9 200 1:30 20.0
4.4.1 Experimental results and analysis
The experiment design and the experiment results were shown in Table 7. The residual rate of calcium in the separation membrane was 1.1%-2.2%.
Table 7 Experiment design and results
Experiment number
Experiment factors
Recovery rate of membrane/%
Residual rate of Ca
x1 x2 x3 x4
1 13.00 250.00 1:24 27.50 82.6 1.9
2 21.00 250.00 1:24 27.50 85.3 1.7
3 13.00 350.00 1:24 27.50 85.7 1.7
4 21.00 350.00 1:24 27.50 90.5 1.2
5 13.00 250.00 1:17 27.50 83.3 1.8
6 21.00 250.00 1:17 27.50 85.7 1.7
7 13.00 350.00 1:17 27.50 86.8 1.6
8 21.00 350.00 1:17 27.50 90.8 1.1
9 13.00 250.00 1:24 42.50 82.3 2.0
10 21.00 250.00 1:24 42.50 85.3 1.6 11 13.00 350.00 1:24 42.50 84.7 1.8 12 21.00 350.00 1:24 42.50 90.5 1.2 13 13.00 250.00 1:17 42.50 81.9 2.0 14 21.00 250.00 1:17 42.50 84.2 1.5 15 13.00 350.00 1:17 42.50 85.1 1.7 16 21.00 350.00 1:17 42.50 90.2 1.2
17 9.00 300.00 1:20 35.00 80.2 2.2
18 25.00 300.00 1:20 35.00 89.9 1.3 19 17.00 200.00 1:20 35.00 82.8 2.1 20 17.00 400.00 1:20 35.00 90.9 1.1 21 17.00 300.00 1:30 35.00 85.6 1.7 22 17.00 300.00 1:15 35.00 86.2 1.6 23 17.00 300.00 1:20 20.00 86.0 1.5 24 17.00 300.00 1:20 50.00 84.1 1.5 25 17.00 300.00 1:20 35.00 87.3 1.4 26 17.00 300.00 1:20 35.00 87.1 1.4 27 17.00 300.00 1:20 35.00 87.2 1.5 28 17.00 300.00 1:20 35.00 87.3 1.4 29 17.00 300.00 1:20 35.00 87.3 1.3 30 17.00 300.00 1:20 35.00 87.1 1.4 31 17.00 300.00 1:20 35.00 87.2 1.4 32 17.00 300.00 1:20 35.00 87.8 1.4 33 17.00 300.00 1:20 35.00 87.3 1.5 34 17.00 300.00 1:20 35.00 87.4 1.5 35 17.00 300.00 1:20 35.00 87.9 1.3 36 17.00 300.00 1:20 35.00 87.7 1.4
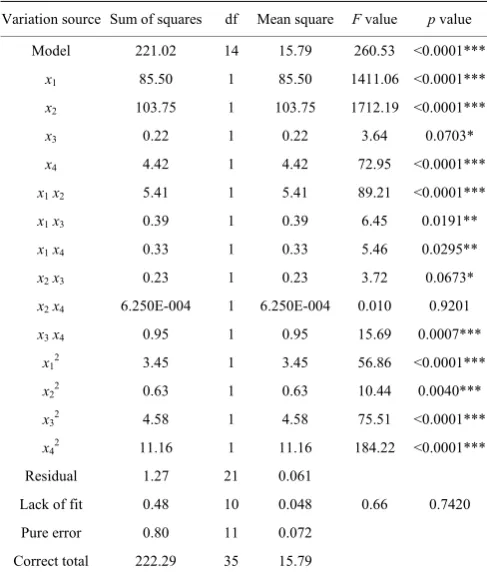
The regression model was obtained for the effect of each factor on egg membrane recovery, and the regression equation was as Equation (14).
Variance analysis of membrane recovery Y as shown in Table 8, Table 8 showed that the influence sequence of factors and interaction of different factors on the membrane recovery rate: x2,
x1, x42, x1x2, x32, x4, x12, x3x4, x22, x1x3, x1x4, x2x3, x3, x2x4.
1 2 3 4
-3 -3
1 2 1 3 1 4
2 -3 2
2 3 3 4 1 2
2 2
3 4
= 47.157 + 0.325 + 0.015 + 496.615 + 0.764 +2.906 10 3.906 + 4.791 10
+0.238 3.250 0.021 5.625 10 3781.250 0.012
y x x x x
x x x x x x
x x x x x x
x x
× − ×
− − − ×
− −
(14)
where, x1 is the mixing time, min; x2 is agitation rotational velocity,
r/min; x3 is the solid-liquid ratio, g/mL; x4 is the temperature, °C.
Table 8 Variance analysis of test results
Variation source Sum of squares df Mean square F value p value Model 221.02 14 15.79 260.53 <0.0001***
x1 85.50 1 85.50 1411.06 <0.0001***
x2 103.75 1 103.75 1712.19 <0.0001***
x3 0.22 1 0.22 3.64 0.0703*
x4 4.42 1 4.42 72.95 <0.0001***
x1 x2 5.41 1 5.41 89.21 <0.0001***
x1 x3 0.39 1 0.39 6.45 0.0191**
x1 x4 0.33 1 0.33 5.46 0.0295**
x2 x3 0.23 1 0.23 3.72 0.0673*
x2 x4 6.250E-004 1 6.250E-004 0.010 0.9201
x3 x4 0.95 1 0.95 15.69 0.0007***
x12 3.45 1 3.45 56.86 <0.0001***
x22 0.63 1 0.63 10.44 0.0040***
x32 4.58 1 4.58 75.51 <0.0001***
x42 11.16 1 11.16 184.22 <0.0001***
Residual 1.27 21 0.061
Lack of fit 0.48 10 0.048 0.66 0.7420 Pure error 0.80 11 0.072
Correct total 222.29 35 15.79
Note: *** indicates highly significance (p<0.01); ** indicates significance (0.01<p<0.05); * less significance (0.05<p<0.1).
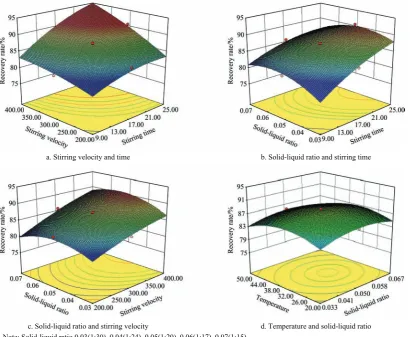
4.4.2 Influence of various factors on the experimental indexes In order to analyze the relationship between the recovery rate of egg membrane and the factors, the Design-Expert 8.0.6 software was used to obtain the response surface of interaction of factors, as shown in the Figure 11.
was the most significant. Separating egg membrane from eggshell was mainly effected by the impact between eggshell particles and flow field. Increasing stirring rotational velocity made the turbulence extent increasing, which enhanced the interaction between eggshell particles and flow field. In addition, the growth of stirring time would make the eggshell and egg membrane have sufficient time to separate effectively.
While the stirring rotational velocity was 300 r/min, the separating medium temperature was 35°C, the interaction influence of stirring time and solid-liquid ratio on the egg membrane recovery rate was shown in Figure 11b. While the stirring time was constant and solid-liquid ratio was less than 1:24 g/mL, egg membrane recovery rate increased with the increase of the ratio of the solid-liquid. Continue to increase the solid-liquid ratio, egg membrane recovery rate began to decrease. Collision possibility of particles reduced while solid-liquid ratio was too small, but the large solid-liquid ratio made some eggshell particles cannot be suspended, so this situation would influence the separation effect of particles. The range of optimum solid-liquid ratio was 1:17 g/mL to 1:24 g/mL. While the solid-liquid ratio was constant, the recovery rate of membrane was increased with the increase of stirring time, but its decreasing amplitude was slow gradually. While we took into account the time cost and power consumption, it was not an effective way to separate membrane from eggshell by increasing the mixing time. Optimum stirring time range was 17-21 min.
While the stirring time was 17 min, the separating medium temperature was 35°C, the influence of stirring rotational velocity and the solid-liquid ratio on the egg membrane recovery rate was
shown in Figure 11c. While the stirring rotational velocity was constant and solid-liquid ratio was less than 1:20 g/mL, egg membrane recovery rate increased with the increase of the ratio of the solid-liquid. Continue to increase the solid-liquid ratio, egg membrane recovery rate began to decrease gradually. While the solid-liquid ratio was constant, the recovery rate of membrane increased with the increase of stirring rotational velocity. Optimum stirring rotational velocity was 350-400 r/min. In addition, in order to reduce the power consumption, it should be appropriate to reduce the rotational velocity.
While the stirring time was 17 min, the stirring rotational velocity was 300 r/min, the effects of separating medium temperature and the solid-liquid ratio on the recovery rate of membrane are shown in Figure 11d. While separating medium temperature was constant and solid-liquid ratio was less than 1:20 g/mL, egg membrane recovery rate increased with the increase of the solid-liquid ratio of the. Continue to increase the solid-liquid ratio, egg membrane recovery rate began to decrease. Optimum solid-liquid range ratio was 1:24 to 1:17 g/mL, and the increasing and decreasing amplitude were also smaller. While the solid-liquid was constant and separating medium temperature was less than 32°C, egg membrane recovery rate increased with the increase of temperature. Continue to increase the temperature, egg membrane recovery rate began to decrease, and the increasing and decreasing amplitude were also small. Optimum separating medium temperature was 32-44°C. Generally speaking, the interaction between solid-liquid ratio and separating medium temperature had little effect on the recovery rate of the membrane.
a. Stirring velocity and time b. Solid-liquid ratio and stirring time
c. Solid-liquid ratio and stirring velocity d. Temperature and solid-liquid ratio Note: Solid-liquid ratio 0.03(1:30), 0.04(1:24), 0.05(1:20), 0.06(1:17), 0.07(1:15).
4.4.3 Optimization analysis
In order to get the perfect membrane recovery rate, the optimal factors level combination, improve separating efficiency, and reduce power consumption, Design-Expert software was used to optimize and design the experimental factors. According to the analysis of the response surface in Figure 11, the optimization conditions were as follows:
1
2
3
4
17 min 21 min 350 r/min 400 r/min 1: 24 g/mL 1:17 g/mL 32 C 44 C
x x
x x < < ⎧
⎪ < < ⎪
⎨ < < ⎪
⎪ ° < < ° ⎩
Though the above optimization, the optimal combination of the factors was obtained. While the stirring rotational velocity was 350 r/min, the stirring time was 17.1 min, the solid-liquid ratio was 1:17 g/mL, the medium temperature was 32°C, the membrane recovery rate was 89.4%.
4.4.4 Verify of experiment
In mid-August 2016, according to the optimization results, we repeat three times experiment under the condition that stirring time was 17.1 min, stirring rotational velocity was 350 r/min, solid-liquid ratio was 1:17 g/mL, and separating medium temperature was 32°C. Membrane recovery rate was respectively 89.1%, 89.9%, 88.3%, and its mean value was 89.1%, which were close to the optimization results. The optimization results were credible.
5 Conclusions
Compared with the traditional chemical method of eggshell membrane separation, the method of separating membrane from eggshell by grinding and mechanical stirring in water have many advantages with higher membrane recovery rate, and lower residual rate of calcium in membrane. Moreover, the influence factors of eggshell membrane separation are easy to be controlled, operated conveniently and need not long time. The separation medium of water can be recycled.
Adopting dish-shaped bottom tank produced significantly less particles accumulation than that of flat-shaped bottom tank at the center of bottom, at the no-facing water surface of baffles and at the edge of the bottom. What’s more, the power consumption in dish-shaped bottom stirred tank was less than that in the flat-shaped bottom stirred tank. While between the baffle and the side wall existed clearance in the stirred tank, it can reduce particles accumulation at the bottom of stirred tank, and reduce the power consumption. However, enlarging S would decreased suspension height of particles, not only cannot strengthen the main flow, but also lead to more fluid through clearance forming tangential flow. The particles accumulation decreased with decrease of C at the center of the bottom and at the edge of the bottom, but the power consumption increased dramatically.
According to the single factor experiment, the factors that affect the recovery rate of egg membrane were acquired, which include stirring rotational velocity, stirring time, solid-liquid ratio and separating medium temperature.
Quadratic regression orthogonally rotation combination design was carried out in experiment. The regression models were obtained for the effect of each factor on egg membrane recovery. Through response surface analysis the relationship between the egg
membrane recovery rate and the combination of factors, the experiment result showed that the factors effected on egg membrane recovery with the sequence: the stirring time, stirring rotational velocity, solid-liquid ratio and separation medium temperature.
Optimizing the experiment results, it was concluded that the recovery rate of the membrane can reach above 89% under the condition of the stirring time was 17.1 min, stirring rotational velocity was 350 r/min, solid-liquid ratio was 1:17 g/mL and the separating medium temperature was 32°C, which was close to the experiment results. Optimization results were credible.
Acknowledgements
The research was financially supported by the National Key Research and Development Program of China 2018YFD0400304, the earmarked fund for China Agriculture Research System project CARS-40-K25, Heilongjiang Province of China Postdoctoral Initial Fund LBH-Q18012.
[References]
[1] Chi Y, Wang Y, Ren J, Li H H, Zhang R R, Chi Y J. The design and experimental study of eggshell membrane separation device. Journal of Northeast Agricultural University, 2016; 8: 90–99. (in Chinese)
[2] Balaz M. Eggshell membrane biomaterialas a platform for applications in materials science. Acta Biomaterialia, 2014; 10: 3827–3835.
[3] Yoo S, Hsieh J S, Zou P, Kokoszka J. Utilization of calcium carbonate particles from eggshell waste as coating pigments for ink-jet printing paper. Bioresource Technology, 2009; 100(24): 6416–6421.
[4] Dejong M, Vlad V. Egg shell membrane separation: United States, US8418943. 2013-4-6.
[5] Snyder T. Eggshell membrane separation process: United States, US20140346261. 2014-11-27.
[6] Wadnerkar D, Tade M O, Pareek V K, Utikar R P. CFD simulation of solid–liquid stirred tanks for low to dense solid loading systems. Particuology, 2016; 1: 12.
[7] Tamburini A, Cipollina A, Micale G, Brucato A, Ciofalo M.CFD Simulations of dense solid–liquid suspensions in baffled stirred tanks: predictions of suspension curves. Chemical Engineering Journal, 2011; 178: 324–341.
[8] Li L C, Yang J, Xu B. Numerical simulation of the suspension characteristics of light density particles in stirred tank. Transactions of the CSAE, 2013; 29(16): 42–49. (in Chinese)
[9] Shi D E. Experimental study and numerical simulation of fluid-solid coupled in a stirred tank. Beijing University of Chemical Technology, 2014. (in Chinese)
[10] Yu Y. FLUENT introduction foundation and advanced tutorial. Beijing; Publishing Company of Beijing Institute of Technology, 2008: 145–187. (in Chinese)
[11] Micale G, Grisafi F, Rizzuti L, Brucato A. CFD simulation of particle suspension height in stirred vessels. Chemical Engineering Research and Design, 2004; 82(9): 1204–1213.
[12] Baltussen M, Kuipers J, Deen N. Direct numerical simulation of effective drag in dense gas-liquid-solid three-phase flows. Chemical Engineering Science, 2017; 158(2): 561–568.
[13] Jaime S E, Taghipour F. Computational simulation of mixing flow of shear thinning non-Newtonian fluids with various impellers in a stirred tank. Chemical Engineering and Processing, 2013; 93: 66–78.
[14] Li L C, Xu B, Yang J. Solid-liquid suspension characteristics of sinking and floating particles in a stirred tank based on computational fluid dynamics simulation. Journal of Mechanical Engineering, 2014; 12: 185–191.
[15] Ochieng A, Lewis A E. CFD simulation of solids off-bottom suspension and cloud height. Hydrometallurgy, 2006; 82(1-2): 1–12.
1750–1758. (in Chinese)
[17] Peng J Q, Song D L, Zong Y Y. Numerical simulation of flow field of four channel pulverized coal burner based on Fluent. Mechanical Science and Technology, 2012; 31(1): 63–66. (in Chinese)
[18] Ren J. Simulation and experimental study on flow field and dynamic performance of stirred reactor. Zhengzhou University, 2007. (in Chinese) [19] Ding Y. Numerical simulation of solid liquid two phase flow in a double
layer stirring system. East China University of Science and Technology, 2015. (in Chinese)
[20] Kuzmanić N, Žanetić R, Akrap M. Impact of floating suspended solids on the homogenization of the liquid phase in dual-impeller agitated vessel. Chemical Engineering and Processing, 2008; 47(4): 663–669.