JIEM, 2016 – 9(2): 310-329 – Online ISSN: 2013-0953 – Print ISSN: 2013-8423 http://dx.doi.org/10.3926/jiem.1509
Module-based Quality System Functionality Evaluation
in Production Logistics
Mahmood Reza Khabbazi1 , Jan Wikander1 , Mauro Onori2 , Antonio Maffei2 , De-Jiu Chen1
1Mechatronic, Department of Machine Design, KTH Royal Institute of Technology (Sweden)
2 Technologies for Adaptable Production, Department of Production Engineering, KTH Royal Institute of Technology
(Sweden)
[email protected], [email protected], [email protected], [email protected], [email protected]
Received: May 2015
Accepted: March 2016
Abstract:
Purpose: This paper addresses a comprehensive modeling and functionality evaluation of a module-based quality system in production logistics at the highest domain abstract level of business processes.
Design/methodology/approach: All domain quality business processes and quality data transactions are modeled using BPMN and UML tools and standards at the business process and data modeling. A modular web-based prototype is developed to evaluate the models addressing the quality information system functionality requirements and modularity in production logistics through data scenarios and data queries.
Findings: Using the object-oriented technique in design at the highest domain level, the proposed models are subject further development in the lower levels for the implementing case. The models are specifically able to manipulate all quality operations including remedy and control in a lot-based make-to-order production logistics system as an individual module.
Originality/value: this paper sets out to provide an explanatory approach using different practical technique at modeling steps as well as the prototype implementation.
Keywords: business process, data modelling, production logistics, QIS, UML, BPMN, data query
1. Introduction
Quality, as a definitive factor in all aspects of any organization assures a long-run success (Tari, Molina-Azorín & Heras, 2012). One of the main competitive edge in that matter is on the successful implementation of an effective Quality Information System (QIS) (Psomas, Kafetzopoulos & Fotopoulos, 2013; Wahid & Corner, 2009). Since, quality operations can no longer be carried out in paperwork as the manual quality data handling is extremely error-prone and inefficient, nor as an individual back office system, an integrated system provides desirable benefits in an automated manufacturing environment (Law & Tak, 2003). As a relatively new effort at integrating with manufacturing information system, the QIS increases the efficiency of any application of the production logistics information system as a broader and general perspective view (Anderson, Jerman & Crum, 1998; Tak & Hang, 2002). Hence, applications such as finding the quality problem root in the product lifecycle would be addressed efficiently (Ngai, Chau & Chan, 2011). In fact, QIS should ensure sending the right quality data to the right person at the right time. This in turn will highlight the important key role of data modeling based on a careful business process analysis as the backbone structure of the QIS development. Besides, the quality data should not be considered as another property of the manufacturing objects such as a lot or an item or a batch of items in manufacturing control information system (Khabbazi, Ismail, Ismail, Mousavi & Mirsanei, 2011). As such, the necessity of considering the quality system as another operational module in a modular system design and development for the production logistics is dramatically seen crucial.
system. The quality system requirements are highlighted and functionalities of the solution based on the identified requirements are evaluated through data queries providing real-time controllability. The modular-based design is another advantage of the proposed system proving the ability for integration with other back-office system in SMEs. The reminder of this paper is constructed in four main flowing sections. This introduction is followed by quality system and requirements, methodology description by explaining the procedure adopted for the modeling development as well as functionality evaluation, modeling development, and functionality evaluation. The conclusion is presented at the last section which is followed by the references list.
2. Quality System and Requirements
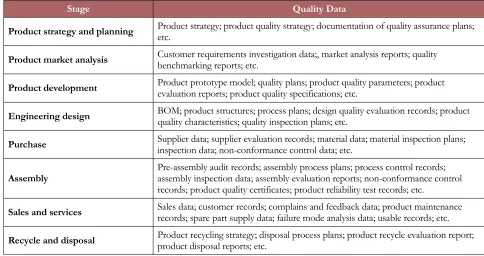
Quality data are scattered in different stages, individual departments and processes in various formats such as figures, reports, tables, files, and data sets. There is therefore, always a need to build an integrated quality data model to support all quality processes, sub-processes and activities throughout the whole life of a product (Tang & Yun, 2008). Base on different stages throughout a product’s lifecycle, some quality data is listed in Table 1.
Quality data is the most important basis in product quality control, quality management and quality improvement, and the most crucial resources in improving enterprise business (Gerber, Dietzsch & Althaus, 2004). Quality information system (QIS) should ensure to send the right quality data to the right person at the right time and as such the business process and data modeling is a key concern in LIS development to address such needs.
Practically, the Quality data at the manufacturing perspective was considered as quality characteristics of the Product data while in quality control and management domain they are as the Operation objects (Rönkkö, Kärkkäinen & Holmström, 2007). Therefore, it is necessary to differentiate the quality data from manufacturing data at modeling to achieve a better accuracy at later integration of the information systems (Tang & Yun, 2008). Moreover, (Dessouky & Kapoor, 1987) proposed the concept of integrated quality system and showed that the functions of quality system should be extended from manufacturing down to even the after-sales stages.
closely related to the quality assurance, such as organizational data, personnel data, quality specifications, previous products’ data, standards, etc. Static quality data can be modeled as a public module.
Stage Quality Data
Product strategy and planning Product strategy; product quality strategy; documentation of quality assurance plans; etc.
Product market analysis Customer requirements investigation data;, market analysis reports; quality benchmarking reports; etc.
Product development Product prototype model; quality plans; product quality parameters; product evaluation reports; product quality specifications; etc.
Engineering design BOM; product structures; process plans; design quality evaluation records; product quality characteristics; quality inspection plans; etc.
Purchase Supplier data; supplier evaluation records; material data; material inspection plans; inspection data; non-conformance control data; etc.
Assembly Pre-assembly audit records; assembly process plans; process control records; assembly inspection data; assembly evaluation reports; non-conformance control records; product quality certificates; product reliability test records; etc.
Sales and services Sales data; customer records; complains and feedback data; product maintenance records; spare part supply data; failure mode analysis data; usable records; etc.
Recycle and disposal Product recycling strategy; disposal process plans; product recycle evaluation report; product disposal reports; etc.
Table 1. Quality Data throughout the Product Lifecycle (Tang & Yun, 2008)
Dynamic quality data comes from quality operations and processes in product cycle, such as inspection data, test data, evaluating reports, product quality plan, individual specifications, quality verification records and non-conformance quality records, quality feedback data from customers, etc. Dynamic quality data are the core object in quality management. These data are correlated to discrete quality management processes and activities and dependent on quality management stages and activities. The intermediate data are produced in the course of quality assurance process, such as non-conformance rate of product, faulty rate, quality cost, etc. These kinds of data can produce the final data, and have to be managed in the process (Tang & Yun, 2008).
Moreover, the Quality data can also be divided into two types according to the relationship to product structure. One is related to product structure directly and the other is related indirectly. The former includes original quality data related to product structure like quality specifications. The latter mainly involves quality data resulting from quality activities ensuring product quality (Liu, Ren, & Zhang, 2005).
management might just be as a result of several operations or a trigger to proceed some operation. To have a suitable and responsive information system, therefore, there is a need of consideration of modular basis integration among this two set of information systems.
3. Methodology
Business process modeling is carried out to capture all the processes and their sequential flows as well as the flow of data and objects associated to them to describe the structure of the system and its behavior. Close relevant case study observation and literature review are done to identify the system requirement and the business process identification. Next, the architecture of the system is organized through classification of the Processes, Sequences, Triggers and Artifacts as well as the categorization of the Actors or Units based on their operational roles and duties. The development of BPM for the system is mainly carried out initially using the BPMN standard through “happy flow” technique for the highest domain level of abstraction. The BP models are used as the main input for data modeling step using UML standard. Next, using “noun phrase” technique, the classifier and instance classes are conceptualized. Data models are constructed into two main steps of modeling domain classifiers and conceptual/logical data modeling. An actual database prototype is designed following “evolutionary prototyping” technique. Next the functionality of the developed prototype is evaluated through data scenarios and query system on addressing the system requirements.
4. Modeling Development
4.1. QBPM - Quality Business Process Modeling
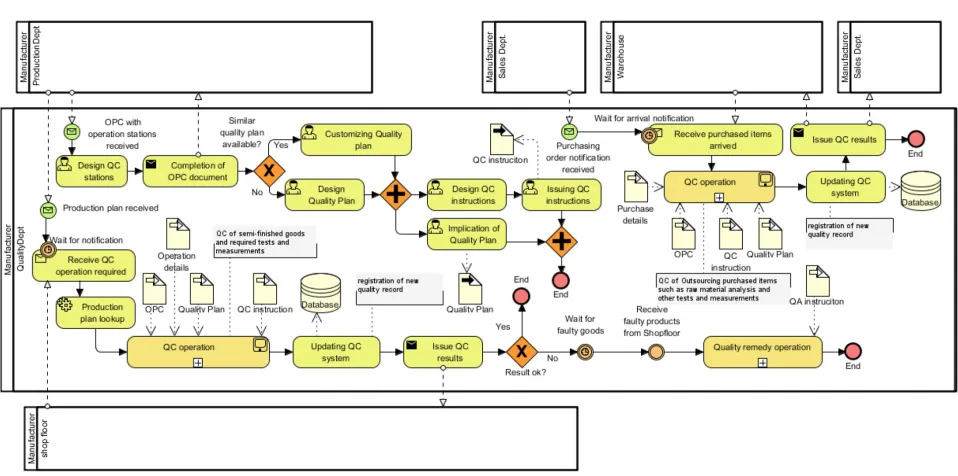
Quality business process modeling is to demonstrate how the quality data is created during quality operations on the transactions and transformation of adding value to the physical resource objects throughout the whole system. Dynamic quality data is generated by a number of activities at purchasing resources (e.g. raw material, outsourced products), semi-finished Work-in-process, and final products quality control which all are modeled at the highest domain level of the business process. The Quality, Sales, and Production Departments as well as the Warehouse and Shop floor are five identified involved roles in the Quality System. The Manufacturer is identified as abstract pool while the Quality Dept. as the main lane; and the Sales Dept., Production Dept., Warehouse, and Shop floor as the black box lanes.
task from the Warehouse, the QC operation “Embedded” sub-process is carried out. The Updating quality system is the next task which registers the quality data into the system and is followed by the Issue quality result “Send” task to the Sales Department. The flow ends with an end event as it shown in details in Figure 1.
Next, a static data object of OPC generation as a result of collaboration between the Production and Quality Systems is introduced. Quality System is launched with a “Message” start event of OPC with operation stations received from the Production Dept. containing OPC document with operation stations for a particular product. The Design QC stations “User” task adds the required Quality control stations to the OPC documents and will finalize it through the Completion of OPC document “Send” task. The new OPC invokes the availability of some other controlling artifacts such as QC instructions used by production staff. Nevertheless, the system checks for any similar available quality plans by a “Data-based exclusive” gateway of Similar quality plan available of which with Yes condition leading to the Customizing quality plan “User” task and with No condition leading to the Design quality plan “User” task. Next, the new Quality plan is implicated and concurrently the QC instruction is designed and Issued later as the result leading to the end of process.
Figure 1. Domain Business Process Model
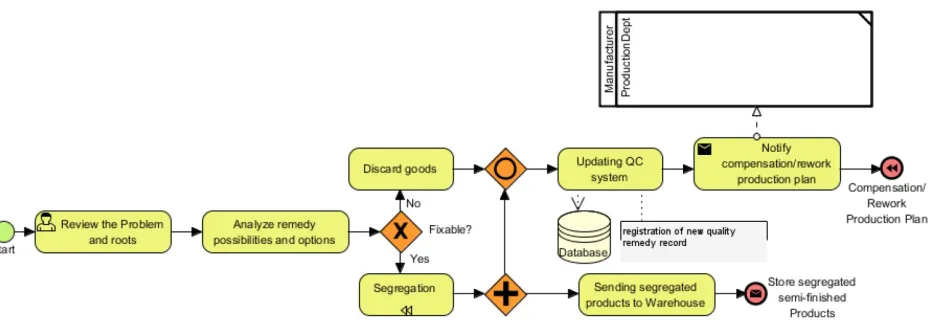
“Embedded” sub-process using required artifacts is made and QC results are registered with Updating QC system task and data are stored in Database as new quality records. Later Issue QC results “Send” task sends the QC results to Shop floor. Next, Result OK “Data-based inclusive” gateway controls the flow with two alternatives of Yes condition reaching to an end event and NO leading to Wait for faulty goods intermediate “Time” event. As such, upon receiving the faulty products from Shop floor, the Quality remedy operation process gets activated and is followed by end event. Figure 2 illustrates Quality remedy operation sub-process in expanded mode. Base on problem analysis and possible remedy options over the faulty products, Fixable “Data-based exclusive” gateway initiates Discard goods task over No and upon Yes condition Segregation “Compensation” task is followed. Updating QC system task is the next process for either flow to register quality remedy records into Database. The segregated products are sent to warehouse and the flow is ended with Store segregated semi finished products “Message” end event. Eventually, Notify compensation/rework production plan “Send” task is sent to Production department followed by Compensation/rework production plan “Compensation” end event after Updating QC system task.
Figure 2. Expanded Quality Remedy Operation Sub-process
4.2. QSDM - Quality System Data Modeling
4.2.1. Quality System Domain Class Diagram
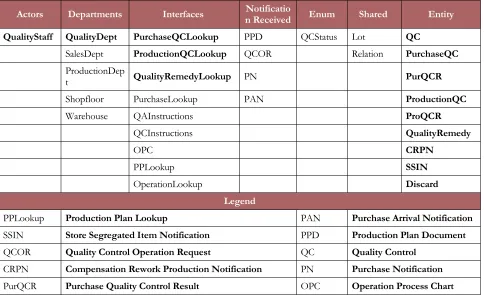
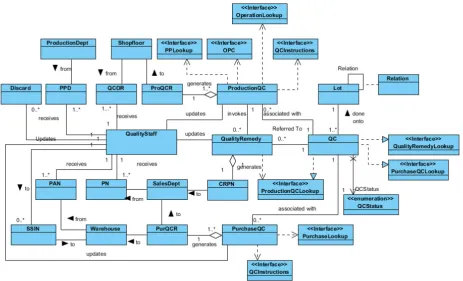
the received production plans, and QC operation request from the Shopfloor at defined QC stations designated at the OPC, the quality control operation takes place and the results issued to defined destinations. The quality system manages the generated data by registering them to respond promptly with message and notifications over confirmation and verifications or at the future data analysis triggered by lookups providing the QC operation details, reasons and results. Table 2 displays a classification of all identified involving Classes at Quality system module including Actors, Departments, Interfaces, Notifications received, Enumerations, Common, and Entity classes. The QualityStaff is the only identified actors within the system. Quality system has cooperative relationships with SalesDept, ProductionDept, Shopfloor, and Warehouse classes by sending and receiving messages and notifications of PPD, QCOR, PN, PAN, PurQCR, ProQCR, CRPN, and SSIN. Quality system module provides information on requested lookups by realizing the top three Interface classes of PurchaseQCLookup and ProductionQCLookup, and QualityRemedyLookup while depends on received information it acquires from the remaining Interface classes named at Table 2. Entity classes listed at the last column are the one that stores dynamic data into them including issuing messages and notifications. Common classes of Lot and Relation have been appeared at Production system module. At Quality system domain class diagram, they provide a better view on the relationship between QC done on Lot and also to demonstrate the possible generation of new Lot and thereby new Relation in cases like the segregation.
Actors Departments Interfaces Notification Received Enum Shared Entity
QualityStaff QualityDept PurchaseQCLookup PPD QCStatus Lot QC
SalesDept ProductionQCLookup QCOR Relation PurchaseQC
ProductionDep
t QualityRemedyLookup PN PurQCR
Shopfloor PurchaseLookup PAN ProductionQC
Warehouse QAInstructions ProQCR
QCInstructions QualityRemedy
OPC CRPN
PPLookup SSIN
OperationLookup Discard
Legend
PPLookup Production Plan Lookup PAN Purchase Arrival Notification
SSIN Store Segregated Item Notification PPD Production Plan Document
QCOR Quality Control Operation Request QC Quality Control
CRPN Compensation Rework Production Notification PN Purchase Notification
PurQCR Purchase Quality Control Result OPC Operation Process Chart
QAInstructions, QCInstructions, and OPC interface classes are used with dependency associations but QA and QC instruction planning process and sub-processes as well as defining the QC station at OPC generation process are out scoped logistics data modeling and therefore not concerned in here. Figure 3 illustrates the final view of Domain class diagram for Quality system.
Next, the cardinality of the class diagram is explained. Quality system is noticed to be prepared by receiving “1…*” purchase notification as PN from SalesDept and it gets into action later upon receiving the “1…*” purchase arrival notification as PAN from the Warehouse. Quality control of the purchased items will be carried out and the data registered at QC class emphasizing on the more general data and at the PurchaseQC class for more detail and variations of QC operations such as material analysis or measuring the dimensions. In fact, in this way of classification of data registration, the better traceability of information will be provided for one set of QC operation which is made for batch of item. It also means that for “1” QC class instance (i.e. record) there might be “0…*” instances at PurchaseQC class which the “0” implies no purchase quality control is associated and there are other possible quality control operations are associated with that particular instance. The “*” implies a set of quality control operations and thereby many instances (i.e. records) are generated at PurchaseQC class. The result of that given set of QC operation for the purchased batch of items will be issued and sent to SaleDept and the Warehouse which are responsible for the destiny of the purchased items. As such, “1…*” PurchaseQC instances are gathered in “1” purchase QC result document as PurQCR demonstrated by the “Aggregation” relationship. The system uses PurchaseLookup and QCInstructions to work appropriately in this part of business process.
Hence, the resumption of the production process whether to carry on or not is taken over again where the lots are located waiting for the QC results generally at the production station explained earlier at the Production System module. As such, “1…*” ProductionQC instances are gathered in “1” production QC result document as ProQCR demonstrated by the “Aggregation” relationship. The system uses PPLookup, OPC, OperationLookup, and QCInstructions to work properly.
Figure 3. Quality System Domain Class Diagram
4.2.2. Quality System Entity Class Diagram
The QC, PurchaseQC, ProductionQC, QualityRemedy, and Discard are identified as the main Entity Classes in which the fundamental specific dynamic Quality System data will be stored. PurQCR and ProQCR classes help the system work responsively by notifying other modules about the quality control results. The CRPN class is another notification entity class which declares the need for composition or rework due to the shortages causes by reducing the faulty product out of the produced items as the result of quality control operation. The SSIN is helping at clerking affairs once segregated items are sent to the Warehouse. The Lot and Relation are those of common classes that register the generated lots which are issued through Quality system upon any possible quality remedy operations. These Classes are elaborated next with their keys, attributes, data type scopes, and relationships with each other. Figure 4 displays the final view of the quality system entity class diagram. The data generated by the quality control and operations at one quality station for one particular batch of item either the purchased resources or value-added items in lots are classified and sorted through the QC class initially. Therefore, through this class, realization of Quality system interface classes is facilitated through classifying in one unique QCID.
The generated data by quality control operations for the purchased items will be stored at PurchaseQC class in details. Each unique operation or control which is carried out is registered and the result will be determined separately to trace the results efficiently. Therefore, “1” instance of QC class is associated with “0…*” instances of PurchaseQC class. The zero implies those instances of QC class which are not associated with PurchaseQC class, and “*” implies for one instance of associated QC class there might be several instances of PurchaseQC class. In a similar pattern, all the generated data by quality control operations for the value-added items will be stored at the ProductionQC class in details.
Quality remedy operation is registered at the QualityRemedy class. “1” instance of ProductionQC class invokes “0…*” instances of QualityRemedy class where zero implies the “Accept” results of the production QC operations. There is “1” instance of CRPN class for each instance at QualityRemedy class. The “0…*” instance of the QualityRemedy class will triggers the registration of “0…1” instance of SSIN class made by QualityStaff. The zero implies that there might be possible that all the produced items are faulty and there would not be any segregated items to be stored at the Warehouse. In both ways, either there would be accepted items left or not, the information of the discarded items will be registered at the Discard class in details. A single instance of introduced each Entity Class has a unique identification integer number as “: int” which is displayed at the data type scope section at the top attribute compartment list. The other attributes and the possible methods/operation of all classes are explained as follows.
QC (QCID: int) is composed of information about associate lotID: Lot; Related OID: Order; Related PPDID: PPD; and Result of QC operation as for lot with QCStatus: QCStatus. QCStatus is enumerated with accepted and rejected. PurchaseQC (purQCID: int) is composed of associated QCID: QC; Related purchaseID: PurchaseOrder, and PANID: PAN; Information about the item as SKU: Item; Information about the QC operation tests like testOperationName: string, testLocation, referenceDoc, startDate, EndDate; Responsible staffID: Staff; and result of each QC operation test through QCStatus: QCStatus. PurQCR (purQCRID: int) is generated from all purchase QC operation test which are carried out at one related QCID: QC. ProductionQC (proQCID: int) is composed of associated QCID: QC; Related QCORID: QCOR; Related oprID: Operation; Information about the item as SKU: Item; Information about the QC operation tests like testOperationName: string, OPCNo: int, referenceDoc, startDate, EndDate; Result of each QC operation test by QCStatus: QCStatus; and responsible staffID: Staff. ProQCR (proQCRID: int) is generated from all production QC operation test which are carried out at one related QCID: QC. QualityRemedy (QRID: int) is composed of associated QCID: QC; Invoked by proQCID: ProductionQC; for lotID: Lot containing SKU: Item at associateOPCNo with failureName: string; Information about QROperationName: string, and QRAmountsAndResults: string, startDate, EndDate, and referenceDoc; and responsible staffID: Staff.
QRID: QualityRemedy instance; and responsible staffID: Staff. Discard (discardID: int) is composed of related QCID: QC, and QRID: QualityRemedy instance; responsible staffID: Staff; and information about discarded item such as SKU: Item, and discardAmount: int. Next, the prototype design particular and its functionality evaluation are discussed.
5. Functionality Evaluation
Based on the quality system entity class diagram, the Quality System Tables are created. The names of the Tables, PKs, Fields, and other properties as well as their relationships with other Tables through FKs are demonstrated at Figure 5.
The QC Table is to associate the quality operation data to other parts of the e-LIS. There might be several kinds of quality operations to be carried out for one particular quality request. Therefore, the QC table is here to group all those detail quality operations for that particular quality request. There are generally two types of quality operations concerned including quality controls and quality remedy operations. The Purchase QC and Production QC Tables are created to record all quality control data while Quality Remedy Table is to record quality remedy operations.
Figure 5. Quality System Tables Relationships
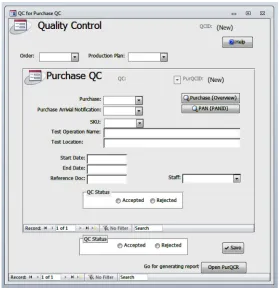
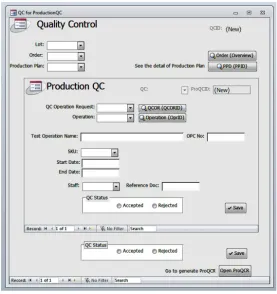
The procedure is the same for any production quality control, but at this case the details of the production QC will recorded through ProductionQC sub-form and it is saved at the Production QC Table as it is illustrated at Figure 7.
Figure 7. Quality Control and Production QC Form
Figure 8 illustrate Quality Remedy entry Form. After registration one record, three buttons below the form is to guide the next procedures. Based on the quality remedy operation made, new lots by quality might be issued, new records in discarded items might be registered, and new request for compensation or rework for production might be issued.
Figure 8. Quality Remedy Form
Lookup Name Data Query Setting Functionality
Purchase QC (Overview)
All details about the Purchase QC records including related data from QC and Purchase QC Tables.
SELECT QC.*, [Purchase QC].*
FROM QC INNER JOIN [Purchase QC] ON QC.QCID = [Purchase QC].QCID;
Traceability of all the Purchase QC details and status
Purchase QC and Purchase Order (Overview)
All details about all Purchase QC records and their related Purchase Order records.
SELECT QC.QCID, QC.OID, QC.[QC Status], [Purchase QC].PurQCID, [Purchase QC].SKU, [Purchase QC].[Test Operation Name], [Purchase QC].StaffID, [Purchase QC].[QC Status], [Purchase Order].PurchaseID, [Purchase Order].SupplierID, [Purchase Order].BidderID, [Purchase Order].Amount AS [Purchase Amount], [Purchase Order].[Purchase Order Date]
FROM [Purchase Order] INNER JOIN (QC INNER JOIN [Purchase QC] ON QC.QCID = [Purchase QC].QCID) ON [Purchase Order].PurchaseID = [Purchase QC].PurchaseID;
Traceability of all the Purchase QC details and the status for related Purchase Order
Production QC (Overview)
All details about the Production QC records including related data from QC and Production QC Tables.
SELECT QC.*, [Production QC].*
FROM QC INNER JOIN [Production QC] ON QC.QCID = [Production QC].QCID;
Traceability of all the Production QC details and status
Production QC and Operation (Overview)
All details about all Production QC records and their related Operation records. SELECT QC.QCID, QC.LotID, QC.OID, QC.PPDID, QC.[QC Status], [Production QC].QCORID, [Production QC].[Test Operation Name], [Production QC].SKU, [Production QC].[QC Status],
Operation.OperationID, Operation.MachineID, Operation.[Operation Name], Operation.[OPC No], Operation.[Start Operation], Operation.[Stop Operation], Operation.[Progress Status]
FROM Operation INNER JOIN (QC INNER JOIN [Production QC] ON QC.QCID = [Production QC].QCID) ON Operation.OperationID = [Production QC].OperationID;
Traceability of all the Purchase QC details and the status for related Operation
Production QC and Operation (Progress Completed)
All details about those Production QC records and their related Operation records of which their progress status are set as “Completed”.
SELECT QC.QCID, QC.LotID, QC.OID, QC.PPDID, QC.[QC Status], [Production QC].QCORID, [Production QC].[Test Operation Name], [Production QC].SKU, [Production QC].[QC Status],
Operation.OperationID, Operation.MachineID, Operation.[Operation Name], Operation.[OPC No], Operation.[Start Operation], Operation.[Stop Operation], Operation.[Progress Status]
FROM Operation INNER JOIN (QC INNER JOIN [Production QC] ON QC.QCID = [Production QC].QCID) ON Operation.OperationID = [Production QC].OperationID
WHERE (((Operation.[Progress Status])=2));
Analyzing the Status
Production QC and Operation (Rejecteds)
All details about those Production QC records and their related Operation records of which their QC status are set as “Rejected”.
SELECT QC.QCID, QC.LotID, QC.OID, QC.PPDID, QC.[QC Status], [Production QC].QCORID, [Production QC].[Test Operation Name], [Production QC].SKU, [Production QC].[QC Status],
Operation.OperationID, Operation.MachineID, Operation.[Operation Name], Operation.[OPC No], Operation.[Start Operation], Operation.[Stop Operation], Operation.[Progress Status]
FROM Operation INNER JOIN (QC INNER JOIN [Production QC] ON QC.QCID = [Production QC].QCID) ON Operation.OperationID = [Production QC].OperationID
WHERE (((QC.[QC Status])=2));
Analyzing the Status
Quality Remedy (Overview)
All details about the Quality Remedy records. SELECT [Quality Remedy].*
FROM [Quality Remedy];
Lookup Name Data Query Setting Functionality
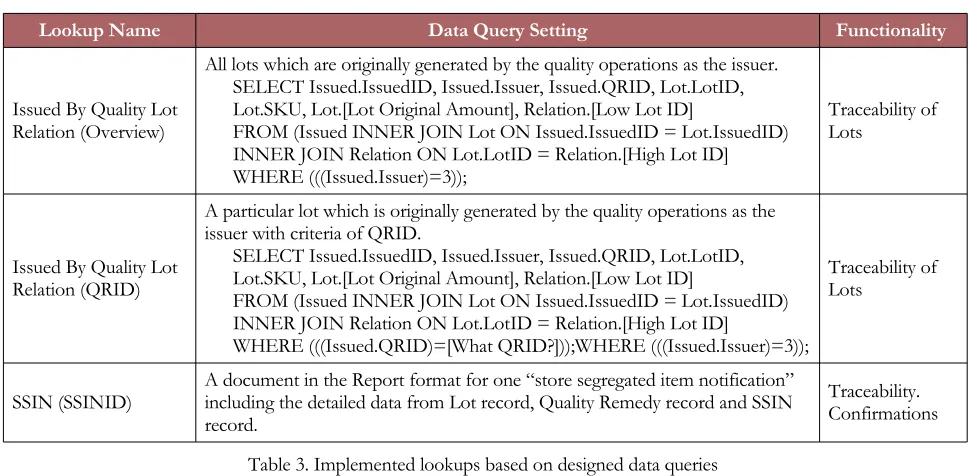
Issued By Quality Lot Relation (Overview)
All lots which are originally generated by the quality operations as the issuer. SELECT Issued.IssuedID, Issued.Issuer, Issued.QRID, Lot.LotID, Lot.SKU, Lot.[Lot Original Amount], Relation.[Low Lot ID]
FROM (Issued INNER JOIN Lot ON Issued.IssuedID = Lot.IssuedID) INNER JOIN Relation ON Lot.LotID = Relation.[High Lot ID] WHERE (((Issued.Issuer)=3));
Traceability of Lots
Issued By Quality Lot Relation (QRID)
A particular lot which is originally generated by the quality operations as the issuer with criteria of QRID.
SELECT Issued.IssuedID, Issued.Issuer, Issued.QRID, Lot.LotID, Lot.SKU, Lot.[Lot Original Amount], Relation.[Low Lot ID]
FROM (Issued INNER JOIN Lot ON Issued.IssuedID = Lot.IssuedID) INNER JOIN Relation ON Lot.LotID = Relation.[High Lot ID]
WHERE (((Issued.QRID)=[What QRID?]));WHERE (((Issued.Issuer)=3));
Traceability of Lots
SSIN (SSINID) A document in the Report format for one “store segregated item notification” including the detailed data from Lot record, Quality Remedy record and SSIN record.
Traceability. Confirmations
Table 3. Implemented lookups based on designed data queries
6. Conclusion
References
Anderson, R.D., Jerman, R.E., & Crum, M.R. (1998). Quality management influences on logistics performance. Transportation Research Part E: Logistics and Transportation Review, 34(2), 137-148.
http://dx.doi.org/10.1016/S1366-5545(98)00008-8
Dessouky, M.I., & Kapoor, S.G. (1987). A methodology for integrated quality system. Journal of Engineering for Industry ASME, 109, 241-247. http://dx.doi.org/10.1115/1.3187125
Gerber, A., Dietzsch, M., & Althaus, K. (2004). Information based, dynamic quality information system for non-hierarchic regional production networks. Robotics and Computer-Integrated Manufacturing, 20(6), 583-591. http://dx.doi.org/10.1016/j.rcim.2004.06.003
Khabbazi, M.R., Ismail, Y., Ismail, N., Mousavi, S.A., & Mirsanei, H.S. (2011). Lot-base traceability requirements and functionality evaluation for small- to medium-sized enterprises. International Journal of Production Research, 49(3), 731-746. http://dx.doi.org/10.1080/00207540903530810
Law, H.-W., & Tak, M.W. (2003). Quality control information representation using object-oriented data models. International Journal of Computer Integrated Manufacturing, 16(3), 192-209.
http://dx.doi.org/10.1080/0951192021000036849
Liu, M.Z., Ren, L., & Zhang, M.X. (2005). Research on manufacturing quality data management methods of quality statistical process control. Computer Integrated Manufacturing Systems, 11(2), 280-283.
Ngai, E.W.T., Chau, D.C.K., & Chan, T.L.A. (2011). Information technology, operational, and management competencies for supply chain agility: Findings from case studies. The Journal of Strategic Information Systems, 20(3), 232-249. http://dx.doi.org/10.1016/j.jsis.2010.11.002
Psomas, E., Kafetzopoulos, D., & Fotopoulos, C. (2013). Developing and validating a measurement instrument of ISO 9001 effectiveness in food manufacturing SMEs. Journal of Manufacturing Technology Management, 24(1), 52-77. http://dx.doi.org/10.1108/17410381311287481
Rönkkö, M., Kärkkäinen, M., & Holmström, J. (2007). Benefits of an item-centric enterprise-data model in logistics services: A case study. Computers in Industry, 58(8-9), 814-822.
http://dx.doi.org/10.1016/j.compind.2007.02.003
Tak, M.W., & Hang, W.L. (2002). Modeling of a quality control information system for small- to medium-sized enterprises. Integrated Manufacturing systems, 13(4), 222-236.
Tang, X., & Yun, H. (2008). Data model for quality in product lifecycle. Computers in Industry, 59(2-3), 167-179. http://dx.doi.org/10.1016/j.compind.2007.06.011
Tari, J.J., Molina-Azorín, J.F., & Heras, I. (2012). Benefits of the ISO 9001 and ISO 14001 standards: A literature review. Journal of Industrial Engineering and Management, 5(2), 297-322.
http://dx.doi.org/10.3926/jiem.488
Wahid, R.A., & Corner, J. (2009). Critical success factors and problems in ISO 9000 maintenance. International Journal of Quality and Reliability Management, 26(9), 881-893.
http://dx.doi.org/10.1108/0265671091099507
Journal of Industrial Engineering and Management, 2016 (www.jiem.org)
Article's contents are provided on an Attribution-Non Commercial 3.0 Creative commons license. Readers are allowed to copy, distribute and communicate article's contents, provided the author's and Journal of Industrial Engineering and Management's