DEMOGRAPHIC RESEARCH
VOLUME 33, ARTICLE 36, PAGES 1035
−
1046
PUBLISHED 12 NOVEMBER 2015
http://www.demographic-research.org/Volumes/Vol33/36/ DOI: 10.4054/DemRes.2015.33.36
Descriptive Finding
The effects of wealth, occupation, and
immigration on epidemic mortality from selected
infectious diseases and epidemics in Holyoke
township, Massachusetts, 1850−1912
Susan Hautaniemi Leonard
Christopher Robinson
Alan C. Swedlund
Douglas L. Anderton
©2015 Susan Hautaniemi Leonard et al.
This open-access work is published under the terms of the Creative Commons Attribution NonCommercial License 2.0 Germany, which permits use, reproduction & distribution in any medium for non-commercial purposes, provided the original author(s) and source are given credit.
1 Introduction 1036
2 Data and methods 1037
3 Results 1039
3.1 Population-level trends 1039
3.2 Poisson models 1041
4 Conclusion 1043
5 Acknowledgements 1044
Demographic Research: Volume 33, Article 36 Descriptive Finding
The effects of wealth, occupation, and immigration on epidemic
mortality from selected infectious diseases and epidemics in Holyoke
township, Massachusetts, 1850−1912
Susan Hautaniemi Leonard1
Christopher Robinson2
Alan C. Swedlund3
Douglas L. Anderton4
Abstract
BACKGROUND
Previous research suggests individual-level socioeconomic circumstances and resources may be especially salient influences on mortality within the broader context of social, economic, and environmental factors affecting urban 19th century mortality.
OBJECTIVE
We sought to test individual-level socioeconomic effects on mortality from infectious and often epidemic diseases in the context of an emerging New England industrial mill town.
METHOD
We analyze mortality data from comprehensive death records and a sample of death records linked to census data, for an emergent industrial New England town, to analyze infectious mortality and model socioeconomic effects using Poisson rate regression. RESULTS
Despite our expectations that individual resources might be especially salient in the harsh mortality setting of a crowded, rapidly growing, emergent, industrial mill town with high levels of impoverishment, infectious mortality was not significantly lowered by individual socio-economic status or resources.
1 University of Michigan, U.S.A.
2 Corresponding author. University of South Carolina, U.S.A. E-Mail: [email protected]. 3 Emeritus, University of Massachusetts, Amherst, U.S.A.
1. Introduction
Social, economic, and environmental factors all impacted mortality in 19th century Europe and the United States. The type of place (rural or urban, industrial or non-industrial area, stable or growing population) was a powerful predictor of mortality, especially for children, even when socioeconomic status (SES) is taken into account (e.g., Preston and Haines 1991; Vinovskis 1981; Preston and Van de Walle 1978). The effects of structural and social environmental mechanisms (sanitation, overcrowding, occupational structure, population stability) also varied within geographic regions (e.g., Preston and Van de Walle 1978; Melosi 1999). Yet individual-level socioeconomic circumstances influenced mortality across the wider disparities and inequalities of geographic circumstance in 19th century society (e.g., Condran 1995; Garrett et al. 2001; Preston and Haines 1991), and may have even been most salient where other circumstances were most dire (Reid 1997). We sought to expand on our own previous work in 19th century Massachusetts towns, by asking whether individual-level socioeconomic factors influenced mortality from infectious diseases characterized by epidemics in emerging urban, often stressful and harsh, environments.
Demographic Research: Volume 33, Article 36
2. Data and methods
We utilized two datasets for this analysis. The first dataset includes records of all deaths in Holyoke between 1850 and 1912. The second dataset is an urban-based geographic sample of Federal census records, linked to property tax information and death records in the year following the census, allowing us to analyze personal and family characteristics not available from the death records. Gutman (1956) demonstrates the extraordinary completeness of Massachusetts death reporting and previous research (e.g., Leonard, Beemer, and Anderton 2012) demonstrates representation of the impoverished within the tax-linked dataset. We looked at trends in mortality rates for the entire population using the first dataset, and modeled mortality rates for the sampled census population using Poisson rate regression. Cause-specific counts of deaths are the numerators of the rates, with interpolated census population counts as the denominators. The model presented here was developed in prior research and applied to overall adult and child mortality (Leonard, Beemer, and Anderton 2012). In this note we replicate the same model, limited to mortality from the important infectious diseases of the time in this place.
We focused on infectious diseases that caused significant epidemics in the 19th century United States (Condran and Murphy 2008) and were continually present in Holyoke between 1850 and 1912. The ten causes in our analysis include eight infectious diseases listed in the first edition of the International Classification of Disease: diphtheria and croup, influenza, measles, meningitis, scarlet fever, smallpox, typhoid, and whooping cough. We combine cholera nostra, dysentery, and diarrheal enteritis into a single category of diarrheal causes, and include tuberculosis because it is a contagious disease that was a consistent cause of excess mortality during this time.
We control for age effects on mortality by dividing our data into two broad age groups: less than 15 years of age (children) and 15 years and older (adults). The age cutoff was chosen for consistency with previous work and to allow robust analysis with small sample sizes.
is specified by three dichotomous categories: born in Ireland and observed before 1870 when Irish immigration declined, born in Canada and observed before 1880 when Canadian immigration declined, and born in Eastern Europe, which was substantial only in our last study periods. These categories roughly proxy likely recent foreign-born arrivals with significant selection effects. Conversely, the excluded category includes all those less likely to be recent arrivals from abroad than those observed during one of these three substantial immigration waves, including US-born internal immigrants, and less likely subject to the same substantial selection effects. For convenience we label this excluded category simply as “other residents and immigrants”.
Two measures of wealth and one of income represent resources available within families. We created two dichotomous variables indicating any taxable real estate and any taxable personal estate of the family (as identified in the census). Previous research indicated that these forms of wealth can have different effects. To test the effect of income, we summed the IPUMS variable ‘occscore’ over the census family unit. Occscore is the median wage for specific occupations in 1950 (IPUMS-USA 2015). We use it as a relative ranking of income, not an absolute amount of income.
We considered several different variables to measure occupational effects of census family head. First we tested the broad industry categories from the 1880 census occupational classification system. These categories were not significant, most likely because classification is industry-based, grouping high and low income occupations together. We then identified occupations with the lowest median incomes within each 1880 industry category, defined as the bottom quartile of the value of occscore. These measures were also not significant. In our final model we include the dichotomous variable which has the most salience and combines the lowest scored occupations within “trade and transportation” and “manufacturing, mechanical, and mining” industries, compared to all other occupations.
Demographic Research: Volume 33, Article 36
3. Results
3.1 Population-level trends
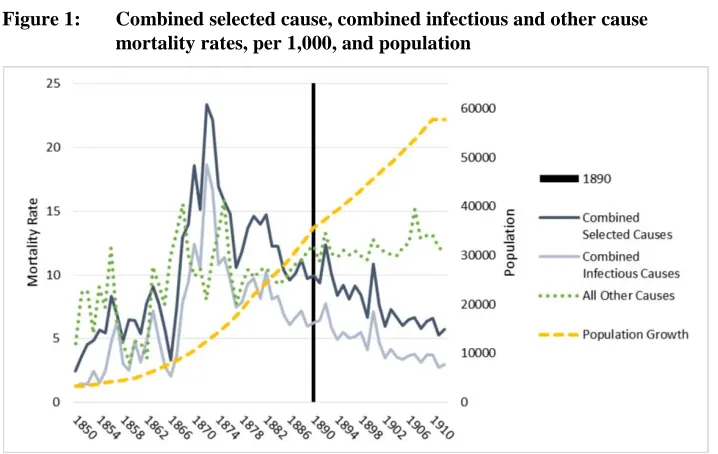
Figure 1 shows rates for the combined selected causes, combined infectious causes (tuberculosis excluded), and all other causes, with population. Mortality from the selected causes increased sharply in the late 1860s, peaking in 1872 at a rate of 23.36 deaths per 1,000. Mortality from infectious causes and tuberculosis started declining in the 1870s, despite the rapidly increasing population. The transition to predominately non-infectious causes occurred around 1890.
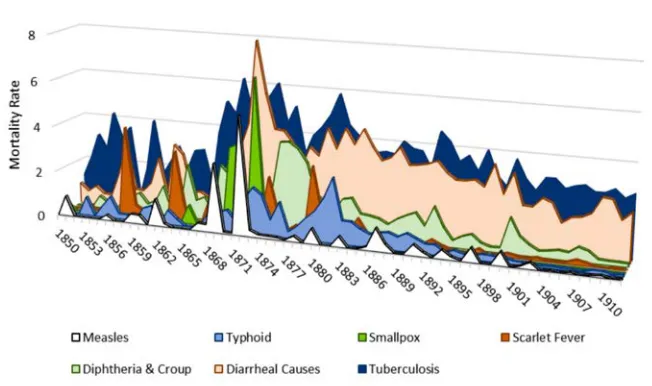
Figure 2 shows cause-specific rates of excess mortality, and highlights the concurrent nature of epidemic mortality from different causes. Two categories, tuberculosis and diarrheal causes, consistently make up the majority of the deaths. Outbreaks of diphtheria and croup, measles, scarlet fever, smallpox, and typhoid mainly occurred prior to 1890, and multiple infectious causes contributed to periods of high excess mortality.
Demographic Research: Volume 33, Article 36
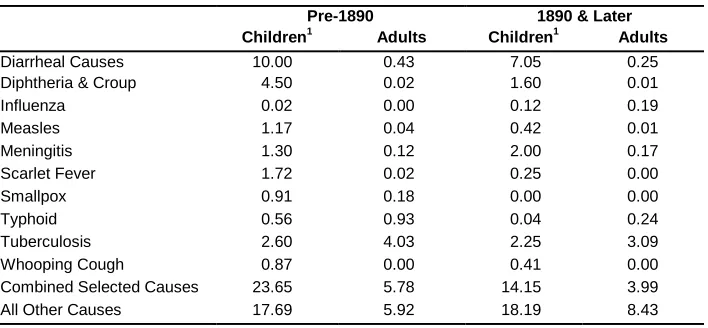
Table 1 shows cause-specific mortality by age group and period. Tuberculosis was the leading cause of death for adults in both time periods, with diarrheal causes the leading category for children. Mortality declined between periods for both age groups in all selected causes except meningitis and influenza.
Table 1: Cause-specific mortality by age group, per 1,000
Pre-1890 1890 & Later Children1 Adults Children1 Adults
Diarrheal Causes 10.00 0.43 7.05 0.25
Diphtheria & Croup 4.50 0.02 1.60 0.01
Influenza 0.02 0.00 0.12 0.19
Measles 1.17 0.04 0.42 0.01
Meningitis 1.30 0.12 2.00 0.17
Scarlet Fever 1.72 0.02 0.25 0.00
Smallpox 0.91 0.18 0.00 0.00
Typhoid 0.56 0.93 0.04 0.24
Tuberculosis 2.60 4.03 2.25 3.09
Whooping Cough 0.87 0.00 0.41 0.00
Combined Selected Causes 23.65 5.78 14.15 3.99
All Other Causes 17.69 5.92 18.19 8.43
1
Children are aged less than 15 years.
3.2 Poisson models
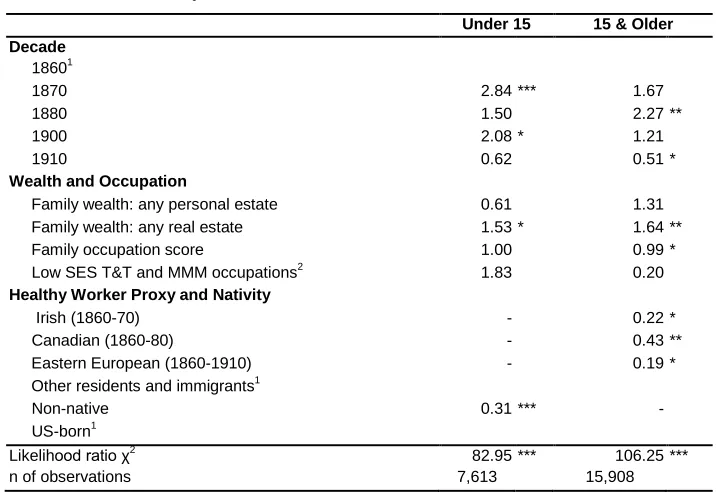
Table 2: Incidence rate ratios of death from combined selected infectious mortality from the final Poisson models
Under 15 15 & Older Decade
18601
1870 2.84 *** 1.67
1880 1.50 2.27 **
1900 2.08 * 1.21
1910 0.62 0.51 *
Wealth and Occupation
Family wealth: any personal estate 0.61 1.31
Family wealth: any real estate 1.53 * 1.64 **
Family occupation score 1.00 0.99 *
Low SES T&T and MMM occupations2 1.83 0.20
Healthy Worker Proxy and Nativity
Irish (1860-70) - 0.22 *
Canadian (1860-80) - 0.43 **
Eastern European (1860-1910) - 0.19 *
Other residents and immigrants1
Non-native 0.31 *** -
US-born1
Likelihood ratio χ2 82.95 *** 106.25 ***
n of observations 7,613 15,908
*p <.05, **p<.01, ***p<.001; 1
Reference category; 2
SES = socio-economic status, T&T = trade and transportation occupations; MMM = manufacturing, mechanical, and mining occupations (as categorized in the US Census of 1880).
As expected, the early decades had higher mortality from the selected causes in both age groups. Similar to the population-level data, the model indicates that the largest period effect occurred during the decades corresponding to the highest combined selected cause mortality, 1865−1885. The significant effect for 1900 among children reflects the last distinct outbreak of diphtheria and croup in combination with a high rate from diarrheal causes, as seen in Figure 2.
Demographic Research: Volume 33, Article 36
Largely because family real estate wealth increases with time since immigration into the town and with age, our previous research using all causes of death suggests that mortality advantages of healthy immigrants decline as real estate wealth increases. This is not causal: it is the general effect of the passage of time operating on both phenomena, and is not limited to international migrants. Thus, family real estate wealth significantly and substantially increased the likelihood of death while the three variables designed to assess the healthy migrant effect (country of birth and decade of peak migration) are all significant and reduce the likelihood of death from combined selected causes in Holyoke. Real estate wealth could also indicate residing away from the extensive company tenements in the heart of town, but again the expected mortality direction would be positive, not negative.
The work of Reid and colleagues (Reid 1997; Garrett et al. 2001) suggests socioeconomic effects were perhaps even larger in homogeneously heavy industrial areas of England and Wales. Based on this we expected that a higher family occupational score would be especially salient in lowering the likelihood of death in Holyoke, with its high concentration of industrial mills. However, the sum of family occupation scores, as a proxy for SES effects, was not significant in the model.
4. Conclusion
5. Acknowledgements
Demographic Research: Volume 33, Article 36
References
Anderton, D.L., Beemer, J.K., and Leonard, S.H. (2005). Family Wealth and Mortality: An Analysis of Alternative 19th Century Data Sources. Paper presented at the IUSSP Kinship and Demographic Behavior Seminar, Salt Lake City, Utah, October 31 − November 1 2005.
Condran, G. (1995). Changing Patterns of Epidemic Disease in New York City. In: Rosner, D. (ed.). Hives of Sickness: Public Health and Epidemics in New York City. New Brunswick, NJ: Rutgers University Press: 27−41.
Condran, G.A. and Murphy J. (2008). Defining and Managing Infant Mortality a Case Study of Philadelphia, 1870–1920. Social Science History 32(4): 473−513.
doi:10.1215/01455532-2008-006.
Garrett, E., Reid, A., Schürer, K., and Szreter, S. (2001). Changing Family Size in England and Wales, 1891−1911. Cambridge: Cambridge University Press.
doi:10.1017/CBO9780511495816.
Gutman, R. (1956). The accuracy of vital statistics in Massachusetts, 1842−1901. [Ph.D. dissertation]. New York City: Columbia University, Political Science. Green, C.M. (1939). Holyoke Massachusetts: A Case Study of the Industrial Revolution
in America. Yale, CT: Archon Books.
IPUMS-USA (2015). Integrated Occupation and Industry Codes and Occupational Standing Variables in the IPUMS [electronic resource]. https://usa.ipums.org/usa/chapter4/chapter4.shtml.
Leonard, S.H., Beemer, J.K., and Anderton, D.L. (2012). Immigration, Wealth and the ‘Mortality Plateau’ in Emergent Urban-Industrial Cities of Nineteenth-Century Massachusetts. Continuity and Change 27(3): 433−459. doi:10.1017/S026841
6012000215. PubMed Central ID:PMC3650859.
Melosi, M.V. (1999). The Sanitary City: Urban Infrastructure from Colonial Times to the Present. Baltimore, MD: John Hopkins Press.
Preston, S.H. and Haines, M.R. (1991). Fatal Years: Child Mortality in Late-Nineteenth-Century America. Princeton, NJ: Princeton University Press.
doi:10.1515/9781400861897.
Reid, A. (1997). Locality or Class? Spatial and Social Differentials in Infant and Child Mortality in England and Wales, 1896−1911. In: Corsini, C.A. and Viazzo, P.P. (eds.). The Decline of Infant and Child Mortality. The European Experience: 1750–1990. The Hague: Martinus Nijhoff Publishers: 129−154.