Geschke Center
Doctor of Nursing Practice (DNP) Projects Theses, Dissertations, Capstones and Projects
Fall 12-8-2014
Evidence-based Change in Practice: Development
and Implementation of Type II Diabetic Flow
Sheet
Kathryn Grimleybaker
Follow this and additional works at:https://repository.usfca.edu/dnp Part of thePublic Health and Community Nursing Commons
This Project is brought to you for free and open access by the Theses, Dissertations, Capstones and Projects at USF Scholarship: a digital repository @ Gleeson Library | Geschke Center. It has been accepted for inclusion in Doctor of Nursing Practice (DNP) Projects by an authorized administrator of USF Scholarship: a digital repository @ Gleeson Library | Geschke Center. For more information, please [email protected].
Recommended Citation
Grimleybaker, Kathryn, "Evidence-based Change in Practice: Development and Implementation of Type II Diabetic Flow Sheet" (2014).Doctor of Nursing Practice (DNP) Projects. 41.
Doctor of Nursing Practice Project
Evidence-based Change in Practice: Development and Implementation of Type II Diabetic Flow Sheet
Section I: Acknowledgments
First and foremost, I want to acknowledge and thank the inspirational faculty and staff at the University of San Francisco. They have supported me as I journeyed through this Doctor of Nursing Practice (DNP) program. Special thanks to the brilliant and extraordinary faculty under
whose direction I rediscovered how to use my career in nursing as a platform to change the
world from here. Thank you to Dr. Judith Lampton, Dr. Susan Prion, Dr. KT Waxman, Dr. Amy
Nichols, Dr. Kathleen Nakfoor, Dr. Marie Claude Couture, and Dr. Greg Crow. Words are not enough to thank my DNP chairs, Dr. Robin Buccheri and Dr. Karen Van Leuven, as well as my readers, Dr. Mary Lou De Natale and Dr. Jo Loomis. You were the best cheerleaders and without
you, this project could not have occurred. Thank you Claire Sharifi for your one-on-one time in the library, you are the best. Words do not describe the gift my Wednesday study group was for
me all these years. Lisa, Debbie, and the late Pam Bunnell, I will forever be grateful!
Finally, thanks to my family who endured the ripple effect of my struggles on our home life to reach this destination. Thank you Steve, Ryan, and Kyle for your love and support. You
are the most precious gifts God has given me, and I feel blessed everyday to have you in my life. To my Aunt Doris who provided a resting place between the University of San Francisco and my
home. She always had an attentive ear as I shared my tides and tribulations in the program. Thanks to my sister Mary who knows my true journey. Finally, thank you to my father, who attended the University of San Francisco a short time before joining the Marine Corps. He saw
Table of Contents
Section I: Acknowledgments ... 2
Abstract ... 6
Section II: Introduction ... 7
Background Knowledge ... 7
Local Problem... 8
Intended Improvement ... 10
Review of Evidence ... 11
Benefits of nurses in primary care ... 12
Diabetic flow sheets ... 12
Diabetic flow sheets and patient outcomes ... 13
Assessing BMI of diabetic patients ... 14
Evidence-Based appraisal tools... 15
Conceptual/Theoretical Framework ... 16
The Donabedian Model... 16
Rogers’ Diffusion of Innovations Theory ... 18
Section III: Methods ... 19
Ethical Issues ... 19
Setting ... 21
History of Samaritan House ... 21
Present setting ... 22
Planning the Intervention ... 25
Failure mode and effects analysis ... 26
Staff and customer activities ... 27
Cost and benefit ... 28
Responsibility/Communication Matrix ... 29
Implementation of the Project ... 29
Planning the Study of the Intervention... 30
Quality Improvement design ... 30
GANTT ... 33
Methods of Evaluation ... 35
Strengths, Weakness, Opportunities, and Threats ... 36
Return on investment ... 36
Analysis ... 38
Section IV: Results ... 38
Program Evaluation and Outcomes ... 38
Project Evolution ... 39
Lesson learned ... 43
Post implementation chart audits ... 44
Staff satisfaction surveys ... 45
Section V: Discussion ... 46
Summary ... 46
Implications for advanced nursing practice ... 48
Dissemination plan ... 48
Relation to Other Evidence ... 49
Barriers to Implementation/Limitations ... 50
Interpretation ... 52
Conclusions ... 53
Future implications ... 53
Section VI: Other Information ... 54
Funding ... 54
References ... 55
Appendix ... 68
A. The IHI Triple Aim Initiative ... 68
B. USFSONHP – Vision and Mission... 69
C. USFSONHP – Values ... 70
D. Hierarchy of Evidence Strength Table ... 72
E. Evaluation Table ... 73
F. BMI chart ... 81
H. Letter of support ... 84
I. Ethics modules ... 85
J. Student Project Approval: Statement of Determination ... 86
K. NCQA core measures Version I ... 91
L. Failure Mode and Effects Analysis (FMEA) ... 94
M. Annual Cost to Sustain Project ... 95
N. Responsibility and Communication Matrix ... 96
O. Plan, Do, Study, Act (PDSA) Timeline ... 97
P. Gap Analysis / BMI ... 99
Q. Gap analysis of blood pressures ... 100
R. Gap analysis of HA1C ... 101
S. GANTT ... 102
T. SWOT Analysis ... 103
U. Chart Audit Results ... 105
V. Staff Satisfaction Survey ... 106
W. Survey Results ... 107
Abstract
Ten percent of the National Health Service annual budget goes to treat complications from diabetes (Lancet, 2010).The American Diabetes Association® (ADA, 2013) estimated that diabetics in the United States incur $176 billion annually in direct medical costs for treatment
with hospitalization being the main component of the expenditures. California has the largest population of diabetics and the highest annual cost at $27.6 billion (ADA, 2013). The Healthcare
Cost and Utilization Project (HCUP, 2008) found that the average cost of hospitalization in 2008 for a patient with diabetes was $10,937 in contrast to $8,746 for a patient without diabetes. The Centers for Disease Control and Prevention (CDC, 2011) estimated that by 2050, one in three
adults in the United States will develop type II diabetes. This DNP student was inspired by the Institute of Healthcare Improvement’s (IHI) (IHI, 2013a) Triple Aim (see Appendix A). The IHI
Triple Aim is a three dimensional improvement system that aims for better health care and lower cost for patients with complex needs (IHI, 2013a).This DNP student designed and took the lead as project manager to implement a quality improvement (QI) project to provide streamlined care
to type II diabetic patients, saving healthcare provider’s time, and enhancing coordination of care between all specialty disciplines caring for these patients. This change in practice project
employed an evidence-based practice diabetic flow sheet (EBPDFS) for staff that care for the adult type II diabetic patients at Samaritan House clinics in California. The goal of this pilot project at San Mateo Samaritan House was to have staff accurately utilize the flow sheet. After
pilot completion, a staff survey provided valuable feedback and recommendations for
improvements necessary prior to expansion of the project to the Redwood City Samaritan House
clinic. Key words: diabetes, diabetic core measures, diabetes prevention, evidence-based
Section II: Introduction
Background Knowledge
Annually diabetics spend in excess of 3 million hospital days and over 15 million
appointments with health care providers (Agency for Healthcare Research and Quality [AHQR],
2011a). Since 1980, the number of hospital patients discharged with type II diabetes has doubled (Department of Health and Human Services [DHHS], 2010). Type II diabetes accounts for 90 to
95 percent of the diabetes cases in the United States, is the seventh leading cause of death, and is a principle cause for hospitalization (AHRQ, 2011a; CDC, 2011; Healthy People 2020, 2013; National Heart Lung and Blood Institute [NHLBI], 2011). The estimated indirect and direct costs
of type II diabetes is $174 billion a year (CDC, 2011). Complications of type II diabetes include hypertension, nervous system disease, blindness, heart disease, kidney disease, amputations,
periodontal disease, and increased susceptibility to other illnesses (AHRQ; 2011b; CDC, 2011; National Institute of Health [NIH], 2013; World Health Organization [WHO], 2013).
The CDC (2011) stated that type II diabetes affects 8.3 percent of Americans, including
11.3 percent aged 20 years or older. Furthermore, 7 million people with type II diabetes are not aware that they have the disease anda small portion of those affected actually receive effective
preventative care (CDC, 2011; Healthy People 2020, 2013; Knowler, et al., 2009; NCQA, 2013a). An estimated 4,300 to 9,600 annual deaths from diabetes in the United States could be prevented if every diabetic received quality health care (AHRQ, 2011b). Healthcare providers
can reduce complications and hospitalizations of diabetics by controlling patients’ glucose levels and blood pressure, as well as decreasing obesity (CDC, 2011; NIH, 2013). With timely and
Clinical practice guidelines are statements with recommendations to optimize treatment,
promote prevention, and assist providers in giving the best possible care (IOM, 2011; Green, Gazamararian, Rask, and Druss, 2010). The National Committee for Quality Assurance (NCQA) in conjunction with the American Diabetes Association (ADA) have established clinical practice
guidelines that can be incorporated into a flow sheet for primary care practitioners in order to assist them in managing, and sustaining the best outcomes for type II diabetics. A diabetic flow
sheet supplies healthcare providers with a one page visible cue that summarizes where the client is at in their treatment and response to treatment, as well as documentation every time a client arrives for an appointment (White, 2000). Diabetic flow sheets have been found to be valuable
tools in the charts of all diabetic patients both for the purpose of documenting past lab values, exam results, in addition to reminding providers to order upcoming labs and specialty exams
(Cole, et al., 2009; Hahn, Ferrante, Crosson, Hudson, & Crabtree, 2008; Hempel, 1990; Lewis, Sobel, & DelPizzo, 2004; Lin, Hale, & Kirby, 2007; Moharram & Farahat, 2008; Patasi & Conway, 2008; Ruoff & Gray, 1999 ).
Local Problem
California has the largest number of undocumented immigrants in the country (Johnson
& Hill, 2011). The Congressional Budget Office (CBO) (2014) estimated that the 54 million non-elderly uninsured unauthorized immigrants as of 2014 will rise to 57 million by 2024. Samaritan House clinics are the largest social service agencies in San Mateo County and provide
known in California as Covered California, millions of undocumented immigrants will remain
uninsured as the ACA does not cover them (Howland, Pegany, Coleman, & Connolly, 2014). Samaritan House has already established itself as a freestanding non-profit organization that emphasizes dignity and respect with the aim to leverage community resources to meet the
needs of underserved people in the community at no cost to the client (Samaritan House, 2013a). Samaritan House clinics have attempted to fill the gap in healthcare access by serving
approximately 9,000 patients annually, which represents about 3,500 active patients between San Mateo and Redwood City Samaritan House clinics (Samaritan House, 2013a). As of 2014, the administrators at Samaritan House estimate that their staff provides health care for a total of 400
type II diabetic patients (200 at each clinic). Samaritan House currently does not have electronic medical records (EMR) and is not yet able to financially move in that direction. Therefore there
are no electronic reminders for staff in regards to making sure quality core measures related to type II diabetes are being maintained. A one-page EBPDFS would serve as a quick reference for staff that are caring for type II diabetic patients.
Samaritan House’s mission is to preserve dignity, promote self-sufficiency, and provide hope and supportive services to all members of its community (Samaritan House, 2013a). This
mission aligns well with the vision and mission of the University of San Francisco (USF) School of Nursing and Health Professions (see Appendix B), and its core values (see Appendix C ). Doctor of Nursing Practice (DNP) students at USF are trained to be well educated advanced
practice nurses that provide a moral compass to transform healthcare. DNP students are taught to be authentic transformation leaders in healthcare and to serve “human kind” with particular
through a successful evidence-based change of practice intervention that would hold promise to
expand to a second Samaritan House Clinic in Redwood City and other county clinics throughout the State of California as well as across the United States. This intervention could potentially be adopted by many health care agencies and impact healthcare at a state and later a national level,
allowing all type II diabetics in the United States to gain access to quality healthcare.
Intended Improvement
This DNP student was prompted to streamline the documentation of the type II diabetes patients out of frustration from personal experience in observing fellow healthcare providers over the years spending increasingly more time going through pages of a patient’s paper chart prior to
appointments to understand where the patient was in their treatment. Only after meeting with administration was it realized the intended quality improvement (QI) project would not only
benefit the patients but could also increase staff satisfaction and possibly lead to increased funding if NCQA recognition was attained.
Prior to the implementation of the EBPDFS, Samaritan House Clinics did not have a flow
sheet or organized system to track the adult type II diabetic patients. Chart audits conducted by the DNP student in January 2014, demonstrated increase fragmentation of care over time and
lack of performance in NCQA guidelines specific to three diabetic core measures: documentation of body mass index/obesity, blood pressure control, and hemoglobin (HA1c).
The overall aim of this project was to pilot an EBPDFS at San Mateo Samaritan House
clinic that will be evaluated and if found effective, expanded to the Redwood City Clinic. The goal of this project was to streamline care for the uninsured type II diabetic patients at Samaritan
scheduled. Specifically the objective of this pilot project was that 50% of the flow sheets would
be accurately completed by staff. The question this test of change project is trying to answer is whether an EBPDFS will be advantageous in streamlining care, saving healthcare providers’ time, and enhance documentation, coordination and satisfaction when providing care to type II
diabetic patients.
Review of Evidence
A comprehensive search for evidence was conducted at Stanford University’s Lane Medical Library using PubMed, CINAHL, Cochrane, Medline, Scopus, and DARE. Search terms included diabetes, type II diabetes, diabetic core measures, diabetes prevention, QI, flow
sheets, algorithms, decision trees, and continuity of care. The search was limited to publications
from 1990 to the present, English only, but included evidence outside of nursing. Although the
search yielded many articles however twelve articles were chosen for this review of evidence based on quality and rigor. The strength and quality of the evidence was then appraised. The strength of the evidence was rated using the hierarchy of evidence developed by Melnyk and
Fineout-Overholt (2011) and the quality of the evidence was rated using the Johns Hopkins Nursing Evidence-Based Practice appraisal summary tool (JHNEBP) Dearholt and Dang (2012).
Melnyk and Fineout-Overholt describe seven levels for strength of evidence. Level I is the strongest evidence which includes systematic reviews and random control trails whereas level VII is the weakest and includes expert or group opinions/comments (see Appendix D). The
JHNEBP rates the quality of the evidence from A to C: A= high quality, consistent results; B= good quality, reasonable consistent results; C= Low quality, with major flaws, inconsistent
Benefits of nurses in primary care. Prior to the Institute of Medicine (IOM) report
(IOM, 2010) that called for nurses to expand their role to the fullest extent of their license, Laurant et al. (2005) conducted a systematic review in which 4,253 articles from 1966 to 2002 were consolidated down to 25 articles and 16 studies that compared nurses to physicians in
process care outcomes. Their review demonstrated that nurses, clinical nurse specialists, and NPs can provide similar high quality outcomes in the primary care setting compared to physicians in
the caring of chronic disease management. Furthermore, it found that when treatment was lead by nurses there was increased satisfaction by patients.
Ohman-Strickland et al. (2008) conducted a cross-sectional study using 46 family
medicine practice sites on the East Coast and concluded that family practices that employed NPs met diabetic core measures better than physician only practices in assessing HA1c levels (66
percent vs. 37 percent) and lipid levels (80 percent vs. 37 percent) (P < or = .007 for each). Shaw et al. (2014) provided a systematic review of almost 3,000 studies over a duration of thirty-five years evaluating nurse managed protocols. They determined that in the outpatient
setting nurse managed protocols, compared to usual care, had a positive impact on the management of chronic diseases including diabetes. These evidence-based practice studies
demonstrate the value of nurses and/or advanced practice nurses in the primary care setting. Diabetic flow sheets. Much of the literature showed that diabetic flow sheets can
improve adherence to guidelines and enhance quality of care for type II diabetics (Bradley,
Oberg, Calabrese & Standish, 2007; Cole et al. 2008; Hahn, et al. 2008; Hempel, 1990; Lewis, et al. 2004; Lin, Hale, & Kirby, 2007; Moharram & Farahat, 2008; Ohman-Strickland et al. 2008;
studies varied in size from a study by Lin et al. (2007) with a small sample size (N = 33,
intervention group and N= 35 control group) to a study by Hahn et al. (2008) with a very large randomized control trial (RCT) at 54 sites with 1,016 type II diabetics. Most of these studies used evidence-based guidelines and flow sheets, such as the National Diabetes Advisory Board
(NDAB) and National Diabetes Guidelines (Hahn, et al., 2008; Hempel, 1990), ADA (Cole, et al., 2009; Ohman-Strickland, et al., 2008; Ruoff & Gray, 1999), and Canadian diabetic
guidelines (Moharram, & Farahat, 2008; Patasi & Conway, 2008). White (2000) developed his own flow sheet with the assistance of providers. Sites in these studies varied from community-based ambulatory care (Hempel, 1990; Patasi & Conway, 2008; Ruoff & Gray, 1990) to family
medicine and primary care (Hahn, et al., 2008; Lin et al., 2007; Ohman-Strickland, et al., 2008; Patasi & Conway 2008). Some studies were conducted internationally, with one in Saudi Arabia
(Moharram & Farahat, 2008), and two in Canada (Lin, et al., 2007; Patasi & Conway, 2008) while the others were within the United States, most were on the east coast.
This review of evidence revealed strengths and limitation of the studies evaluating the
benefits of a diabetic flow sheet for type II diabetics. Most of the studies demonstrated
improvement in documentation, education, and/or increased adherence in meeting quality control
adult type II diabetic measures (Hahn, et al., 2008; Lin, et al., 2007; Moharram, & Farahat, 2008; Ohman- Strickland et al., 2008; Patasi & Conway 2008; Pastel, 2009; Willens et al., 2011; Hempel et al., 1990) and improved documentation of education and specialty referrals (Ruoff &
Gray, 1999)
Diabetic flow sheets and patient outcomes. Lewis et al. (2004) and Hahn et al. (2008)
participating Delaware primary care practices to an intervention group and a usual care control
group. This study that was done in two phases (phone surveys followed by chart reviews). The intervention group was given feedback on rates of compliance in regards to diabetic outcomes and received education on quality improvement from the Delaware Health Commission (HCC)
on the use of the flow sheet and their ability to meet the diabetic practice guidelines during the two year project. Patients with flow sheets were 1.5 to 3 times more likely to have key tests done
in a timely manner (HA1c, lipids, urinalysis, foot and eye exams). Hahn et al. (2008) confirmed
the work of Lewis et al. (2004) through retrospective review of more than 1,000 medical records and demonstrated that the use of a flow sheet that followed the National Diabetes Guidelines was
associated with a higher mean guideline adherence score for assessment (55.38 vs. 50.13, P =.02) and treatment (79.59 vs. 74.71, P=.004), but not for diabetes outcomes (e.g. HA1c level, blood
pressure, and cholesterol level). Authors reminded readers that not all of the charts had the flow sheets and furthermore advise exploring physician and patient variables that affect adherence. The authors concluded that a diabetic flow sheet can promote better adherence when it comes to
assessment and treatment of diabetes and increase the chances of adherence to guidelines. They reported that by creating structure care processes for assessment and treatment of diabetes,
primary care physicians and NPs working in teams can improve diabetic patient care and clinical outcomes (Willens et al., 2011).
Assessing BMI of diabetic patients. Klabunde et al. (2014) surveyed 1,740 primary care
physicians via questionnaires. They discovered (with a 55.5 percent response rate) that 80 percent of the responding physicians reported having access to information and resources on the
importance of exercise and nutrition in their offices nonetheless only 26 percent reported
the patient’s weight is normal, overweight, or obese. This scenario mirrors the setting at
Samaritan House with only 54 percent of patients having documented BMI during the January 2014 audits. Oftentimes, healthcare providers documented weight but without EMR, the increased time it would take to go through a chart and locate a documented height left many
charts with BMI not documented. Successful implementation of this EBPDFS proposed in this project would resolve this issue.
Evidence-Based appraisal tools. DynaMed1 is a clinical reference site that provides the
latest evidence-based point of care data. Dynamed is used by healthcare providers as a resource for clinical reference tools at point of care. The Dynamed staff evaluate hundreds of medical journals a day and evaluate their relevance and scientific validity in order for conclusions to
represent the best unbiased evidence (Dynamed, 2014).
A search on DynaMed found guidelines specific for type II diabetics that addressed the
quality gaps in diabetic care that are available for clinic implementation. Many of the guidelines are familiar to healthcare providers, such as the AHRQ (2011a), American Association of Clinical Endocrinologists (AACE) (2011), ADA (2013), University of Michigan Health System
(UMHS) (2014), Harvard Medical School affiliate Joslin Diabetes Center (JDC) (2012), New York State Department of Health (NYDH) (2012), International Diabetes Federation (IDF)
(2012), and the NCQA (2013a). There were slight variances in blood pressure (BP) goals, most recommending a BP of less than 130/80, except for the ADA (2013), which recommended that blood pressure be less than 140/80. Healthy People 2020 (2013) and NYDH (2012) advised an
annual dental exam. Additional quality measures such as alcohol intake, smoking status, and
1
physical activity were addressed in some but not all of the guidelines. Through open dialog with
Samaritan House clinic administration, the NCQA diabetes guidelines were chosen because they ensured established quality control diabetic measures by the ADA and offered the ability to apply for national certification in the future.
Conceptual/Theoretical Framework
Conceptual theories and models provide structure and guidance to a change of practice
project. The Donabedian model of structure, process, and outcome in addition to Rogers’ theory of diffusion of innovations served as the framework for this project. The Donabedian model was chosen for this project not only because of its focus on quality care but also because Samaritan
House clinic was able to demonstrate an outcome (proper use of the flow sheet) that was linked with processes (education and in-servicing of multidisciplinary staff members). Rogers’s theory
of innovation was useful in guiding the interactions this DNP student had with the various members of the multidisciplinary team that lead to a successful pilot project.
The Donabedian Model. The Donabedian model is a conceptual model that provides a
framework for examining healthcare services and evaluating quality of care that can be applied in many settings (Burns, 1995; Donabedian, 1966; McDonald et al., 2007). The Donabedian
model uses structure, process, and outcome as standards to guide and monitor the progress of a QI project (Naranjo & Kaimal, 2011). All three standards are necessary for effective QI.
The first standard of the Donabedian model, structure, includes both the physical and
organizational structures of the setting. The physical structure of Samaritan House is that it is located close to public transportation (i.e. Sam Trans bus and Cal train), has wheelchair access,
rooms. The administration building is only blocks away from the San Mateo clinic therefore
management at a moment’s notice can quickly arrive at the San Mateo clinic if necessary. The organizational structure is that Samaritan House has a community-based board of directors (22 members) and strong executive leadership staff including five program directors: program
services, program operations, finance, program development, and human resources.
Administration interacts with the multidisciplinary team members who volunteer their services
for personal and passionate reasons that support the Samaritan House vision. The vision of Samaritan House is to provide a community of hope through neighbors helping neighbors and to practice dignity and respect in all actions (Samaritan House, 2013a). This evidence-based change
in practice flow sheet fits with Samaritan Houses guiding value to implement creative solutions (an EBPDFS) for the community’s unmet needs (type II diabetic patients).
The second standard of the Donabedian model, process, involves the implementation of the EBPDFS. The importance of the implementation phase and its significance to a project’s success cannot be understated (Harris, Roussel, Walters, & Dearman, 2011). In this case, the
introduction of an EBPDFS impacted and streamlined type II diabetic care plus increased multidisciplinary team members’ awareness of the type II diabetic patients’ progress. The
EBPDFS provided guidelines for annual checks and may possibly increase collaboration of multidisciplinary team members regardless of the specialty provider that the type II diabetic patient is seeing. The process offered staff the opportunity to provide the DNP student feedback
during the introduction of the change in practice flow sheet, throughout the implementation, and upon completion of this QI project.
operations to discuss the results of chart audits conducted in January 2014 and an evidence-based
change in practice flow sheet, which was then presented to the multidisciplinary team members during the April 2014 staff meeting. There was initial resistance, and consequently the DNP student allowed open dialog in order to provide a sense of ownership in the EBPDFS for the
stakeholders.
The third standard of the Donabedian model, outcome, was reviewed. There was always
the risk that staff might initially forget to document or need reminders to accept the additional work required of them to use the flow sheet. Monthly chart reviews allowed the DNP student to promptly address any issues that arose regarding incorrect or deficient documentation on the
flow sheet. Additionally post implementation staff satisfaction surveys results gave the DNP student staff feedback in regards to the EBPDFS.
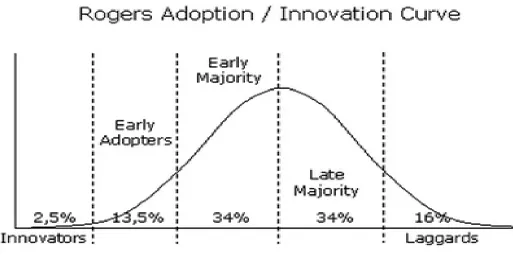
Rogers’ Diffusion of Innovations Theory. Rogers’ diffusion of innovations theory
(Haider & Krep, 2004; Rogers, 2003) has contributed to a greater understanding of behavior change including rates of adoption of innovations in this QI project. Rogers’ theory covers a
five-step process and uses a bell curve to demonstrate how change takes place in an organization and the importance of staff support for the success of a project. In Rogers’ theory, people in
different parts of the curve are named (from left to right): innovators, early adopters, early majority, late majority and laggards (see Appendix G).
In this QI project, the DNP student was the innovator at the start of the curve. The DNP
student saw the EBPDFS as an innovative opportunity to positively influence and streamline the care of the adult type II diabetic patients at Samaritan House. Early adopters are individuals who
specifically the director of program operations, who were an asset and resource for the DNP
student. The director of program operations was looked upon as a leader at Samaritan House and had already established positive long-term relationships with the staff at both clinics.
Furthermore, she demonstrated support of the DNP student’s change in practice QI project by
providing a letter of support to the University of San Francisco (see Appendix H) and facilitated the initial presentation of the QI project at the April 2014 staff meeting. After the staff meeting,
the multidisciplinary team members offered feedback, collaborated, and the early majority (the clinical advisory committee) led the late majority (the registered nurses, nursing assistants, NPs, physicians, and front-line point of care staff). Finally the laggards, mostly staff that volunteer
once a month and had less of a connection with the daily/weekly routine of the clinic, eventually came on board, but not until after the EBDFS was in all the type II diabetic charts in San Mateo
and used in daily practice.
Section III: Methods
Ethical Issues
The Belmont Report (1979) explained three ethical principles one must adhere to when carrying out clinical research: respect for person, beneficence, and justice. As more nurses
become involved in QI it is difficult to determine when an activity is a QI project not requiring institutional review board (IRB) approval (Cacchione, 2011; McNett & Lawry, 2009).
Differentiating between research and rigorous QI projects can be complicated (Arndt & Netch,
2012; McNett & Lawry 2009). As DNP programs flourish, partnerships with IRBs are important in order to determine which DNP projects are QI and which are research. If a DNP project is
Arndt and Netch (2012) and Cosco, Knopp, and Milke (2007) explained how QI is
different from research in terms of intention, burden, risk, and purpose. QI projects intend to increase performance and the efficacy of processes at a local or internal level as part of ongoing care. On the contrary, research projects intend to be generalizable, intended for the entire
scientific community in order to benefit a larger population, generate knowledge, and establish fact, independent of routine care.
QI is defined as a systematic, data-guided activity that produces immediate improvement in healthcare delivery by means of reducing a quality gap (Harris, et al., 2011). The purpose of this QI project was not to answer a research question but rather to implement a QI pilot EBPDFS
project that would be evaluated and expanded to Redwood City Samaritan House clinic. The goal of this QI project was to streamline care for type II diabetics and increase staff satisfaction
in caring for those patients through proper use of the EBPDFS.
The University of San Francisco School of Nursing and Health Professionals
(USFSONHP) requires DNP students to successfully complete three Health and Human Services
online Human Subjects Assurance training modules and print certificates upon completion so that students have demonstrated knowledge of what constitutes research and how human subjects
must be protected in research studies (see Appendix I). These modules were completed by the DNP student in July 2013. The project approval statement of determination was submitted Spring 2014 (see Appendix J) as a QI project because it met all the guidelines for an
evidence-based change in practice project and did not meet the definition of human subjects research. Therefore, the project did not require IRB approval. Permission to proceed was obtained through
Health care providers are obligated to assess conflict of interest prior to implementing a
study (Parvizi, Tarity, Conner, & Smith, 2007). Perceived and/or actual conflict of interest was evaluated and reflected upon by this DNP student and it was determined that there was no financial incentive, or bonus, for completing the project at Samaritan House, and since this DNP
student volunteered her services as a NP in their clinic, there was no personal, actual, or potential conflict of interest in leading this QI project.
Approval to proceed with the project did not absolve the DNP student of any further ethical responsibility. Strategies were implemented to maintain an ethical framework through biweekly correspondence (phone call and emailed practicum logs) with my DNP Chair at USF,
Dr. Buccheri, that included making sure an Memorandum of Understanding (MOU) was in place between Samaritan House and USF and documenting days and times of practicum hours, weekly
activities, goals, objectives, learning activities, and communication with clinic administration and team members. Dr. Buccheri provided an experienced eye for monitoring and supervising the project and offered advice and recommendations in order to maintain ethical standards and
not cross over the line into research. To maintain equitable and just care, all of the adult type II diabetic clients’ charts at San Mateo Samaritan House clinic would receive the EBPDFS. The
flow sheet imparted no health risk to patients, adhering to the ethical principal of non-malfeasance. Additionally, the privacy laws outlined in the Health Insurance Portability and Accountability Act related to oral and electronic forms of communication were maintained
(CDC, 2003).
Setting
San Mateo County who did not have proper access to healthcare. Their converted office space
clinic was originally open one night a week. However, by the end of the first year, they had to find a medical office space and recruit physicians to volunteer to meet the increased demand. The San Mateo clinic is funded by Peninsula Healthcare District foundations, corporate sponsors,
and individual gifts.
The Redwood City clinic opened in 2001 at the request of the Sequoia Hospital District
to help reduce the high volume of emergency room visits. The Redwood City clinic is funded primarily by the Sequoia Healthcare District with additional contributions from foundations, corporate sponsors, and individual gifts.
Present setting. Both San Mateo and Redwood City Samaritan House clinics are part of
the largest social service agency in San Mateo County. They are open Monday through Friday, 8
a.m. to 5 p.m., offering specialty services (i.e., gynecology, dermatology, diabetic care,
endocrinology, ophthalmology, podiatry, and nutritional counseling). The Redwood City clinic is open every other Wednesday until 9 p.m., and the San Mateo clinic is open every Monday until 9
p.m. Volunteers work as translators, nurses, nursing assistants, NPs, and physicians. Most of the volunteer staff are either retired, currently in practice, and/or volunteer their services in their
spare time. Volunteers are recruited through ads in medical staff newsletters at local area hospitals, the Samaritan House website, and through its current physicians reaching out to the
communities where they practice.
The two clinics employ eight staff members and with volunteers, healthcare providers offer primary and specialty medical and dental services. Each clinic is run with the assistance of
Mateo clinic has a paid full-time medical assistant, paid full-time clinic manager, and paid
part-time breast care clinic coordinator. The Redwood City clinic has a paid full-part-time clinic
coordinator and paid full-time medical assistant. Clients are referred from social service agencies for care, as well as word of mouth in the community. For an appointment in these free clinics,
patients must have an initial visit with either the Case Manager or Medical clinic coordinator to confirm they are not candidates for Medi-Cal or Covered California.
Both clinics are located in areas with easy access to the communities they serve, near various means of public transportation (Sam Trans and Cal train). The San Mateo Clinic is a few blocks away from the San Mateo County Hospital. Samaritan House has partnerships with local
laboratories for negotiated services. For non-urgent surgeries, “Operation Access” services are facilitated for the patients by the providers at Samaritan House. Operation Access is a volunteer
service that provides outpatient surgeries for the uninsured. Physicians and affiliated medical centers donate their time and operating room space in order for people in the community to receive needed surgical care free of charge.
There is an onsite pharmacy that covers approximately 90 percent of the prescription needs, but there are still barriers in getting some prescriptions. If the pharmacy does not have the
medication requested, staff canappeal for Samaritan House to purchase a specific medication. If the medication is too expensive or not accessible, providers have utilized the Good Rx website2 to save clients up to 80 percent on prescription costs. This website includes a cost analysis of the
local pharmacies and gives the least expensive purchase price and coupons for additional client savings. Samaritan House pharmacy maintains quality control measures through two volunteer
2
licensed pharmacists who monitor the volume of medications being used or needed, as well as
expiration dates.
Samaritan House has developed a pattern that has helped to make it successful in the community. Most of the staff are volunteers and as such, they are flexible, supportive and try to
maintain a positive work environment with their peers. Samaritan House administration appears to be a tightly coupled system while the front-line daily activities seem loosely coupled. The
concept of coupling in an organization was first written by American organizational theorist Karl Weick in 1976. Nelson, Batalden, and Godfrey (2007) clarified Weick’s concept and explained how tight and loose coupling differ in system characteristics. For loose coupling, the system is
partially self governing, the system shifts from structure to process, has many leaders, sometimes coordination and control can be problematic, and stability is based on individuals and subgroups.
In tight coupling, the system is dependent, has few leaders, individuals and subgroups maintain stable coalitions, boundaries are clear, and there is a focus on structure (Nelson et al., 2007).
Samaritan House has clearly defined leaders (five) on the executive board (chief
executive officer, a director of programs and services, a director of programs operations, a director of finance, and a director of human resources) that maintain the structure, boundaries,
and rules of the organization through tight coupling. Everyday clinic work consists mostly of volunteers and although they have no financial incentive to be there, they take responsibility for their work and actions. Shifts run fluidly, professional boundaries are maintained and
multidisciplinary team members are almost an open subgroup system and could be described as loose coupling. Team members are autonomous but work together. They are flexible enough that
jump in and escort the next patient to the intake station, take vital signs, height, and weight, and
set the patient up for the exam. This loose coupling subgroup ( front line staff/primary care providers ) are only successful because administration has a tight coupling style in regards to Samaritan Houses core values of caring for those in need that trickles down to ensure compliance
in quality measures for the patients within the organization.
System changes that need to be addressed are typically brought up at monthly staff
meetings. Staff can notify administration of agenda items in person or via email. Administration interfaces often with front-line staff. There is a genuine caring for all the volunteers because without them, the success of the clinics would be questionable. Once a year, Samaritan House
has a community appreciation event for all friends and volunteers of the Samaritan House as a way to thank them for their dedication and acknowledge their contributions.
Planning the Intervention
With Samaritan Houses director of program operations permission, this DNP student began the project by means of comprehensive retrospective chart audits that revealed concerning
gaps in the clinic’s ability to meet three diabetic core measures (BMI/obesity, hypertension, and poor HA1c control). This DNP student presented a review of EBPDFSs and described the
benefits of implementation in order to promote safe, efficient, and timely care for the type II diabetics. Through collaboration with the executive leadership and key stakeholders, the
administration chose the NCQA Type II Diabetic Guidelines (2012a) (Appendix K) because the
administration believed these guidelines fit the clinic needs best and would allow for national recognition in the future. This QI project offered potential long-term economic benefits to
Failure mode and effects analysis. This DNP student was proactive by utilizing the IHI
Failure Mode and Effects Analysis (FMEA) to assess and prioritize the risks of potential failures in the diabetic flow sheet project (see Appendix L) prior to implementation. Each failure mode were rated on a scale of one to 10 as to likelihood of occurrence, detection, and severity. The
lowest calculated/multiplied score would be one, and the highest score would be 1,000. This DNP student assigned a risk priority number with explanations as to what could go wrong, why
it might happen, and the consequences of each. This DNP student felt that the failure mode that should be at the top of the list was not having the flow sheet in the front of all the adult type II diabetic charts. Having the EBPDFS in the chart was essential for the project’s success. All the
other potential failures (related to use of the flow sheet or proper use of flow sheet) would mean nothing if the EBPDFS was not in the chart. This first failure mode assessment scored a 50 in
risk priority number (RPN). The RPN value tells how likely the failure mode will occur, be detected, and the severity if the failure should occur. The RPN of 50 demonstrated that if a failure occurred, it would be noticed early and resolved immediately, thus indication that the
DNP student had an excellent process in place for early detection and intervention.
The other two failure modes (i.e., staff do not use the EBPDFS and staff do not use the
EBPDFS properly) were more difficult to detect, so they received a higher score. Consultation via email on July 20, 2014 with IHI executive director Frank Federico provided this DNP student guidance to focus on steps that had the highest points and to implement interventions to decrease
this score. Having this foresight increased awareness of these risks prior to the launch. This DNP student realized that if there were additional interventions related to in-servicing and educating
occurrence and along with monthly audits, an increase in detection of proper use of EBPDFS by
staff.
Staff and customer activities. The front-line staff at Samaritan House include primary
care providers (MD/NP), unit secretaries, translators, registered nurses, and nursing assistant
staff who understand their purpose, role, and contribution on any given day at the clinic. The typical activity processes of the unit secretaries are making appointments, pulling charts, and
checking in patients as they arrive at the clinic. The nursing staff’s regular activities involve reviewing lab work, notifying the provider of abnormal lab work, escorting patients from the waiting room to the vital sign station to obtain blood pressure, pulse, temperature, height, and
weight, and then documenting these values on the history and physical sheet. For primary care providers, clients’ appointments and the intake process is supported by allowing adequate time
(30 minutes minimum) to meet with the clients.
The unit secretaries were in-serviced during summer 2014 on the location of the flow sheet, how to make copies, and where to place it in the chart when the chart was pulled the day
before an appointment. The nursing staff were in-serviced one on one by this DNP student on where to find the BMI key and/or dial device to calculate an accurate BMI and where to
document this and other information on the EBPDFS. With the addition of the flow sheet, front-line staff had additional steps (i.e., assessing and documenting BMI) in their regularly scheduled activities (height, weight and vital signs) when checking in patients, but it was aligned with their
usual workflow.
This DNP student’s role in this project was to serve as project manager, leading the
administration. The goal was that 50 percent of the EBPDFS would be accurately completed by
staff, which would streamline and enhance coordination of care for the type II diabetic population at Samaritan House.
Cost and benefit. Planning and piloting the intervention was of no cost to Samaritan
House because this DNP student used practicum hours for all of her time spent on the project. The budget presents the direct and indirect costs to sustain the project (see Appendix M). Indirect
costs of making copies and printing the EBPDFS were small because paper and the office copier were already in the clinic overhead budget. Additionally since the flow sheet extends over years the price of printing the flow sheet would not be an annual cost. Telephone, lighting, rent, and
parking were already covered by the clinic as well. The direct costs of orienting and in-servicing staff did not affect the clinic budget because it was completed during this DNP student’s
practicum hours. The estimated cost to sustain the project through 2015 and 2016 including salary is provided in Appendix M.
Kopcha (2011) conducted an earnings survey of more than 5,000 NPs and physician
assistants across the nation and found that depending on specialty area of practice, years of experience, and gender, the average wages ranged from $75,556 per year in women’s health
specialty to $132,206 per year in dermatology. A recent national online survey of NP’s (N= 2,889) and physician assistants (N= 951) demonstrated a notable increase in earnings for full time NPs to $98,817 and physician assistance to $107,268 (Wolfgang, 2014).
In order to sustain this QI project it would be important to look into funding a .2 full-time equivalent (FTE) NP position (one day a week diabetic clinic) upon pilot completion. The
States, San Jose and San Francisco (Carlyle, 2013). In order to recruit and retain an outstanding
part-time NP, a pay scale would be selected on the high end at $74.00/hour (compared to
Wolfgang NP salary of $47.50 /hour and physician assistance $51.57 /hour). This superior wage was chosen due to the geographic cost of living, as well as this position would not include
healthcare benefits and retirement. The annual cost of $30,784 for 2015 and $31,707 for 2016 is relatively low when you compare it with the average cost for one person to spend one day in the
hospital in San Mateo County is $14,238 (The Healthy Community Collaborative of San Mateo County, 2011).
Responsibility/Communication Matrix. A Responsibility and Communication Matrix
(see Appendix N) details the scope of various team members’ roles as far as what they were responsible, assisted, supported or informed during the project. Initial communication and
responsibilities were performed by this DNP student with the support of the director of program operations. As the project progressed, there was increased communication, collaboration, and delegation of responsibilities among all multidisciplinary team members (this DNP student,
administration, clinical advisory committee, and front-line staff).
Implementation of the Project
Key members involved in the decision-making and rollout were this DNP student and the director of program operations. This DNP student met with the director of program operations to present the gap analysis and EBPDFS. The DNP student received input and feedback from staff
and revised the format of the flow sheet prior to launch date. Maintaining the timelines was challenging on occasion and resulted in additional time spent trying to implement the project. As
director of program operations assured herself to be available to this DNP student, helped steer
staff at board meetings, and supported clear communication before and during the project.
This DNP student has been a Samaritan House volunteer for more than 10 years therefore acting as project manager was an easy transition and allowed the student to build on the positive
relationships that had already been developed with multidisciplinary team members. Even though one-on-one communication seems informal, it allowed feedback during regular clinic
hours, was effective in attaining support of an interested front-line champion, and offered valuable feedback from multidisciplinary team members.
The staff goals for this project were to educate healthcare providers on how to use and
implement the EBPDFS and to enable staff to make appropriate and timely referrals via the EBPDFS. The objectives for staff during this project were to document 50 percent of the time on
the EBPDFS with each patient appointment beginning in September 2014, and to provide feedback and improvement suggestions on the EBPDFS two months post implementation.
Planning the Study of the Intervention
Quality Improvement design. Using the Plan Do Study Act (PDSA) QI design, each of
the four phases of the project were defined to include timelines and resources (see Appendix O).
This DNP student worked collaboratively with the USF School of Nursing and Health Profession doctoral chair, Samaritan House stakeholders, and multidisciplinary team members to assume a leadership role as a healthcare professional in both the academic (USF) and community (San
Mateo County) settings.
Planning took place after the baseline audits in January 2014 when gaps were found in
would implement an EBPDFS (what) at San Mateo Samaritan House clinic (where) starting in
August 2014 (when), through the support of front-line staff and administration (how), with the goal of 50 percent use of the EBPDFS by staff (how much) with plans to evaluate the usefulness of the EBPDFS and expand to the Redwood City Samaritan House clinic.
Doing involved educating and in-servicing staff so that the EBPDFS would correctly be
placed in the charts of the adult type II diabetic patients at the San Mateo clinic and
documentation on the flow sheet would begin. This DNP student provided one on one teaching in regards to calculating BMI and asked nursing assistant staff for return demonstrations as necessary.
Studying took place one and two months post implementation during September and
October 2014. Monthly chart audits evaluated the use of the EBPDFS (i.e. whether it was in the
chart, being used, and used properly). Post-implementation surveys asked staff to evaluate the usefulness of the EBPDFS, and their satisfaction with using it and requested suggested
improvements in the EBPDFS.
Acting took place from the post-implementation chart audits and through
multidisciplinary satisfaction survey results. Adjustments were made to the flow sheet based on
staff feedback. A final version of the flow sheet with revisions and pilot project summary report was provided to the director of program operations to assist in successful expansion to the Redwood City Samaritan House clinic.
Gap analysis. This DNP student hypothesized that since both the Redwood City and San
Mateo Samaritan House clinics have similar clienteles, chart audits at the San Mateo clinic
audits at San Mateo Samaritan House revealed important feedback data prior to implementing
the project. Some of the charts could not be used, as they were for new patients with first intake appointments coming up, thus there was no data to collect. Thirty charts remained for review. Of the charts used, 31 percent were males (N= 9) and 69 percent were female (N= 21). Overall, the
ages ranged from 43 years to 74 years with a total mean age of 53.9 years. Females were 36 years to 74 years with a mean age of 54.5 years, and males were 43 years to 60 years with a
mean age of 52.5 years. Initial visits for type II diabetic patients with the healthcare providers were thorough, comprehensive, and provided appropriate and timely referrals. However, over time, chart audits revealed there was increased fragmentation of care and gaps in meeting key
type II diabetic core measures.
Audits revealed obesity across the board (see Appendix P) with BMIs of up to 45 percent.
Almost half (N= 14) of the patients’ charts did not have BMI documentation. Of the documented patients, only two (N= 2) were in the normal BMI range. Others were defined as overweight with a BMI of greater than 25 to 30 (N= 4), or obese with a BMI of greater than 30 (N= 10). Of note
in the undocumented BMIs, there appeared to be sizeable weights, ranging from 143 lbs. to 297 lbs. where N= 10 patients weight ranged from 172 lbs. to 297 lbs. Without height information in
the chart, BMI could not be calculated to declare that subjects were overweight or obese, but the data led the DNP student to be suspicions of obesity with the high weight ranges. Shamseddeen, Getty, Hamdallah, and Ali (2011) and Tobias et al. (2013) have established a relationship
between obesity, BMI, and diabetes.
The NCQA blood pressure quality guideline goal adopted for this project was for diabetic
elevated systolic and diastolic BP levels (see Appendix Q). More than half of participants (N=16,
53 percent) had a systolic BP greater than 140 to 170. Thirty-seven percent (N= 11) had a diastolic BP greater than 80 mm Hg. This was of concern since type II diabetics that have hypertension double their risk of cardiovascular disease (American Heart Association (AHA),
2012).
The NCQA goal is for HA1c is less than 7 percent to be viewed as good control and less
than 8 percent as fair control. The HA1c chart audits (see Appendix R) revealed ranges from 6.0 percent to 12.4 percent. Twenty-three percent (N= 7) of the patients had HA1c levels of less than 7 percent and 20 percent of the patients (N= 6) had HA1c of less than 8 percent. Fifty-seven
percent of the patients (N=17) had HA1c levels greater than 8 percent and of these 17 patients, 10 patients had HA1c levels between 10 and 12.4 percent, indicating poor control.
Evidence-based literature has shown that glycemic control decreases complications and hospitalizations (The Diabetes Control and Complications Trial [DCCT], 1993; EDIC, 1999; UKPDS, 1999), which in the long-term can help to curb the financial impact of this disease.
GANTT. Successful implementation starts with an executable work plan (Harris et al.,
2011). A work breakdown including milestones and deliverables is provided in a Gantt chart (see
Appendix S). In December 2013, this DNP student met with the director of program operations for support and permission to perform chart audits to execute a gap analysis. This DNP student met with the director of program operations and began addressing a possible change in care
project that could lead to healthcare improvements for the type II diabetic patients and increased satisfaction for staff in caring for these patients. The retrospective chart audits conducted January
In April 2014, results of the January 2014 audits were presented at the monthly Samaritan
House staff meeting, along with the EBPDFS. The majority of staff seemed to understand the advantages of implementing an EBPDFS, but some staff were conflicted about the EBPDFS format. The clinical advisory committee asked to suspend the implementation of the flow sheet
in order to gather feedback and make recommendations for improved format changes.
Throughout the life of a project, it is essential to revisit the strategy and make modifications as
needed (Harris et al. 2011).
This situation in which the clinical advisory committee wanted involvement in the EBPDFS was a perfect example of Tuckman’s storming stage and demonstrated the importance
of halting the project to complete Tuckman’s five stages (forming, storming, norming,
performing, and adjourning) in order to develop a more effective and cohesive team (Larson and
Gray, 2011). Harris et al. (2011) explains the importance of team members getting through Tuckman’s stages as essential for a successful project
Forming took place in January 2014 when the DNP student met with administration and
decided on the diabetic QI project. The NCQA diabetic guidelines were chosen by administration and supported by this DNP student. This DNP student with administration support was able to
raise the level of excitement among front line staff prior to the start of the project.
Storming occurred at the April 2014 Samaritan House staff meeting when the EBPDFS
was presented by the director of program operations. Some staff had strong opinions about the
flow sheet format, signifying that conflict was rising among staff. Instead of losing team support and trust, administration and this DNP student decided to help move the team to the next step
Norming began taking place at the end of the April staff meeting when the clinical advisory committee asked and received permission from administration to have open feedback over the subsequent few months with staff in order for ideas to be shared and decide on format changes that staff would agree upon. This allowed for open exchange and shared involvement in
the format of the EBPDFS. In this situation, it proved difficult for the DNP student to step back, extend the timeline of the project, and wait to see if the team members could work together and
agree on a resolution. In June, July, and August, the clinical advisory committee continued
norming as the format of the EBPDFS continued to evolve. Due to USF’s academic deadlines,
this DNP student had to meet with clinic administration and ask permission to begin performing
the pilot project in San Mateo while allowing the council to continue its work on format changes. This DNP student took the guidance of Harris et al. (2011) to implement a small-scale
project over a “big bang approach” (p. 85). Therefore, the decision was made with my DNP Committee Chair that San Mateo Samaritan House was an optimal site to pilot the EBPDFS because per Harris et al. (2011), reaction time will occur quicker on a smaller scale and staff
confidence in the tool and understanding of the importance of the project can progress with time. This scenario would support successful expansion of the project to Redwood City at a later time.
In the end, multidisciplinary team members were asked to work collaboratively, make referrals as necessary, and document on the EBPDFS in order to have the most up-to-date data available for the next provider that saw the patient.
Methods of Evaluation
Post implementation monthly chart audits were the instrument of choice to gather the
(electronic and paper) using a five-point Likert-type agreement scale offered usefulness of the
EBPDFS and valuable feedback with suggested improvements prior to expansion to the
Redwood City clinic.
Strengths, Weakness, Opportunities, and Threats. A Strengths, Weakness,
Opportunities, and Threats (SWOT) analysis was conducted to identify internal and external aspects that may affect this QI project positively or negatively (see Appendix T). The strengths
of the project were the support of the clinic staff and executive leadership administrators. Weaknesses of the project were that the clinic did not have EMR. Opportunities included decreasing providers’ time going through charts, decreasing fragmentation of care, and with
successful completion, the opportunity to apply for national recognition. A threat was having only one DNP student (NP volunteer) as the project manager who was not employed full-time by
Samaritan House, which is important for consistency and communication. Additionally, there was no trained NP replacement for the project leader, therefore fewer opportunities to promote change with staff when the DNP student was not present.
Return on investment. The return on investment (ROI) for this QI project will be
difficult to measure initially upon pilot completion, but over time, there will be the potential for
more measurable outcomes. ROI can be based on assumptions as well. The over-arching assumption in this project will be that streamlined care for the adult type II diabetic clients will increase compliance to the diabetic core measures and will improve follow-up, thereby
decreasing common complications of diabetes. Another assumption is that with the success of the EBPDFS, interdisciplinary team members will spend less time going through charts prior to
emergency room visit or hospitalization for an uninsured Samaritan House client, there will be
cost savings to both the individual and San Mateo County. Finally, this QI project will be expanded to the Redwood City clinic and will then be known as a system-wide innovative
model.
It is hoped that other free clinics will use this innovative model and consult with Samaritan House to build on this client-centered approach. It is also hoped the surrounding
counties will seek out this DNP student to facilitate building a successful adult type II diabetic management program in their county. With further success, Samaritan House can apply for and acquire NCQA recognition. NCQA recognition would demonstrate Samaritan Houses
commitment to maintaining top quality care with noted decreases in complications of type II diabetes. These improvement outcomes for the uninsured type II diabetic patients throughout San
Mateo County would decrease hospital admissions, charitable care, and potential cost to clients who cannot afford care.
Hospitalization of diabetic patients is more likely to start in the emergency department
(HCUP, 2008). The emergency room is the most expensive place to get care, and when uninsured clients choose the emergency room, it has a ripple effect on the cost of care for
everyone (Blue Shield of California, 2014). Authors (The American College of Emergency Physicians, 2014; Himmelstein, Thorne, Warren, and Woolhandler, 2009; LaMontagne, 2013; and Robert Wood Johnson Foundation, 2014) report that the number one reason for individual
bankruptcy is due to unpaid medical expenses. Samaritan House’s 2013 annual report stated that many of its clients are one paycheck away from homelessness and any medical emergency would
initiating this QI intervention would not only be important for improvement in diabetic core
measures, but also for potentially decreasing the use of the county’s emergency rooms and/or decrease inpatient admissions for the uninsured client who cannot pay. The result will be a decrease in expenses at surrounding hospitals.These outcomes could have a huge financial
impact on individuals, their families, and the community.
Analysis
Quantitative and qualitative evidence was gathered via post-implementation charts audits (see Appendix U) and multidisciplinary staff satisfaction surveys (see Appendix V). September, October, and November chart audits assessed if the EBPDFS was present in the chart, if there
was effortless ability to find documentation, if documentation was occurring, and if documentation was correct. To decrease the variability and ensure that the project was
accomplished in an efficient and equitable manner, every week the DNP student placed the EBPDFS in adult type II diabetic charts in addition to the charts that had upcoming scheduled appointments. For the purposes of this project, all data analysis tables, appendixes, and
spreadsheets utilized Microsoft Office Excel software.
Section IV: Results
Program Evaluation and Outcomes
Prior to the start of the project, the DNP student completed courses in project
management, leadership, evidence-based practice, and financial management. However, this
knowledge base did not match the learning opportunities that came with being the project manager in an active project. Even making use of PDSA, SWOT, communication/responsibility
progressed, the DNP student realized that even when the project did not evolve as planned; the
project was not a failure but rather it opened the doors for opportunities for improvement. Unanticipated events that occurred that no one could have predicted was a leave of absence by one of the pivotal administrative stakeholders, closing the clinic due to plumbing
problems, and one of the physicians going on a medical leave. All these occurred during the time the clinical advisory committee was trying to make decisions on the format changes to the
EBPDFS. Since Samaritan House administration is small, there was no back up administrator to take over when something unforeseen like this came up. Understandably, since this administrator was a key stakeholder, timelines had to be extended again. This postponed implementation of the
project a few more weeks.
Evaluating the success of this QI pilot was twofold, including the success of the process
(conceptual) and the success of the project (operational). The starting point to evaluate the success of the process came from the multidisciplinary team members. This DNP student invited formal feedback from the multidisciplinary team members before, during, and after the launch of
the project. Informal feedback was received via email, during one-on-one conversations, and through completion of a multidisciplinary staff survey two months after implementation.
Evaluation of the success of the EBPDFS pilot project was appraised through monthly post-implementation chart audits.
Project Evolution. Implementation of the EBPDFS occurred in August 2014. This first
group of patients seen at the diabetic clinic comprised of nine adult type II diabetic patients. The population included six females aged 39 years to 76 years with a mean age 52.3 years; one was
controlled and the other two were insulin controlled. Finding a documented height in the charts
to calculate BMI took hours going through every page of the individual charts. For charts with no height on record, a sticky reminder note was placed on the EBPDFS. The goal was to have the height located in one area of the flow sheet in order to decrease staff time significantly and make
BMI documentation easier since height information changes minimally for aged adults, approximately 1 cm every 10 years after age 40 (Medline Plus, 2014).
During week two of implementation, the medical assistant (also front-line champion) pulled more charts that needed EBPDFS; these clients had a history of poor control and missed appointments. These six patients consisted of three men and three women. The men were aged
37 years to 59 years, while the women were 40 years to 54 years. The mean ages of both groups were 47 years. Two of the men were on oral agents and one was on insulin treatment. All three
women were controlled with oral agents but one had recently transitioned to insulin
administration. All clients had blood pressures below 130/80 except for one male client who was 173/88 while his HA1c was 13.8 (poor control range). Similar to the original gap analysis, all
clients were obese except for one that had a BMI of 25 (normal). This second week of charts brought to light the impact obesity has on diabetes and also when clients have barriers (personal
or behavioral) in accessing care it impacts disease control.
The DNP student decided during this second week that it would be advantageous to highlight in yellow on the EBPDFS the area where HA1c >9 (poor control) as well as BP
>140/90 (poor control). This act would bring more attention to the provider’s eye of concerning areas that need to be addressed.