Available Online at www.ijpret.com 34
INTERNATIONAL JOURNAL OF PURE AND
APPLIED RESEARCH IN ENGINEERING AND
TECHNOLOGY
A PATH FOR HORIZING YOUR INNOVATIVE WORKQRS DETECTION USING DESIGNED MATCHED WAVELET
SHARMA P1, SAINI BS2
1. M. Tech Scholar, Dr B. R. Ambedkar National Institute of Technology Jalandhar, Punjab, India.
2. Associate Professor, Dr B. R. Ambedkar National Institute of Technology Jalandhar, Punjab,
India.
Accepted Date: 04/06/2014; Published Date: 01/07/2014
\
Abstract: In this paper, QRS complex of an ECG signal has been detected with the help of
Wavelet transform using standard Fantasia database. The detection of QRS complex is the most important task in ECG signal analysis. Once the QRS complex has been identified, a more detailed examination of ECG signal including the heart rate, the ST segment, etc. can be performed. Since it reflects the electrical activity within the heart during the ventricular contraction, the time of occurrence as well as its shape provides much information about the current state of the heart. It serve as the basis for the automated determination of the heart rate for classification scheme of the cardiac cycle and often it is also used in the ECG data compression algorithms. In this paper an attempt has been made to detect the QRS complex with the help of not only existing wavelets like haar, coiflet, symlet and daubechies but also designed wavelet by proposed matching algorithm. The performance of the proposed matching algorithm is compared with the existing matching algorithms. Further an intercomparison has been made between different existing wavelet families and designed wavelet to show that the designed wavelet with the help of proposed matching algorithm is best wavelet for accurate QRS detection.
Keywords: ECG, QRS complex, Wavelet Decomposition, Wavelet Transform
.
Corresponding Author: MR. PUNEET SHARMA
Access Online On:
www.ijpret.com
How to Cite This Article:
Sharma P, Saini BS;IJPRET, 2014; Volume 2 (11): 34-55
Available Online at www.ijpret.com 35
INTRODUCTION
The QRS complex and ventricular beats in an electrocardiogram (ECG) represents the depolarization phenomenon of the ventricles and yields the full information about their behaviour. Beat detection is a procedure of ECG processing and analysis. For morphological analysis this is the reference for detection of other ECG waves and parameter measurement. Rhythm analysis requires classification of QRS and other ventricular beat detection is essential for monitoring of patient in critical heart condition.
QRS detection is a basis for ECG signal processing and analysis. Large variety of method have been proposed and used, featuring high percentages of correct detection. Nevertheless, the problem remains open especially with respect to higher detection accuracy in noisy ECG. The QRS detection by using wavelet transform is a very novel approach in which standard wavelets are used. The idea of using designed wavelet for QRS detection is new. Chapa et al. [1] proposed an algorithm for designing matched wavelet to an orhonormal signal. Thakor et al. [2] have used the band pass filter to maximize the signal (QRS complex) to noise (T-wave, 60 Hz, EMG etc) ratio to detect the QRS complexes. Due to the inherent variability of ECG from different subjects as well as variability due to noise and artifices the filter design is suboptimal in specific situations. wavelet. Surez KV et al. [3] proposed an approach base on “geometrical matching" rule evaluated using a decision function in local-moving window procedure. Chio-in-ieong et al [4] presented a novel ECG heart beat detection algorithm combining mathematical morphology operations and Quadratic spline wavelet transform for hard-wired realization.
This paper is organized as follows: Section 2 contains background on the ECG features. Section 3 contains the proposed optimal wavelet matching algorithm. Section 4 gives the simulation
results obtained with the help of standard wavelets like haar, coiflet, symlet, daubechies and
designed wavelet. The results obtained are then compared to find the optimal wavelet for QRS detection. Finally the paper is closed with a summary and conclusion.
MATERIALS AND METHOD
The heart is a muscular organ with a circulatory system that is responsible for pumping blood
Available Online at www.ijpret.com 36 series of electrical discharges from specific localized nodes within the myocardium (cardiac muscle). These discharges propagate through the cardiac muscle and stimulate contractions in a co-ordinated manner in order to pump deoxygenated blood via the lungs (for oxygenation) and back into the vascular system. The physical action of the heart is therefore induced by a local periodic electrical stimulation. As a result of the latter, a change in potential of the order of 1mV can be measured during the cardiac cycle between two surface electrodes attached to the patient's upper torso (usually either side of the heart). This signal is known as the electrocardiogram (ECG). The essential function of the heart is to pump blood to various parts of the body. The heart has four chambers: right and left atria and right and left ventricles.
Electrocardiography (ECG) is a transthoracic interpretation of the electrical activity of the heart over a period of time, as detected by electrodes attached to the outer surface of the skin and recorded by a device external to the body. In short, electrocardiogram is a test that records the electrical activity of the heart. ECG has been used to measure the rate and regularity of heartbeats as well as the size and position of the chambers, the presence of any damage to the heart, and the effects of drugs or devices used to regulate the heart, as shown in Figure 1and 2.
Figure 1
Available Online at www.ijpret.com 37 A typical ECG tracing of the cardiac cycle consists of a P wave, a QRS wave, a T wave, and a U wave. The baseline voltage of the electrocardiogram is known as theisoelectric line. Typically the isoelectric line is measured as the portion of the tracing following the T wave and preceding the next P wave, as shown in Figure 3 and Table 1.
Figure 3
Table 1. The ECG signal parameters
Parameter Range Units
Heart Rate 60 – 100 Beats Per Minute
PR Interval 0.12 – 0.20 Seconds
QT Interval 0.39 + 0.04 Seconds
P Wave Duration 0.12 Seconds
QRS Width 0.05 – 0.1 Seconds
T Wave Duration 0.08 Seconds
The PR interval is the duration of time between the beginning of the P wave, signifying atria
depolarization, and the beginning of the QRS complex. It represents the time between the beginning of the contraction of the atrium and the beginning of the contraction of the ventricle.
Available Online at www.ijpret.com 38
represents the time of ventricular contraction and re-polarization. The ST intervalextends from
the S wave to the end of the T wave. As mentioned previously, the electric field generated by the heart is best characterized by vector quantities, however, it is generally convenient to directly measure only scalar quantities, i.e. a voltage difference (of mV order) between given points of the body. The primary signal characteristics of an ECG signal has a useful frequency range of about 0.05Hz to100Hz. For this reason, a good low frequency response is essential to ensure baseline stability and a good high frequency response is needed for attenuation of high frequency noise from other signals of biological origin.
Figure 4. Schematic representation of normal ECG
MATCHING SPECTRUM
To find a band-limited wavelet spectrum that best matches to the desired signal, the following error function subject to the constraints is minimized as
(1)
where "a" is the scale constant and ψ (w) and f (w) are the Fourier transforms of the signal and
the wavelet, respectively. We are assuming real wavelets, the amplitude |ψ (w)| and phase θψ
(w) of the wavelet spectrum ψ (w) are even and odd functions of w, respectively. [5,6,7] The error function can be written in piecewise fashion as
Available Online at www.ijpret.com 39
+
]
(2)
The inequality constraint can be rewritten in an equality form as
g(w) - q2 (w) = 0 (3)
where q (w) is an unknown real variable. The generalized cost function is written as follows
+
(4)
where λ1 (w) and λ2 (w) are the Lagrange multipliers corresponding to the constraints
respectively. Taking the derivative of (4) with respect to "a" and equating it to zero, gives the optimal value of the scale constant.[8,9] Similarly by taking the variational derivatives of the
generalized cost function with respect to function g(w) and q1(w) and setting them to zero
yields the optimal condition for the generalized cost function. The optimal conditions for the phase of the scaling function can be obtained in the similar fashion given as
+ = (5)
after setting variational derivative equal to zero and eliminating the Lagrange multipliers λ1 (w)
and λ2 (w) the equations obtained are as follows
q (w) + 2q (4π - 2w) = 0 ; 2π/3
q (w) - 2q (2w - 2π) + 2q (4π - 2w) =0 ;
4π/3
q (w) - 2q (2w - 2π) = 0 5π/3
q (w) = 0 ; 7π/3 (6)
Available Online at www.ijpret.com 40 It would be convenient if we could simply set the phase of ψ to the phase of the desired signal spectrum. However , just as in the previous section we showed that ψ has specific constraints on its amplitude similarly there are specific constraints on the structure of its phase as well. Expression for the group delay of ψ (w) in terms of the group delay of the scaling function spectrum, φ (w) is as follows
(7)
where
RESULTS
The proposed matching algorithm is applied on Fantasia database for both young and old subjects respectively. The matched wavelet obtained from proposed method as well as algorithm given by Chapa et al. [1] for particular young and old subjects respectively. The QRS detection algorithm based upon Third- level wavelet decomposition is applied on Fantasia database using existing wavelets like db2, db4, db6,db8 haar, coiflet, symlet and designed wavelet. The simulation result of Third level wavelet decomposition and detected QRS complex is shown in for particular young and old subjects respectively. The detection rate is computed and comparison is made as shown in Table (2) and Table (3) for young and old subjects respectively.
Fig 5. Matched wavelet to young subject f1y04
0 200 400 600 800 1000 1200
9 9.5 10 10.5 11 11.5 12 12.5
f1o04vs Matched Wavlets
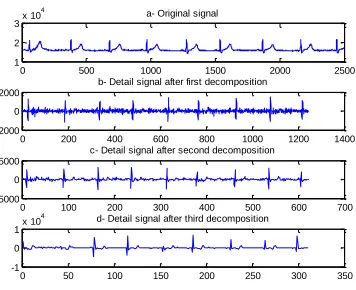
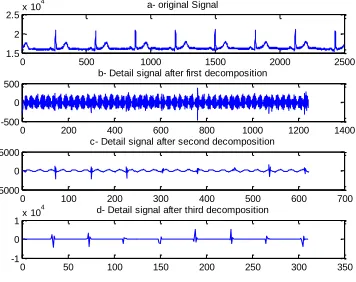
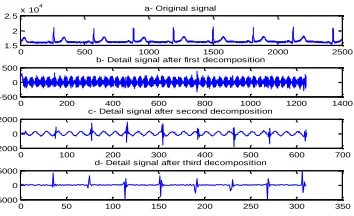
Available Online at www.ijpret.com 41 Fig 6. Third level decomposition using db2 in record f1y04 of Fantasia database.
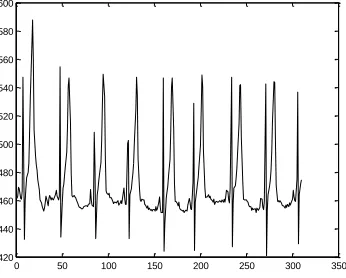
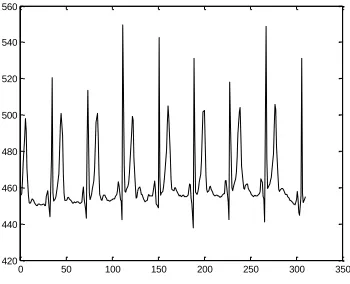
Fig 7. QRS detection at third level using db2 in record f1y04 of Fantasia database.
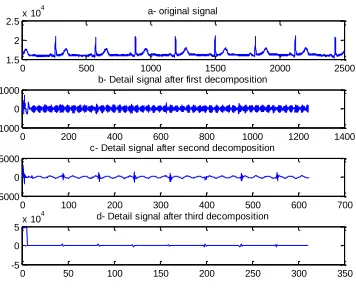
Fig 8. Third level decomposition using db4 in record f1y04 of Fantasia database.
0 500 1000 1500 2000 2500
1.5 2 2.5x 10
4 a- Original Signal
0 200 400 600 800 1000 1200 1400
-2000 0 2000
b- Detail signal after first decomposition
0 100 200 300 400 500 600 700
-5000 0 5000
c- Detail signal after second decomposition
0 50 100 150 200 250 300 350
-1 0 1x 10
4 d- Detail signal after third decomposition
0 50 100 150 200 250 300 350
420 440 460 480 500 520 540 560 580
0 500 1000 1500 2000 2500
1 2 3x 10
4 b- original signal
0 200 400 600 800 1000 1200 1400
-1000 0 1000
b- Detail signal after first decomposition
0 100 200 300 400 500 600 700
-5000 0 5000
c- Detail signal after second decomposition
0 50 100 150 200 250 300 350
-1 0 1x 10
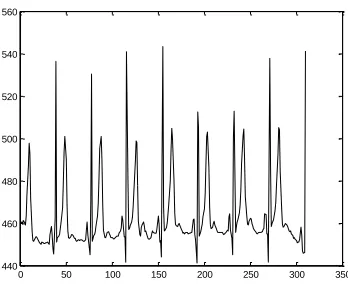
Available Online at www.ijpret.com 42 Fig 9. QRS detection at third level using db4 in record f1y04 of Fantasia database.
Fig 10. Third level decomposition using db6 in record f1y04 of Fantasia database.
Fig 11. QRS detection at third level using db6 in record f1y04 of Fantasia database.
0 50 100 150 200 250 300 350
340 360 380 400 420 440 460 480 500
0 500 1000 1500 2000 2500
1 2 3x 10
4 a- Original signal
0 200 400 600 800 1000 1200 1400
-2000 0 2000
b- Detail signal after first decomposition
0 100 200 300 400 500 600 700
-5000 0 5000
c- Detail signal after second decomposition
0 50 100 150 200 250 300 350
-5 0 5x 10
4 d- Detail signal after third decomposition
0 50 100 150 200 250 300 350
Available Online at www.ijpret.com 43 Fig 12. Third level decomposition using db8 in record f1y04 of Fantasia database.
Fig 13. QRS detection at third level using db8 in record f1y04 of Fantasia database.
Fig 14. Third level decomposition using haar in record f1y04 of Fantasia database.
0 500 1000 1500 2000 2500
1 2 3x 10
4 a- Original signal
0 200 400 600 800 1000 1200 1400
-1000 0 1000
b- Detail signal after first decomposition
0 100 200 300 400 500 600 700
-5000 0 5000
c- Detail signal after second decomposition
0 50 100 150 200 250 300 350
-5 0 5x 10
4 d- Detail signal after third decomposition
0 50 100 150 200 250 300 350
400 420 440 460 480 500 520 540 560 580
0 500 1000 1500 2000 2500
1 2 3x 10
4 a- Original signal
0 200 400 600 800 1000 1200 1400
-2000 0 2000
b- Detail signal after first decomposition
0 100 200 300 400 500 600 700
-5000 0 5000
c- Detail signal after second decomposition
0 50 100 150 200 250 300 350
-1 0 1x 10
Available Online at www.ijpret.com 44 Fig 15. QRS detection at third level using haar in record f1y04 of Fantasia database.
Fig 16. Third level decomposition using Sym10 in record f1y04 of Fantasia database.
Fig 17. QRS detection at third level using Sym10 in record f1y04 of Fantasia database.
0 50 100 150 200 250 300 350
420 440 460 480 500 520 540 560 580 600
0 500 1000 1500 2000 2500
1 2 3x 10
4 a- Original Signal
0 200 400 600 800 1000 1200 1400
-2000 0 2000
b- Detail signal after first decomposition
0 100 200 300 400 500 600 700
-5000 0 5000
c- Detail signal after second decomposition
0 50 100 150 200 250 300 350
-5 0 5x 10
4 d- Detail signal after third decomposition
0 50 100 150 200 250 300 350
Available Online at www.ijpret.com 45 Fig 18. Third level decomposition using Coif2 in record f1y04 of Fantasia database.
Fig 19. QRS detection at third level using Coif2 in record f1y04 of Fantasia database.
Fig 20. Third level decomposition using wavelet designed by algorithm given by Chapa et al. [1] in record f1y04 of Fantasia database.
0 500 1000 1500 2000 2500
1 2 3x 10
4 a- Original Signal
0 200 400 600 800 1000 1200 1400
-1000 0 1000
b- Detail signal after first decomposition
0 100 200 300 400 500 600 700
-1 0 1x 10
4 b- Detail signal after second decomposition
0 50 100 150 200 250 300 350
-5 0 5x 10
4 b- Detail signal after third decomposition
0 50 100 150 200 250 300 350
400 420 440 460 480 500 520 540 560 580
0 500 1000 1500 2000 2500
1 2 3x 10
4 a- Original Signal
0 200 400 600 800 1000 1200 1400
-1000 0 1000
b- Detail signal after first decomposition
0 100 200 300 400 500 600 700
-1 0 1x 10
4 c- Detail signal after second decomposition
0 50 100 150 200 250 300 350
-5 0 5x 10
Available Online at www.ijpret.com 46 Fig 21. QRS detection at third level using wavelet designed by algorithm given by Chapa et al.
[1] in record f1y04 of Fantasia database.
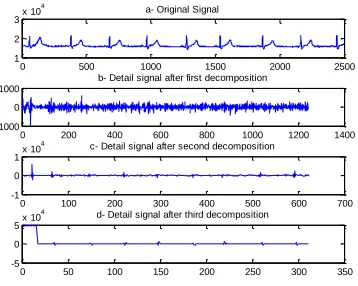
Fig 22. Third level decomposition using wavelet designed by proposed algorithm in record f1y04 of Fantasia database.
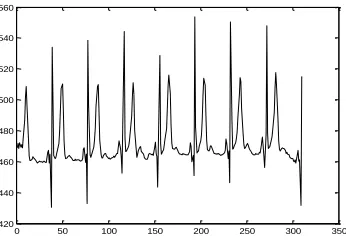
Fig 23. QRS detection at third level using wavelet designed by proposed algorithm in record f1y04 of Fantasia database.
0 50 100 150 200 250 300 350
380 400 420 440 460 480 500 520 540 560 580
0 500 1000 1500 2000 2500
1.5 2 2.5x 10
4 a- Original signal
0 200 400 600 800 1000 1200 1400
-500 0 500
b- Detail signal after first decomposition
0 100 200 300 400 500 600 700
-2000 0 2000
c- Detail signal after second decomposition
0 50 100 150 200 250 300 350
-5000 0 5000
d- Detail signal after third decomposition
0 50 100 150 200 250 300 350
Available Online at www.ijpret.com 47 Fig 24. Matched wavelet to Old subject f1o06
Fig 24. Third level decomposition using db2 in record f1o06 of Fantasia database.
Fig 25. QRS detection at third level using db2 in record f1o06 of Fantasia database.
0 200 400 600 800 1000 1200 1400 1600 1800 2000 10
11 12 13 14 15 16
f1o06 vs Matched Wavlets
fantasia database signal Proposed method Standard method
0 500 1000 1500 2000 2500
1.5 2 2.5x 10
4 a- Original Signal
0 200 400 600 800 1000 1200 1400
-1000 0 1000
b- Detail signal after first decomposition
0 100 200 300 400 500 600 700
-5000 0 5000
c- Detail signal after second decomposition
0 50 100 150 200 250 300 350
-1 0 1x 10
4 d- Detail signal after third decomposition
0 50 100 150 200 250 300 350
Available Online at www.ijpret.com 48 Fig 26. Third level decomposition using db4 in record f1o06 of Fantasia database.
Fig 27. QRS detection at third level using db4 in record f1o06 of Fantasia database.
Fig 28. Third level decomposition using db6 in record f1o06 of Fantasia database.
0 500 1000 1500 2000 2500
1.5 2 2.5x 10
4 a- original Signal
0 200 400 600 800 1000 1200 1400
-500 0 500
b- Detail signal after first decomposition
0 100 200 300 400 500 600 700
-5000 0 5000
c- Detail signal after second decomposition
0 50 100 150 200 250 300 350
-1 0 1x 10
4 d- Detail signal after third decomposition
0 50 100 150 200 250 300 350
420 440 460 480 500 520 540 560
0 500 1000 1500 2000 2500
1.5 2 2.5x 10
4 a- Original signal
0 200 400 600 800 1000 1200 1400
-2000 0 2000
b- Detail signal after first decomposition
0 100 200 300 400 500 600 700
-2000 0 2000
c- Detail signal after second decomposition
0 50 100 150 200 250 300 350
-5 0 5x 10
Available Online at www.ijpret.com 49 Fig 29. QRS detection at third level using db6 in record f1o06 of Fantasia database.
Fig 30. Third level decomposition using db8 in record f1o06 of Fantasia database.
Fig 31. QRS detection at third level using db8 in record f1o06 of Fantasia database.
0 50 100 150 200 250 300 350
380 400 420 440 460 480 500
0 500 1000 1500 2000 2500
1.5 2 2.5x 10
4 a- original signal
0 200 400 600 800 1000 1200 1400
-1000 0 1000
b- Detail signal after first decomposition
0 100 200 300 400 500 600 700
-5000 0 5000
c- Detail signal after second decomposition
0 50 100 150 200 250 300 350
-5 0 5x 10
4 d- Detail signal after third decomposition
0 50 100 150 200 250 300 350
Available Online at www.ijpret.com 50 Fig 32. Third level decomposition using haar in record f1o06 of Fantasia database.
Fig 33. QRS detection at third level using haar in record f1o06 of Fantasia database.
Fig 34. Third level decomposition using Sym10 in record f1o06 of Fantasia database.
0 500 1000 1500 2000 2500
1.5 2 2.5x 10
4 a- Original signal
0 200 400 600 800 1000 1200 1400
-2000 0 2000
b- Detail signal after first decomposition
0 100 200 300 400 500 600 700
-5000 0 5000
c- Detail signal after second decomposition
0 50 100 150 200 250 300 350
-1 0 1x 10
4 d- Detail signal after third decomposition
0 50 100 150 200 250 300 350
440 460 480 500 520 540 560
0 500 1000 1500 2000 2500
1.5 2 2.5x 10
4 a- Original Signal
0 200 400 600 800 1000 1200 1400
-2000 0 2000
b- Detail signal after first decomposition
0 100 200 300 400 500 600 700
-5000 0 5000
c- Detail signal after second decomposition
0 50 100 150 200 250 300 350
-5 0 5x 10
Available Online at www.ijpret.com 51 Fig 35. Third level decomposition using Sym10 in record f1o06 of Fantasia database.
Fig 36. Third level decomposition using Coif 2 in record f1o06 of Fantasia database.
Fig 37. Third level decomposition using Coif 2 in record f1o06 of Fantasia database.
0 50 100 150 200 250 300 350
440 460 480 500 520 540 560 580
0 500 1000 1500 2000 2500
1.5 2 2.5x 10
4 a- Original Signal
0 200 400 600 800 1000 1200 1400
-2000 0 2000
b- Detail signal after first decomposition
0 100 200 300 400 500 600 700
-2000 0 2000
c- Detail signal after second decomposition
0 50 100 150 200 250 300 350
-5 0 5x 10
4 d- Detail signal after third decomposition
0 50 100 150 200 250 300 350
Available Online at www.ijpret.com 52 Fig 38. Third level decomposition using wavelet designed by algorithm given by Chapa et al. [1]
in record f1o06 of Fantasia database.
Fig 39. Third level decomposition using wavelet designed by algorithm given by Chapa et al. [1] in record f1o06 of Fantasia database.
Fig 40. Third level decomposition using wavelet designed by proposed in record f1o06 of Fantasia database.
0 500 1000 1500 2000 2500
1.5 2 2.5x 10
4 a- Original Signal
0 200 400 600 800 1000 1200 1400
-1000 0 1000
b- Detail Signal after first decomposition
0 100 200 300 400 500 600 700
-5000 0 5000
c- Detail Signal after second decomposition
0 50 100 150 200 250 300 350
-5 0 5x 10
4 d- Detail Signal after third decomposition
0 50 100 150 200 250 300 350
420 440 460 480 500 520 540
0 500 1000 1500 2000 2500
1.5 2 2.5x 10
4 a- Original signal
0 200 400 600 800 1000 1200 1400
-500 0 500
b- Detail signal after first decomposition
0 100 200 300 400 500 600 700
-2000 0 2000
c- Detail signal after second decomposition
0 50 100 150 200 250 300 350
-5000 0 5000
Available Online at www.ijpret.com 53 Fig 41. Third level decomposition using wavelet designed by proposed algorithm in record
f1o06 of Fantasia database.
Table 2. Result of QRS detection for subject f1y04 of Fantasia database.
Type of Wavelet Actual QRS Detected QRS Detection Rate
Db2 3441 3029 88.02%
Db4 3441 3123 90.75%
Db6 3441 3437 99.88%
Db8 3441 3407 99.01
Haar 3441 3244 94.27
Coif2 3441 3429 99.65%
Sym10 3441 3389 98.48%
Designed wavelet by Chapa et al. [1]
3441 3433 99.76%
Designed wavelet by proposed method
3441 3439 99.94%
0 50 100 150 200 250 300 350 420
Available Online at www.ijpret.com 54
Table 3. Result of QRS detection for subject f1o06 of Fantasia database.
Type of Wavelet Actual QRS Detected QRS Detection Rate
Db2 3438 3125 90.89%
Db4 3438 3249 94.50%
Db6 3438 3433 99.85%
Db8 3438 3411 99.21%
Haar 3438 3278 95.34%
Coif2 3438 3417 99.38%
Sym10 3438 3398 98.83%
Designed wavelet by Chapa et al. [1]
3438 3428 99.70%
Designed wavelet by proposed method
3441 3435 99.91%
CONCLUSION
In this paper QRS complex of an ECG signal is detected with the help of existing wavelets and designed matched wavelet. The ECG signal chosen is from standard Fantasia database for both Young and Old subject. The matched wavelet is designed with the help of matching algorithm proposed by using Lagrange multiplier technique. Results obtained are compared and it is observed that the detection rate for QRS complex is best for the designed wavelet as compared to existing wavelets like db2, db4, db6 db8, haar, coiflet, symlet etc..
REFERENCES
1. M. Chapa and R. Rao, “Algorithms for designing wavelets to match a Specified signal”, IEEE
Transactions on Signal Processing, 2000, vol. 48, no. 12, pp. 3395-3406.
2. N. V. Thakor, J.G. Webster and W.J. Tompkins, "Estimation of QRS complex power spectra for
design of a QRS filter", IEEE Transactions on Biomedical Engineering, 1984,vol. 31, no. 11, pp.702-706.
3. Suarez K V, Silva JC, Berthoumieu Y, Gomis p, Najim M. "ECG beat detection using a
geometrical matching approach", IEEE Transactions on Biomedical Engineering, 2007, vol.54, no. 4, pp.641-650.
4. Chio-in-ieong, mang-ivai, peng-unmark, "ECG heart beat detection by mathematical
Available Online at www.ijpret.com 55
5. W.-S. Lu and A. Antoniou, “Design of signal-adapted biorthogonal filter banks,”IEEE Trans.
Circuits Syst. I, Funam. Theory Appl., vol. 48,no. 1, pp. 90–102, Jan. 2001.
6. M. K. Tsatsanis and G. B. Giannakis, “Principal component filter banks for optimal
multiresolution analysis,” IEEE Trans. Signal Process. vol.43, no. 8, pp. 1766–1777, Aug. 1995.
7. A. Aldroubi and M. Unser, “Families of multiresolution and wavelet spaces with optimal
properties,” Numer. Func. Anal., vol. 14, no. 5/6, pp. 417–446, 1993.
8. P. L. Shui, Z. Bao, and X. Zhang, “M-band compactly supported orthogonal symmetric
interpolating scaling functions,” IEEE Trans. SignalProcess., vol. 49, no. 8, pp. 1704–1713, Aug.
2001.
9. P.-L. Sui and Z. Bao, “Construction of nearly orthogonal interpolating wavelets,” Signal
Process., vol. 70, no. 3, pp. 289–300, 1999.
10.R. Ansari, C. Guillemot, and J. F. Kaiser, “Wavelet construction using lagrange halfband
filters,” IEEE Trans. Circuits Syst., vol. 38, no. 6, pp. 1116–1118, Jun. 1991.
11.S. Oraintara, T. D. Tran, P. N. Heller, and T. Q. Nguyen, “Lattice tructure for regular
paraunitary linear-phase filterbanks and m-band orthogonal symmetric wavelets,” IEEE Trans.
Signal Process, vol. 49, no. 11, pp. 2659–2672, Nov. 2001.
12.P. Steffen, P. N. Heller, R. A. Gopinath, and C. S. Burrus, “Theory of regular M-band wavelet