DEMOGRAPHIC RESEARCH
A peer-reviewed, open-access journal of population sciences
DEMOGRAPHIC RESEARCH
VOLUME 38, ARTICLE 35, PAGES 967–1016
PUBLISHED 15 MARCH 2018
http://www.demographic-research.org/Volumes/Vol38/35/ DOI: 10.4054/DemRes.2018.38.35
Research Article
Navigating between two cultures: Immigrants’
gender attitudes toward working women
L´ea Pessin
Bruno Arpino
c
2018 L´ea Pessin & Bruno Arpino.
This open-access work is published under the terms of the Creative Commons Attribution 3.0 Germany (CC BY 3.0 DE), which permits use, reproduction, and distribution in any medium, provided the original author(s) and source are given credit.
1 Introduction 968
2 Background 970
2.1 Contrasting theories on gender attitude formation 970
2.2 The current study 971
2.2.1 The socialization perspective and immigrants’ gender attitudes 971
2.2.2 The life course perspective and immigrants’ gender attitudes 972
3 Data and variables 973
3.1 Data 973
3.2 Outcome 974
3.3 Explanatory variables 974
4 Method 977
5 Descriptive results 978
6 Multivariate results 982
6.1 Socialization hypotheses 982
6.2 Life course hypotheses 985
6.3 Summarizing and reconciling findings 988
6.4 Robustness checks 989
7 Discussion 990
8 Acknowledgments 991
References 992
Navigating between two cultures: Immigrants’ gender attitudes
toward working women
L´ea Pessin1
Bruno Arpino2
Abstract
BACKGROUND
Gender attitudes toward women’s employment are of particular importance because they positively influence gender-equal outcomes in the labor market. Our understanding of the mechanisms that promote egalitarian gender attitudes among immigrants, however, remains limited.
OBJECTIVE
By studying first- and second-generation immigrants from multiple origins and living in different countries, this article seeks to explain under what conditions the prevalent cul-tural attitudes toward gender roles at the origin and destination influence immigrants’ gen-der attitudes. We address three main research questions. First, does the country-of-origin gender ideology influence immigrants’ views toward working women? Second, does the country-of-destination gender ideology influence immigrants’ views toward working women? And third, are these relationships moderated by (1) the immigrant generation; (2) the age at arrival in the country of destination; (3) the length of residence at the desti-nation?
METHODS
Using data from the European Social Survey, we model immigrants’ gender attitudes toward working women by using linear cross-classified models to account for clustering into the country of origin and destination.
RESULTS
The results highlight the importance of the context of early socialization in shaping im-migrants’ gender attitudes. First-generation immigrants, and more specifically adult mi-grants, hold gender attitudes that reflect more strongly the country of origin’s gender
1Population Research Institute, Pennsylvania State University, University Park, USA.
Email:[email protected].
2Department of Political and Social Sciences and The Research and Expertise Centre for Survey Methodology
culture. In contrast, the positive association between gender ideology at destination and immigrants’ gender attitudes is stronger among second-generation immigrants and child migrants.
CONTRIBUTION
We add to the literature on gender ideology formation by analyzing the influence of gen-der ideology at the origin and destination levels on the gengen-der attitudes of immigrants from 96 countries of origin and residing across 32 countries of destination.
1. Introduction
The overall trend toward more egalitarian gender attitudes is considered a clear marker of the ongoing gender revolution (Davis and Greenstein 2009). Men and women across the world are increasingly adopting egalitarian views toward gender roles, favoring equal access to employment and greater equality within the household (Cha and Th´ebaud 2009; Fortin 2005; Inglehart and Norris 2003; Treas and Widmer 2000). Wealthier and postin-dustrial societies have adopted egalitarian gender ideology at a faster pace than poorer and agrarian ones (Inglehart and Norris 2003; Seguino 2007). Nevertheless, even across European countries, which are fairly homogeneous in terms of economic outcomes and women’s legal rights, cross-national differences in gender ideology still persist (Guo and Gilbert 2012; Pampel 2011).
Gender attitudes are of particular importance because they positively influence gender-equal outcomes and behavior within families and across institutions (Brooks and Bolzen-dahl 2004). For example, gender-egalitarian attitudes foster women’s participation in the labor market (Fortin 2005) and encourage men’s contribution to housework and child care activities (Batalova and Cohen 2002; Fuwa 2004; Hook 2006; Knudsen and Wærness 2008). Recent studies also show that fertility decline and marital instability weaken in contexts where egalitarian gender attitudes prevail (Arpino, Esping-Andersen, and Pessin 2015; Pessin 2018).
By studying first- and second-generation immigrants from multiple origins and liv-ing across different countries, this article seeks to explain under what conditions the prevalent cultural attitudes toward gender roles at the origin and destination influence immigrants’ gender attitudes. We exploit variation in the migration experience to provide a better understanding of how gender attitudes are formed and whether they persist across contexts that provide different schemes of gender relations. In particular, we focus on the immigrant generation, the age at arrival at destination, and the length of residence in the country of destination to distinguish between values acquired through early socialization versus those promoted by the context of destination.
This study makes several important contributions to the literature on immigrants’ gender attitudes. First, unlike previous studies (e.g., Frank and Hou 2015; R¨oder and M¨uhlau 2014), gender ideology at the origin and destination is measured using an attitu-dinal indicator. The common approach in the literature is to measure gender relations by comparing behavioral indicators, such as the share of women in parliament or women’s relative labor force participation, to the same indicators for men. These indicators, how-ever, reflect outcomes of gender equality rather than a cultural understanding of gender relations (McDonald 2013). Second, because our study includes several countries of destination, we can explore whether both the origin’s and the destination’s cultural un-derstanding of gender roles influence immigrants’ gender attitudes.
2. Background
2.1 Contrasting theories on gender attitude formation
The existing literature on gender ideology formation can be divided into two main strands: the socialization explanation and the life course approach (Kim and Cheung 2015). By emphasizing the role played by the intergenerational transmission of beliefs and val-ues in childhood, the socialization perspective posits that gender attitudes are instilled mainly from parents to children and remain stable throughout adulthood (Myers and Booth 2002). The parent-to-children transmission of gender attitudes creates continu-ity from one generation to the next. Conversely, the life course approach argues that exposure to different beliefs in adulthood and life events can cause individuals to change their attitudes (Brooks and Bolzendahl 2004). Accordingly, living in an environment that promotes gender equality fosters the adoption of egalitarian gender attitudes and weakens the importance of values learned through early socialization (Davis 2007).
Previous research provides some empirical support for the role played by early so-cialization in shaping gender attitudes. Parents’ gender ideologies are found to directly influence their children’s gender attitudes (Davis and Greenstein 2009). Bliss (1988), for example, finds that mothers with nontraditional gender ideology have children who display more gender-neutral behaviors in kindergarten. The transmission of gender ideol-ogy from mother to child is found to be persistent during adulthood (Davis 2007; Glass, Bengtson, and Dunham 1986; Moen, Erickson, and Dempster-McClain 1997; Thornton, Alwin, and Camburn 1983; Willits and Crider 1989). Furthermore, while a majority of studies focus on maternal transmission of gender ideology, Myers and Booth (2002) show that sons are more likely to adopt gender-egalitarian attitudes if both their parents have egalitarian gender ideology. Davis and Wills (2010) also find that paternal ideology influences adolescent attitudinal formation.
2.2 The current study
We extend the socialization and the life course perspectives to immigrants’ attitude for-mation toward gender equality. We focus on how the destination and the origin provide different cultural schemes for gender relations. We contrast each theory’s predictions to discuss how each context influences immigrants’ gender attitudes. We conceptualize the origin gender ideology, (i.e., the prevalence of egalitarian gender attitudes in the country of origin) as a proxy for cultural attitudes toward gender roles at the origin. In contrast, the destination gender ideology (i.e., the prevalence of egalitarian gender attitudes among natives in the country of destination) captures the gender norms that immigrants are ex-posed to in the country of destination.
2.2.1 The socialization perspective and immigrants’ gender attitudes
According to the socialization perspective, attitudes are formed during childhood and re-main stable throughout adulthood. This implies that immigrants adopt gender attitudes that reflect the cultural attitudes of the context in which they experienced early social-ization. The distinction between the first- and second immigrant generation provides a proxy of whether immigrants experienced early socialization in their country of origin or of destination. For first-generation immigrants, the country-of-origin context is strongly influential because first-generation immigrants are predominantly exposed to the cultural attitudes of the destination country only during adulthood. For second-generation immi-grants, however, the country-of-origin effect should be weaker because they experience early socialization in the destination country. Second-generation immigrants are exposed to the country-of-origin cultural attitudes through their parents, but they are also influ-enced by the destination country’s gender relations through school and friends.
Hypothesis 1a: Cultural attitudes toward gender roles in the country of origin are positively associated with first-generation immigrants’ gender attitudes. This asso-ciation is expected to be weaker among second-generation immigrants.
Hypothesis 1b:Cultural attitudes toward gender roles in the country of destination are positively associated with second-generation immigrants’ gender attitudes. This association is expected to be weaker among first-generation immigrants.
closer to the second generation because they are involved in the context of the destination country during their formative years (Oropesa and Landale 1997; Rumbaut and Ima 1988; Rumbaut 2004). To account for variation in ages at migration within the first-generation, we refine the first set of hypotheses to distinguish between child immigrants and adult immigrants. Because of data limitations, these hypotheses can only be tested by using a subsample of the data. (Further details are provided in the Data and variables section.)
Hypothesis 2a: Cultural attitudes toward gender roles in the country of origin are positively associated with adult foreign-born immigrants’ gender attitudes. This association is expected to be weaker among child immigrants and second-generation immigrants.
Hypothesis 2b:Cultural attitudes toward gender roles in the country of destination are positively associated with child immigrants’ and second-generation immigrants’ gender attitudes. This association is expected to be weaker among adult foreign-born immigrants.
Existing findings on immigrants’ gender attitudes and behavior provide mixed evi-dence for the socialization perspective. On the one hand, some studies find a persistent effect of the country of origin on immigrants’ gender attitudes and behavior at destination. For example, Arends-T´oth and Van de Vijver (2009) find no generational differences in gender attitudes among Turkish, Moroccan, Surinamese, and Antillean immigrants in the Netherlands. Ersanilli (2012) also finds no generation gap in Turkish immigrants’ gender attitudes across three different destination countries: Germany, France, and the Nether-lands. On the other hand, other studies show that the origin effect is much weaker among second-generation immigrants (Dasgupta 1998; Diehl, Koenig, and Ruckdeschel 2009; Frank and Hou 2015; Merz et al. 2009; R¨oder and M¨uhlau 2014) and that immigrants adapt their behavior to cultural norms and behavior in the country of destination (Antecol 2000; Blau, Kahn, and Papps 2011; Hwang 2016).
2.2.2 The life course perspective and immigrants’ gender attitudes
and long-time residing immigrants are expected to have adopted the cultural norms of the country of destination.
Hypothesis 3a: Cultural attitudes toward gender roles in the country of origin are positively associated with recently arrived immigrants’ gender attitudes. The longer the length of stay at destination, the weaker the origin effect should be.
Hypothesis 3b:Cultural attitudes toward gender roles in the country of destination are positively associated with the gender attitudes of second-generation immigrants and long-time residing immigrants. The longer the length of stay at destination, the stronger the destination effect should be.
Existing findings on immigrants’ gender attitudes and behavior suggest that the in-fluence of the country of origin weakens as the length of residence at the destination increases (Frank and Hou 2015; Vargas 2016). No previous study has explicitly tested whether the destination context is more relevant among second-generation and long-time residing immigrants. Nevertheless, Huschek, de Valk, and Liefbroer (2011) find that the gender role behavior of second-generation Turks varies by country of destination. For example, second-generation Turks living in Sweden display more gender-equal behav-iors than Turks living in more conservative destination countries. This finding suggests that the context of the destination country also shapes immigrants’ gender attitudes and behavior.
3. Data and variables
3.1 Data
3.2 Outcome
In this study, we focus on one dimension of gender attitudes, namely whether individuals believe that men and women should have equal access to the labor market. To measure this concept, we use the following survey question: “When jobs are scarce, men should have more right to a job than women?” Theoretically, it is one of the few available gender items that mentions both men and women and compares how adequate their respective gender roles are.3 Another advantage of this survey question is that it has been used
ex-tensively to measure gender attitudes toward working women (Arpino, Esping-Andersen, and Pessin 2015; Arpino and Tavares 2013; Fortin 2005; Seguino 2007). Finally, from a practical perspective, this survey measure is present both in the ESS and the World Values Survey and European Values Study (WVS/EVS), which allows us to measure the same dimension of gender attitudes at the origin and the destination for a large cross-national sample. Other dimensions of gender attitudes are surveyed in the WVS/EVS, but there are no equivalents to these survey questions in the ESS.
The dependent variable of interest measures individual-level gender attitudes toward working women and is based on the survey question about equal acces to the labor mar-ket (“When jobs are scarce, men should have more right to a job than women?”). The respondents are asked how much they agree or disagree with the statement and choose their answer from a five-point Likert scale going from 1, ‘strongly agree,’ to 5, ‘strongly disagree.’4 Higher values are interpreted to be gender-egalitarian views while lower
val-ues are considered to be traditional views toward working women. The distribution of the outcome variable is illustrated in Figure A-1 in the supplementary material.
3.3 Explanatory variables
Immigrant generation: Respondents’ immigrant generation is determined by their country of birth as well as their parents’ country of birth. Second-generation immigrants are respondents that are born in the country of destination but that have at least one foreign-born parent. In our final sample, only 384 second-generation immigrants have parents who were born in two different foreign countries. (The final sample size of second-generation immigrants with both parents born abroad is 2,299.) For second-second-generation immigrants with only one parent born abroad, the country of origin is the country of birth of the one foreign parent. First-generation immigrants are respondents that are not born in the country of destination, and thus their country of origin is defined as their country of birth. (Detailed explanations are provided on how the immigrant status is determined
3See Arpino, Esping-Andersen, and Pessin (2015) for an extensive discussion on the theoretical and
measure-ment quality of existing gender items in cross-national attitude and value surveys.
4‘Don’t know’ and ‘refusal’ are coded as missing. In the original ESS sample, 2.3% of responses on this
in the Supplementary material.) The immigrant generation variable takes a value of 1 for second-generation immigrants (reference category) and a value of 2 for first-generation immigrants.
Age at arrival: The age at arrival is calculated by taking the difference between the year of arrival and the respondent’s birth year. The exact year of arrival was asked in only the fifth round of the ESS. Thus, the analysis that uses age at arrival is restricted to the fifth-round ESS sample. The age at arrival variable takes four categories: second generation (reference category), 0–12 years, 13–24 years, and 25 years+. The thresholds are based on Rumbaut and Ima’s definition (1988) of the 1.5 generation, which refers to immigrant children who arrived at the destination by the age of 12. The 1.5 gener-ation should be the closest to second-genergener-ation immigrants and natives because they have experienced middle and potentially also early childhood in the country of desti-nation (Rumbaut 2004). The 13–24 years category is exposed to the country of origin during childhood and transitions to adulthood in the country of destination. Nevertheless, according to the socialization theory, this should correspond to a life stage where atti-tudes have already stabilized. The 25 years+ category clearly captures the case of adult immigrants who arrive at the destination after their transition to adulthood is complete.
Length of stay: The length of stay in the country of destination, which we use to distinguish between newly arrived immigrants and those who have lived in the country of destination for a long time. This variable takes the following five categories: second gen-eration (reference category), more than 20 years, 11–20 years, 6–10 years, and 1–5 years. In the second and fourth rounds of the ESS, the length-of-stay variable is categorical, whereas in the fifth rounds of the ESS, the actual year of arrival was asked.5
Origin gender ideology: The variable is matched to each respondent based on their country of origin and on the survey year. The level of egalitarian gender norms in the country of origin is measured as the share of respondents in the country of origin who disagree with the statement “When jobs are scarce, men should have more right to a job than women.” The variable is calculated for the entire sample, including immigrants of any generation as well as natives. Figure 1 represents the origin gender ideology variable. The data for the country of origin relies on two sources of data: the ESS and the harmonized WVS/EVS. In the WVS/EVS, the same survey question has been asked, but the respondents are offered a slightly different scale: (i) ‘agree,’ (ii) ‘disagree,’ and (iii) ‘neither.’ As with the ESS, we use the share of people in the country of origin who disagree with the statement. To assess the consistency between both measures, we calculate the correlation between the ESS and the WVS/EVS indicators when both are available on the same country/year and we find a correlation of 0.85. Table A-3 in the Supplementary material reports the values of origin gender ideology for each country of
5 Further detailed information is provided in the Supplementary material to explain how the variable was
origin and ESS round. (Further details on how the origin gender ideology variable was constructed are provided in the Supplementary material.)
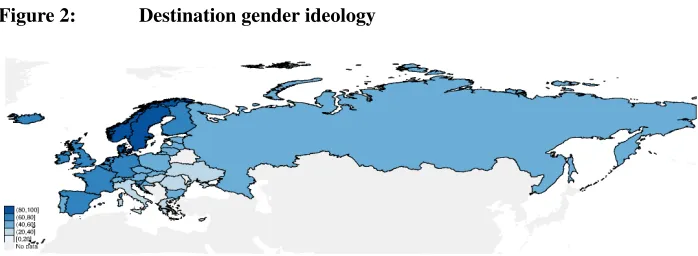
Destination gender ideology: The variable is matched to each respondent based on their country of residence and on the survey year. The level of egalitarian gender norms in the country of destination is measured as the share of natives in the country of destination who disagree with the statement “When jobs are scarce, men should have more right to a job than women.” Figure 2 represents the destination gender ideology variable. Natives are defined as respondents who are born in their country of residence and whose parents are also born in the same country of residence. Therefore, for European countries, the origin and destination gender ideology differ because the origin gender ideology includes immigrants and natives, whereas the destination gender ideology includes natives only. The variable is constructed by using the ESS data. Table A-4 in the Supplementary ma-terial reports the values of the destination gender ideology by country of destination and ESS round.
Figure 1: Origin gender ideology
Note: Origin gender ideology = % of respondents who disagree that men should have more right to a job than women when jobs are scarce within each country of origin. The origin gender ideology is calculated for the entire sample, including immigrants of any generation as well as natives. The values used for the map are summarized in Table A-3.
Figure 2: Destination gender ideology
Note: Destination gender ideology = % of natives (third generation+) who disagree that men should have more right to a job than women when jobs are scarce within each country of destination and across waves. The values used for the map are summarized in Table A-4.
Source: ESS.
Accordingly, we include the following control variables: gender, level of education, partnership status, age, and urbanity. For the gender variable, women are the reference category. The level of education is coded as four categories: less than secondary (refer-ence), lower-secondary, upper-secondary, and tertiary. Partnership status takes two dif-ferent values: partnered (reference) and without a partner. The age variable is categorized into four intervals: 15–29 (reference), 30–44, 45–59, and 60+. The urbanity measure has three categories: urban (reference), town or small city, and rural. Finally, we also include an indicator variable for the three different survey rounds used for the analysis: second round (reference), fourth round and fifth round.
At the origin and destination levels, we control for the level of economic develop-ment. We include the HDI, which is a composite measure of three dimensions of human development, i.e., life expectancy, education and economic development. As shown by Inglehart and Norris (2003), economic development is an important marker for the adop-tion of egalitarian gender attitudes.
4. Method
(Snijders and Bosker 2012). Multilevel cross-classified models allow one to partition the relative importance of the four sources of heterogeneity that we want to study (the individual level, the country of origin, the country of destination and their interaction, i.e., the community), and to test the role of macro-level variables measured in both the country of origin and of destination, as well as the community. Cross-classified multilevel analysis allows one to estimate the variability in the outcome due to the effect of countries of destination after the heterogeneity of immigrants’ origin has been controlled for, and vice versa (see Kalmijn and Van Tubergen 2010; Van Tubergen, Maas, and Flap 2004; Vitali and Arpino 2015). A multilevel linear cross-classified model can be represented as:
Yi(o,d)=Xi(o,d)β+Zoγ+Wdδ+ +Co,dθ+ei(o,d)+uo+vd+zo,d,
where the subscript i(o,d) indicates an immigrant belonging to a generic unit of the cross-classified structure, wherei= 1, 2,. . .,n(o,d);o= 1, 2,. . ., 96indicates the country of origin andd= 1, 2,. . ., 32indicates the country of destination.Y indicates the outcome. Individual, origin, destination, and community variables are identified withX,Z,W, and C, respectively. The individual error term (e), the origin (u), the destination (v), and the community (z) error terms are assumed to be normally distributed with zero mean and variance to be estimated (Snijders and Bosker 2012). These variances are of interest in this study because they measure the importance of the different sources of heterogeneity under analysis. All upper-level variables are centered on their respective grand mean.
5. Descriptive results
Table 1 summarizes the variables described in the Data and Variables section. First-and second-generation immigrants in our sample come from more than 90 countries. Therefore, we grouped respondents into larger geographical regions6in order to present the descriptive statistics in a unique table.
Table 1: Descriptive statistics by region of origin
Asia Oceania Eastern Latin Middle Northern North Europe America East Africa America
Dependent variable
Gender attitudes 3.66 3.82 3.40 3.93 3.07 3.32 3.99
Origin variables
Gender ideologya –0.21 0.20 –0.06 0.13 –0.31 –0.20 0.19
HDIb –0.14 0.11 0.01 –0.06 –0.09 –0.19 0.10
Destination variables
Gender ideologyc 0.09 –0.03 –0.04 0.06 –0.02 0.11 0.06
HDId 0.03 0.02 0.00 0.01 0.02 0.02 0.03
Individual-level variables
Immigrant generation (second gener.) 34.69 26.53 51.85 20.86 51.94 38.81 55.73
First generation 65.31 73.47 48.15 79.14 48.06 61.19 44.27
Age at arrival (second gener.)e 29.63 27.27 43.87 15.00 54.44 36.31 56.57
0–12 yrs 14.81 22.73 11.91 19.00 15.09 21.66 17.17
13–24 yrs 22.22 22.73 22.05 21.00 15.68 23.57 9.09
25+ yrs 33.33 27.27 22.17 45.00 14.79 18.47 17.17
Length of stay (second gener.) 34.69 26.53 51.85 20.86 51.94 38.81 55.73
20+ yrs 28.49 36.73 19.70 24.83 21.08 31.16 23.73
11–20 yrs 12.98 14.29 8.75 18.54 14.41 8.78 6.93
6–10 yrs 10.47 8.16 7.92 15.89 7.42 11.90 4.53
1–5 yrs 13.37 14.29 11.78 19.87 5.16 9.35 9.07
Gender (woman) 51.36 55.10 56.49 61.59 48.82 43.63 56.27
Man 48.64 44.90 43.51 38.41 51.18 56.37 43.73
Partnership status (not partnered) 51.74 51.02 60.06 52.98 57.96 53.26 60.00
Partnered 48.26 48.98 39.94 47.02 42.04 46.74 40.00
Education (<than sec.) 10.85 4.08 5.14 10.93 29.35 21.53 9.07
Lower secondary 19.38 16.33 16.72 23.18 23.12 23.80 12.53
Upper econdary 29.26 40.82 53.80 36.42 31.83 34.56 36.00
Tertiary 40.50 38.78 24.35 29.47 15.70 20.11 42.40
Age (15–29) 31.98 28.57 19.78 31.46 26.77 32.01 24.27
30–44 32.75 51.02 28.95 34.44 29.03 38.53 24.53
45–59 21.71 14.29 27.00 24.17 17.31 19.83 26.13
60+ 13.57 6.12 24.26 9.93 26.88 9.63 25.07
Urbanity (Urban) 49.22 48.98 36.50 46.03 49.57 47.31 38.40
Town or small city 31.40 24.49 36.42 29.47 30.65 29.46 29.33
Rural 19.38 26.53 27.08 24.50 19.78 23.23 32.27
ESS round (second round) 34.11 44.90 31.23 39.07 34.62 14.45 36.00
Fourth round 34.50 10.20 33.60 27.81 29.03 41.08 37.60
Fifth round 31.40 44.90 35.17 33.11 36.34 44.48 26.40
Table 1: (Continued)
Northern Post- Southern Sub-Sah. Western Europe Soviet Europe Africa Europe
Dependent variable
Gender attitudes 4.06 3.18 3.56 3.83 3.76
Origin variables
Gender ideologya 0.23 –0.09 0.05 –0.12 0.13
HDIb 0.09 –0.05 0.01 –0.27 0.08
Destination variables
Gender ideologyc 0.15 –0.10 0.03 0.12 0.03
HDId 0.04 –0.05 0.02 0.03 0.02
Individual-level variables
Immigrant generation (second gener.) 48.74 46.39 49.01 13.61 52.12
First generation 51.26 53.61 50.99 86.39 47.88
Age at arrival (second gener.)e 49.41 47.77 53.53 15.07 51.52
0–12 yrs 17.98 15.71 12.91 12.33 16.94
13–24 yrs 11.93 19.73 20.11 26.03 14.60
25+ yrs 20.67 16.79 13.45 46.58 16.94
Length of stay (second gener.) 48.74 46.39 49.01 13.61 52.12
20+ yrs 30.80 38.11 29.15 18.37 26.15
11–20 yrs 9.50 8.41 13.62 17.69 8.52
6–10 yrs 5.53 3.77 3.88 30.61 5.29
1–5 yrs 5.42 3.31 4.33 19.73 7.92
Gender (woman) 54.39 60.71 50.58 53.74 54.04
Man 45.61 39.29 49.42 46.26 45.96
Partnership status (not partnered) 57.41 55.24 59.46 44.90 60.24
Partnered 42.59 44.76 40.54 55.10 39.76
Education (<than sec.) 8.50 5.99 16.61 9.52 7.88
Lower secondary 15.99 13.79 21.31 18.37 15.23
Upper secondary 36.22 42.23 43.08 23.81 41.71
Tertiary 39.30 37.98 19.00 48.30 35.18
Age (15–29) 21.46 17.19 23.67 29.25 16.88
30–44 31.58 21.77 31.65 46.26 30.29
45–59 25.10 29.18 25.68 17.69 23.15
60+ 21.86 31.86 19.00 6.80 29.68
Urbanity (Urban) 37.56 46.70 33.59 46.94 30.63
Town or small city 30.74 34.65 34.23 40.82 28.50
Rural 31.69 18.65 32.18 12.24 40.87
ESS round (second round) 33.20 24.99 28.93 14.29 43.13
Fourth round 33.54 40.88 43.60 36.05 32.41
Fifth round 33.26 34.13 27.47 49.66 24.46
N 1,789 4,589 2,679 147 2,968
Note: gener = generation; HDI = human-development indicator; Sub-Sah. = sub-Saharan. aThe origin gender
ideology variable is centered on its grand mean (0.51). bThe origin HDI variable is centered on its grand mean
(0.80). cThe destination gender ideology variable is centered on its grand mean (0.59). dThe destination HDI
variable is centered on its grand mean (0.86).eAge at arrival can be calculated for only the ESS fifth round. Sources: ESS, WVS/EVS, UN data and National Statistics of the Republic of China (Taiwan).
egalitarian gender ideology. Descriptively, the ranking of origin gender ideology and the individual-level gender attitudes of immigrants appear to follow a similar pattern. At the individual level also, on average, Middle Eastern and North African immigrants have more traditional gender attitudes, and as expected, the opposite is true of Northern Euro-pean and American immigrants. However, there are also some exceptions. For example, Asian immigrants come from fairly traditional countries, but their gender attitudes at the destination are not among the least egalitarian.
Across countries of destination, gender ideology is on average higher than in the countries of origin and also less dispersed. This is to be expected because the countries of destination are fewer and are concentrated in Europe, and thus, represent a less diverse sample when compared to the countries of origin. When comparing the HDI at the origin and destination, we also find a similar pattern: the destination HDI (mean = 0.86) ranges between –0.15 to 0.08, and the origin HDI (mean = 0.80) takes values that range between –0.47 and 0.14. Also, thanks to the cross-classified nature of the data, we can assess the relative importance of the contextual levels in explaining immigrants’ gender attitudes. The upper-level variance is divided between the origin (2.6%), the destination (9.4%), the community (1.7%).
At the individual level, immigrants’ characteristics represent an important source of variation across regions. About half of immigrants from European, post-Soviet, and Mid-dle Eastern countries are second-generation immigrants, whereas Asia, Latin America, and sub-Saharan Africa appear to reflect more recent waves of immigration. A similar pattern extends to the age distribution, where respondents from newer regions of origin are younger than other immigrants in our sample. For example, immigrants from Latin America, Northern Africa, and sub-Saharan Africa are much younger than those from other regions of origin. The regional differences are not only important in the experi-ence of immigration (i.e., the length of stay in the country), but also in individual-level characteristics. For example, sub-Saharan immigrants have the largest share of tertiary educated respondents, ranging around 48.30%, against only 15.70% of Middle Eastern immigrants. Furthermore, immigrants from Latin America and post-Soviet countries are predominantly women.
6. Multivariate results
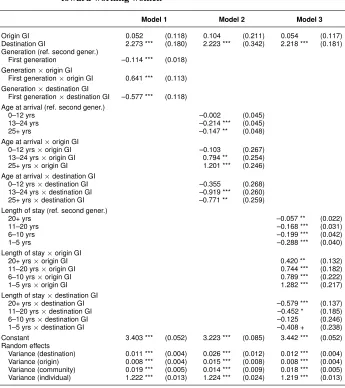
In Table 2, we present the results of three cross-classified linear regression models, which correspond to the three different sets of hypotheses discussed in the background section. Models 1 to 3 include interactions between the origin and the destination gender ideology and, respectively, the immigrant generation, the age at arrival, and the length of stay at the destination. Note that the contextual variables are centered on their grand mean so that the baseline coefficients of the interaction variables can be referred to, as in the case of an immigrant living in a destination country with average gender ideology (average des-tination gender ideology = 59%, which is similar to Austria) and coming from a country of origin with average gender ideology (average origin gender ideology = 51%, which is similar to Portugal).
For the sake of simplicity, the results in Table 2 summarize the estimated coefficients for the explanatory variables only. The control variables described in Table 2 are included in all models (results not shown but available upon request). While not shown, the associ-ations between the control variables and immigrants’ gender attitudes are in line with the literature. Higher educational attainment, being single, and coming from a country with higher levels of development positively predict gender-egalitarian attitudes. In contrast, men, older immigrants, and residents of rural areas hold more traditional gender attitudes.
6.1 Socialization hypotheses
Model 1 includes the origin and the destination gender ideology and their respective in-teractions with the immigrant generation variable. To provide further support for the socialization hypotheses, in Model 2, we use immigrants’ age at arrival instead of the immigrant generation to capture more accurately the context of early socialization. As discussed earlier, Model 2 can only be estimated for the fifth wave of the ESS. Table 2 summarizes the cross-classified multilevel linear estimation results for Models 1 and 2.
Model 1 provides empirical support for Hypothesis 1a and 1b. First, the negative co-efficient for being a first-generation immigrant suggests that, on average, first-generation immigrants hold more gender-traditional attitudes toward working women. Second, we find the interaction between being a first-generation immigrant and the origin gender ide-ology to be positive and statistically significant, which suggests that cultural attitudes at the origin have a stronger influence on immigrants who are born in their country of origin (Hypothesis 1a).
evidence that the geographic context of early socialization positively influences immi-grants’ gender attitudes.
Table 2: Cross-classified linear models: Immigrants’ gender attitudes toward working women
Model 1 Model 2 Model 3
Origin GI 0.052 (0.118) 0.104 (0.211) 0.054 (0.117)
Destination GI 2.273 *** (0.180) 2.223 *** (0.342) 2.218 *** (0.181) Generation (ref. second gener.)
First generation –0.114 *** (0.018) Generation×origin GI
First generation×origin GI 0.641 *** (0.113) Generation×destination GI
First generation×destination GI –0.577 *** (0.118) Age at arrival (ref. second gener.)
0–12 yrs –0.002 (0.045)
13–24 yrs –0.214 *** (0.045)
25+ yrs –0.147 ** (0.048)
Age at arrival×origin GI
0–12 yrs×origin GI –0.103 (0.267)
13–24 yrs×origin GI 0.794 ** (0.254)
25+ yrs×origin GI 1.201 *** (0.246)
Age at arrival×destination GI
0–12 yrs×destination GI –0.355 (0.268)
13–24 yrs×destination GI –0.919 *** (0.260)
25+ yrs×destination GI –0.771 ** (0.259)
Length of stay (ref. second gener.)
20+ yrs –0.057 ** (0.022)
11–20 yrs –0.168 *** (0.031)
6–10 yrs –0.199 *** (0.042)
1–5 yrs –0.288 *** (0.040)
Length of stay×origin GI
20+ yrs×origin GI 0.420 ** (0.132)
11–20 yrs×origin GI 0.744 *** (0.182)
6–10 yrs×origin GI 0.789 *** (0.222)
1–5 yrs×origin GI 1.282 *** (0.217)
Length of stay×destination GI
20+ yrs×destination GI –0.579 *** (0.137)
11–20 yrs×destination GI –0.452 * (0.185)
6–10 yrs×destination GI –0.125 (0.246)
1–5 yrs×destination GI –0.408 + (0.238)
Constant 3.403 *** (0.052) 3.223 *** (0.085) 3.442 *** (0.052)
Random effects
Variance (destination) 0.011 *** (0.004) 0.026 *** (0.012) 0.012 *** (0.004) Variance (origin) 0.008 *** (0.004) 0.015 *** (0.008) 0.008 *** (0.004) Variance (community) 0.019 *** (0.005) 0.014 *** (0.009) 0.018 *** (0.005) Variance (individual) 1.222 *** (0.013) 1.224 *** (0.024) 1.219 *** (0.013)
Nevertheless, the immigrant generation provides only an approximate measure of where immigrants have spent their childhood. To provide further evidence for the so-cialization argument, we replicate Model 1 using immigrants’ age at arrival instead of the immigrant generation. Model 2 appears to confirm the findings presented in Model 1. The origin gender ideology coefficient strengthens as immigrants’ age at arrival in-creases (Hypothesis 2a), while the destination gender ideology coefficient weakens as immigrants’ age at arrival decreases (Hypothesis 2b).
Figure 3: Origin and destination gender ideology and immigrants’ gender attitudes by age at arrival
Note: The predictions are based on Model 2 in Table 2. The random effects are set to zero.
at-titudes, for a one-standard-deviation change in the continuous explanatory variables, i.e., origin gender ideology and destination gender ideology.7 To appreciate the strength of the variations measured by the marginal effects, it should be kept into consideration that the outcome variable can range between 1 and 5.
Focusing first on the context of origin, Figure 3 reveals that, for second-generation immigrants and child migrants, there is barely any relationship between their gender atti-tudes and the cultural values prevalent in their country of origin (AME = 0.02 and<0.01, respectively). The origin gender culture appears to be important for only first-generation immigrants. The relationship becomes increasingly important (as demonstrated by the steeper lines) as the age at arrival at the destination increases (AME = 0.17 and 0.25 for those who arrived between ages 13–24 and 25+, respectively).
We turn to the right quadrant of Figure 3 for the destination context. Here, as pre-dicted by the socialization theory, the context of the destination has a stronger effect among immigrants who have experienced early socialization in the country of destination (AME = 0.41 and 0.34 for second-generation immigrants and child migrants, respec-tively). Nevertheless, Figure 3 also reveals that the destination gender ideology positively influences adult migrants’ gender attitudes (AME = 0.24 and 0.27 for those arrived be-tween ages 13–24 and 25+, respectively). The relationship is weaker (as demonstrated by the less steep lines) than for second-generation immigrants and child migrants but still positive and statistically significant.
6.2 Life course hypotheses
We turn to Model 3 in Table 2 to test the life course hypotheses (Hypothesis 3a and 3b). Unlike Models 1 and 2, Model 3 includes interactions between the origin and the desti-nation gender ideology variables and the length of stay. First-generation immigrants are separated into four groups according to their length of stay in the country of destination and compared to second-generation immigrants (the reference category). As with Mod-els 1 and 2, first-generation immigrants have more ‘negative’ gender attitudes (i.e., they hold more traditional attitudes) than second-generation immigrants. The estimates also show evidence of assimilation: as length of stay increases, first-generation immigrants’ attitudes become more similar to those of second-generation immigrants.
The coefficients of the interaction terms between a length of stay shorter or equal to 20 years and the origin gender ideology are positive and significant, indicating that the effect of the cultural background is stronger for those who spent less time in the
desti-7A one-standard-deviation change in the origin gender ideology is of about 0.17, which corresponds
nation country. Conversely, the coefficients of the interaction term between the length of stay categories and the destination gender ideology are negative, suggesting that cultural attitudes at the destination play a weaker role in explaining the gender attitudes of more recently arrived immigrants. Nevertheless, the interaction coefficients do not suggest any clear trends with regard to exposure and are not statistically significant for a length of stay shorter than ten years.
Figure 4: Origin and destination gender ideology and immigrants’ gender attitudes by length of stay
Note: The predictions are based on Model 3 in Table 2. The random effects are set to zero.
6.3 Summarizing and reconciling findings
Overall, Models 1 and 2 present robust evidence for the socialization hypotheses. The results suggest that gender attitudes toward working women among first-generation im-migrants primarily reflect gender norms in their country of origin (Hypothesis 1a). More specifically, this finding holds true for immigrants who migrated as adults (Hypothesis 1b). Furthermore, Models 1 and 2 show that the context of the destination has a stronger effect on second-generation immigrants (Hypothesis 1b) and child migrants (Hypothesis 2b). As illustrated in Figure 3, we observe distinctive patterns of association between the origin and the destination contexts and immigrants’ gender attitudes according to where they lived during childhood. Nevertheless, our findings, as illustrated by Model 3, also provide partial support for the life course hypothesis: the longer the length of stay at the destination, the weaker the origin’s influence on immigrants’ gender attitudes.
Our findings support both the hypotheses that early age at arrival and increased length of stay at the destination moderate the relationship between the origin gender ideology and immigrants’ gender attitudes. Empirically, however, there is an overlap between age at migration and the length of stay at the destination. For example, about 45% of long-residing immigrants (20+ years) migrated as children (0–12 years old), and 60% of recently arrived migrants (1–5 years) migrated as adults (25+ years old).
Because our data is cross-sectional, we cannot fully disentangle the effects of age, age at arrival, and the length of stay at the destination. While imperfect, we provide one additional test to attempt to distinguish between the socialization and life course perspective. We replicate the models presented in Table 2, restricting the sample to first-generation immigrants in the ESS fifth round. We include in the model the interactions between the origin and the destination gender ideology and both age at arrival and the length of stay.8 As illustrated by Table 3, when including both interactions, only the moderating effect of age at arrival remains statistically significant. These findings give further support to the early socialization hypothesis rather than the life course perspective.
8The respondent’s age is excluded from the model because it would be multicollinear with age at arrival and
Table 3: Cross-classified linear models: Immigrants’ gender attitudes toward working women
Model 1
Origin GI –0.260 (0.304)
Destination GI 1.752 *** (0.468)
Age at arrival (ref. 0–12 yrs)
13–24 yrs –0.251 *** (0.057)
25+ yrs –0.233 *** (0.064)
Age at arrival×origin GI
13–24 yrs×origin GI 0.756 * (0.326) 25+ yrs×origin GI 1.075 ** (0.341) Age at arrival×destination GI
13–24 yrs×destination GI –0.642 + (0.328) 25+ yrs×destination GI –0.627 + (0.351) Length of stay (ref. 20+ yrs)
11–20 yrs 0.042 (0.064)
6–10 yrs 0.138 (0.088)
1–5 yrs 0.066 (0.089)
Length of stay×origin GI
11–20 yrs×origin GI 0.456 (0.343) 6–10 yrs×origin GI 0.509 (0.410)
1–5 yrs×origin GI 0.572 (0.411)
Length of stay×destination GI
11–20 yrs×destination GI 0.174 (0.352) 6–10 yrs×destination GI 0.654 (0.467) 1–5 yrs×destination GI 0.137 (0.484)
Constant 3.109 *** (0.102)
Random effects
Variance (destination) 0.039 *** (0.019) Variance (origin) 0.020 *** (0.013) Variance (community) 0.003 (0.012) Variance (individual) 1.273 *** (0.035)
Observations 2863
Note: Standard errors in parentheses. GI = gender ideology. Controlled for gender, education, urbanity, partnership status, age, origin HDI, destination HDI and ESS round (not reported). Sample: First-generation immigrants in the ESS fifth round. + p<0.10, * p<0.05, ** p<0.01, *** p<0.001.
6.4 Robustness checks
variable. Second, we re-estimate the main models, using the father’s country of birth instead of the mother’s country of birth. Third, we include additional control variables at the individual level (i.e., religious denomination and mother’s employment) and at the destination level (i.e., the share of women in parliament and the women-to-men labor force participation ratio). Fourth, we exclude first-generation immigrants who have both parents born in the country of destination because their socialization and assimilation experience might be different from that of other first-generation immigrants. Finally, we assess whether our findings are sensitive to influential cases by replicating the models – dropping first a country of origin at a time, and then a country of destination at a time. The main findings of the article remained consistent across the different model specifications. The results of the robustness checks are summarized in the Supplementary material.
7. Discussion
The main contribution of this paper is to explain under what conditions the prevalent cultural attitudes toward gender roles at the origin and destination influence immigrants’ gender attitudes. To do so, we contrast two main theories to guide our analysis: the early socialization perspective and the life course approach. Our results provide support for the early socialization hypothesis that the cultural context of early childhood is positively associated with immigrants’ gender attitudes. For example, we find that the context of origin is strongly associated with first-generation and, in particular, adult immigrants’ gender attitudes, while the relationship with the origin becomes weak and statistically insignificant for second-generation immigrants and child migrants. The reverse applies when we turn to the context of the destination: Our results show that cultural attitudes toward gender roles in the country of destination are strongly associated with second-generation immigrants’ and child migrants’ gender attitudes, while the association is weaker among first-generation immigrants and adult immigrants.
the scope of this paper; nevertheless, what we can draw from our findings is that the context of the destination provides a non-negligible point of reference for adult migrants’ attitudes.
Our empirical analysis has some limitations. Given the cross-sectional nature of the data, we cannot differentiate age at arrival or length-of-stay effects from differences in gender attitudes between immigrants who migrated at different points in time. Only panel data would allow us to accurately disentangle the adaptation hypothesis from the selection one. However, there exists no panel data that covers as many different countries of origin and destination as the ESS. Another limitation of this study is that it is restricted to only one dimension of gender-egalitarian attitudes, namely attitudes toward women’s employment. We recognize the multidimensionality of gender ideology and, therefore, cannot generalize our findings to other dimensions of gender ideology (Brinton and Lee 2016; Knight and Brinton 2017). Nevertheless, the advantage of focusing on this unique dimension of gender ideology is that it can be measured with the same survey instrument at both the destination and origin levels. Moreover, gender equality in the labor market is a significant dimension of gender ideology that is worth studying separately from other dimensions (Fortin 2005).
8. Acknowledgments
References
Antecol, H. (2000). An examination of cross-country differences in the gender gap in labor force participation rates.Labour Economics7(4): 409–426. doi:10.1016/S0927-5371(00)00007-5.
Arends-T´oth, J. and Van de Vijver, F.J. (2009). Cultural differences in family, marital, and gender-role values among immigrants and majority members in the Netherlands. In-ternational Journal of Psychology44(3): 161–169.doi:10.1080/00207590701545676.
Arpino, B., Esping-Andersen, G., and Pessin, L. (2015). How do changes in gender role attitudes towards female employment influence fertility? A macro-level analysis.
European Sociological Review31(3): 370–382.doi:10.1093/esr/jcv002.
Arpino, B. and Tavares, L. (2013). Fertility and values in Italy and Spain: A look at regional differences within the European context. Population Review52(1): 62–86.
doi:10.1353/prv.2013.0004.
Batalova, J.A. and Cohen, P.N. (2002). Premarital cohabitation and housework: Cou-ples in cross-national perspective. Journal of Marriage and Family64(3): 743–755.
doi:10.1111/j.1741-3737.2002.00743.x.
Baxter, J., Buchler, S., Perales, F., and Western, M. (2015). A life-changing event: First births and men’s and women’s attitudes to mothering and gender divisions of labor.
Social Forces93(3): 989–1014.doi:10.1093/sf/sou103.
Blau, F.D., Kahn, L.M., and Papps, K.L. (2011). Gender, source country characteristics, and labor market assimilation among immigrants.Review of Economics and Statistics
93(1): 43–58. doi:10.1162/REST a 00064.
Bliss, S.B. (1988). The effect of feminist attitudes in parents on their kinder-garten children. Smith College Studies in Social Work 58(3): 182–192.
doi:10.1080/00377318809516643.
Brinton, M.C. and Lee, D.J. (2016). Gender-role ideology, labor market institutions, and post-industrial fertility. Population and Development Review 42(3): 405–433.
doi:10.1111/padr.161.
Brooks, C. and Bolzendahl, C. (2004). The transformation of US gender role attitudes: Cohort replacement, social-structural change, and ideological learning.Social Science Research33(1): 106–133.doi:10.1016/S0049-089X(03)00041-3.
Cha, Y. and Th´ebaud, S. (2009). Labor markets, breadwinning, and beliefs: How eco-nomic context shapes men’s gender ideology. Gender and Society23(2): 215–243.
Dasgupta, S.D. (1998). Gender roles and cultural continuity in the Asian In-dian immigrant community in the US. Sex Roles 38(11–12): 953–974.
doi:10.1023/A:1018822525427.
Davis, S.N. (2007). Gender ideology construction from adolescence to young adulthood.
Social Science Research36(3): 1021–1041. doi:10.1016/j.ssresearch.2006.08.001.
Davis, S.N. and Greenstein, T.N. (2009). Gender ideology: Components, predictors, and consequences. Annual Review of Sociology35: 87–105.
doi:10.1146/annurev-soc-070308-115920.
Davis, S.N. and Wills, J.B. (2010). Adolescent gender ideology socialization: Direct and moderating effects of fathers’ beliefs. Sociological Spectrum 30(5): 580–604.
doi:10.1080/02732173.2010.496106.
Diehl, C., Koenig, M., and Ruckdeschel, K. (2009). Religiosity and gender equality: Comparing natives and Muslim migrants in Germany.Ethnic and Racial Studies32(2): 278–301.doi:10.1080/01419870802298454.
Doepke, M., Tertilt, M., and Voena, A. (2012). The economics and politics of women’s rights. Annual Review of Economics4: 339–372.
doi:10.1146/annurev-economics-061109-080201.
Ersanilli, E. (2012). Model(ling) citizens? Integration policies and value inte-gration of Turkish immigrants and their descendants in Germany, France, and the Netherlands. Journal of Immigrant and Refugee Studies 10(3): 338–358.
doi:10.1080/15562948.2012.693336.
Esping-Andersen, G. (2009).The incomplete revolution: Adapting to women’s new roles. Cambridge and Malden: Polity Press.
Fortin, N.M. (2005). Gender role attitudes and the labour-market outcomes of women across OECD countries. Oxford Review of Economic Policy 21(3): 416–438.
doi:10.1093/oxrep/gri024.
Frank, K. and Hou, F. (2015). Source-country gender roles and the division of la-bor within immigrant families. Journal of Marriage and Family 77(2): 557–574.
doi:10.1111/jomf.12171.
Fuwa, M. (2004). Macro-level gender inequality and the division of house-hold labor in 22 countries. American Sociological Review 69(6): 751–767.
doi:10.1177/000312240406900601.
Guo, J. and Gilbert, N. (2012). Public attitudes and gender policy regimes: Coherence and stability in hard times.Journal of Sociology and Social Welfare39(2): 163–181.
Hook, J.L. (2006). Care in context: Men’s unpaid work in 20 countries, 1965–2003.
American Sociological Review71(4): 639–660.doi:10.1177/000312240607100406.
Huschek, D., de Valk, H.A., and Liefbroer, A.C. (2011). Gender-role behavior of second-generation Turks: The role of partner choice, gender ideology and societal context.
Advances in Life Course Research16(4): 164–177.doi:10.1016/j.alcr.2011.09.005.
Hwang, J. (2016). The second shift: Assimilation in housework time among immigrants.
Review of Economics of the Household 14(4): 941–959. doi:10.1007/s11150-015-9319-4.
Inglehart, R. and Norris, P. (2003). Rising tide: Gender equality and cul-tural change around the world. New York: Cambridge University Press.
doi:10.1017/CBO9780511550362.
Kalmijn, M. (2010). Consequences of racial intermarriage for children’s social integra-tion.Sociological Perspectives53(2): 271–286.doi:10.1525/sop.2010.53.2.271.
Kalmijn, M. and Van Tubergen, F. (2010). A comparative perspective on intermarriage: Explaining differences among national-origin groups in the United States. Demogra-phy47(2): 459–479. doi:10.1353/dem.0.0103.
Kim, E.H.W. and Cheung, A.K.L. (2015). Women’s attitudes toward family formation and life stage transitions: A longitudinal study in Korea. Journal of Marriage and Family77(5): 1074–1090.doi:10.1111/jomf.12222.
Knight, C.R. and Brinton, M.C. (2017). One egalitarianism or several? Two decades of gender-role attitude change in Europe. American Journal of Sociology122(5): 1485– 1532.doi:10.1086/689814.
Knudsen, K. and Wærness, K. (2008). National context and spouses’ housework in 34 countries.European Sociological Review24(1): 97–113.doi:10.1093/esr/jcm037.
McDonald, P. (2013). Societal foundations for explaining fertility: Gender equity. De-mographic Research28(34): 981–994.doi:10.4054/DemRes.2013.28.34.
Merz, E.M., ¨Ozeke-Kocabas, E., Oort, F.J., and Schuengel, C. (2009). Intergenerational family solidarity: Value differences between immigrant groups and generations. Jour-nal of Family Psychology23(3): 291–300. doi:10.1037/a0015819.
Moen, P., Erickson, M.A., and Dempster-McClain, D. (1997). Their mother’s daughters? The intergenerational transmission of gender attitudes in a world of changing roles.
Myers, S.M. and Booth, A. (2002). Forerunners of change in nontraditional gender ide-ology.Social Psychology Quarterly65(1): 18–37. doi:10.2307/3090166.
Oropesa, R.S. and Landale, N.S. (1997). In search of the new second generation: Alter-native strategies for identifying second generation children and understanding their ac-quisition of English.Sociological Perspectives40(3): 429–455.doi:10.2307/1389451.
Pampel, F. (2011). Cohort change, diffusion, and support for gender egalitari-anism in cross-national perspective. Demographic Research 25(21): 667–694.
doi:10.4054/DemRes.2011.25.21.
Pessin, L. (2018). Changing gender norms and marriage dynamics in the United States.
Journal of Marriage and Family80(1): 25–41. doi:10.1111/jomf.12444.
R¨oder, A. and M¨uhlau, P. (2014). Are they acculturating? Europe’s immigrants and gender egalitarianism.Social Forces92(3): 899–928. doi:10.1093/sf/sot126.
Rumbaut, R.G. (2004). Ages, life stages, and generational cohorts: Decomposing the immigrant first and second generations in the United States. International Migration Review38(3): 1160–1205. doi:10.1111/j.1747-7379.2004.tb00232.x.
Rumbaut, R.G. and Ima, K. (1988). The adaptation of Southeast Asian refugee youth: A comparative study. Washington, D.C.: U.S. Office of Refugee Resettlement. (Final report to the Office of Refugee Resettlement).
Seguino, S. (2007). Plus c¸a change? Evidence on global trends in gender norms and stereotypes.Feminist Economics13(2): 1–28.doi:10.1080/13545700601184880.
Snijders, T.A. and Bosker, R.J. (2012). Multilevel analysis: An introduction to basic and advanced multilevel modeling. Thousand Oaks: Sage.
Thornton, A., Alwin, D.F., and Camburn, D. (1983). Causes and consequences of sex-role attitudes and attitude change. American Sociological Review 48(2): 211–227.
doi:10.2307/2095106.
Treas, J. and Widmer, E.D. (2000). Married women’s employment over the life course: Attitudes in cross-national perspective.Social Forces78(4): 1409–1436.
Van Tubergen, F., Maas, I., and Flap, H. (2004). The economic incorporation of immi-grants in 18 Western societies: Origin, destination, and community effects. American Sociological Review69(5): 704–727.doi:10.1177/000312240406900505.
Vargas, A.J. (2016). Assimilation effects beyond the labor market: Time allocations of Mexican immigrants to the US. Review of Economics of the Household14(3): 625– 668. doi:10.1007/s11150-014-9256-7.
in Spain: A cross-classified multilevel analysis. Regional Studies 49(2): 189–203.
doi:10.1080/00343404.2012.759649.
Willits, F.K. and Crider, D.M. (1989). Church attendance and traditional religious beliefs in adolescence and young adulthood: A panel study. Review of Religious Research
31(1): 68–81. doi:10.2307/3511025.
Supplementary material
We document the construction and validity of our main variables of interest. In particular, we explain how the following variables were constructed:
1. Immigrant generation and country of origin
2. Measure of attitudes toward working women in the country of origin 3. Length of stay in country
Immigrant generation and country of origin
Third generation: The respondent is born in the country of residence (brncntr = 1), and the father (facntr = 1) and mother (mocntr = 1) of the respondent is also born in that country. In case the information about one of the parents is missing, the respondent is considered to be of third generation if the parent with a non-missing response is born in the country of residence (N = 580). Second generation: The respondent is born in the country of residence (brncntr = 1), and at least one of the respondent’s parents is not born in the country of residence (facntr = 1 AND/OR mocntr = 1).
• For the secondgeneration respondents, the country of origin corresponds to the mother’s country of birth (mbrncnt in the second round the ESS and mbrncnta in the fourth and fifth round of the ESS). As a robustness check, we use the fa-ther’s country of birth when both parents are born abroad and in different countries (N = 384).
• In case the information about one of the parent is missing, the respondent is con-sidered to be of the second generation if the parent with a nonmissing response is not born in the country of residence (N = 34). First generation: The respondent is not born in the country of residence (brncntr = 0).
• For the first-generation respondents, the country of origin corresponds to the re-spondent’s country of birth (cntbrtha in the second round the ESS and cntbrthb in the fourth and fifth round of the ESS).
Measure of gender attitudes toward working women in the country of origin
The country-level measure of egalitarian attitudes toward working women is measured using both the ESS and the WVS/EVS study data.
that either disagree or strongly disagree with the statement, “Men should have more right to a job than women when jobs are scarce.”
In the harmonized WVS/EVS, we use the variable c001, which takes the following three categories: Neither, Disagree, and Agree. The country variable corresponds to the percentage of respondents that either disagree or strongly disagree with the statement, “Men should have more right to a job than women when jobs are scarce.”
To match respondents to the measure of gender attitudes in their country of origin and in the corresponding survey year, we take the following steps:
• If available, we use the ESS measure in the same ESS round (about 68% of cases).
• If the ESS variable is not available, we use the WVS/EVS measure in the corre-sponding survey year (27% of cases).
• If the WVS/EVS measure is not available in the same survey year, we use the closest available WVS/EVS measure within a two-year period (5%).
To assess the validity of using two different sources of data for the gender attitudes measure, we calculate the correlation between the ESS and WVS/EVS indicators when both are available (N = 66). We find a 0.84 correlation between them.
Length of stay in country
Additional tables
Table A-1: Sample size
Country of destination ESS round 2 ESS round 4 ESS round 5 Total
Austria 288 363 0 651
Belgium 246 290 283 819
Bulgaria 0 63 68 131
Croatia 0 214 44 258
Cyprus 0 97 69 166
Czech Republic 202 151 130 483
Denmark 111 141 165 417
Estonia 587 528 509 1,624
Finland 34 80 93 207
France 216 234 235 685
Germany 321 354 473 1,148
Greece 281 179 246 706
Hungary 77 49 69 195
Iceland 19 0 0 19
Ireland 196 300 423 919
Italy 28 0 0 28
Latvia 0 547 0 547
Lithuania 0 175 154 329
Luxembourg 680 0 0 680
Netherlands 208 188 146 542
Norway 138 147 174 459
Poland 50 63 52 165
Portugal 60 49 33 142
Romania 0 28 0 28
Russian Federation 0 217 273 490
Slovakia 112 117 128 357
Slovenia 50 215 160 425
Spain 83 178 178 439
Sweden 265 309 236 810
Switzerland 535 556 448 1,539
Ukraine 432 187 359 978
United Kingdom 175 273 274 722
Table A-2: Percent missing for all the variables of interest
Variable Missing Total Percent missing
Dependent variable
Gender roles attitudes 417 23,033 1.81 Origin variables
Gender ideology 5,226 23,033 22.69
Destination variables
Destination gender ideology 0 23,033 0.00 Individual-level variables
Length of stay 272 23,033 1.18
Gender 19 23,033 0.08
Partnered 97 23,033 0.42
Education 140 23,033 0.61
Age category 93 23,033 0.40
Urban 78 23,033 0.34
Country of origin 1,541 23,033 6.69
Table A-3: Origin gender ideology by ESS round
Country of origin ESS round 2 ESS round 4 ESS round 5 Total
Albania 0.32 0.61 0.61 0.51
Algeria 0.20 0.20 0.20
Argentina 0.63 0.63 0.70 0.65
Armenia 0.42 0.42 0.42
Australia 0.66 0.72 0.72 0.70
Austria 0.50 0.70 0.67 0.62
Azerbaijan 0.17 0.10 0.13
Bangladesh 0.17 0.17
Belarus 0.67 0.49 0.58
Belgium 0.54 0.71 0.71 0.65
Bosnia and Herzegovina 0.63 0.63 0.63 0.63
Brazil 0.65 0.65 0.65
Bulgaria 0.54 0.45 0.46 0.48
Burkina Faso 0.35 0.35
Canada 0.80 0.80 0.80
Chile 0.50 0.58 0.58 0.55
China 0.33 0.41 0.41 0.38
Colombia 0.65 0.65
Croatia 0.58 0.53 0.56
Cyprus 0.48 0.46 0.32 0.42
Czech Republic 0.37 0.49 0.44 0.43
Denmark 0.83 0.93 0.90 0.89
Ecuador 0.56 0.56
Egypt 0.05 0.05 0.08 0.06
Estonia 0.42 0.62 0.60 0.55
Ethiopia 0.86 0.86 0.86
Finland 0.71 0.85 0.79 0.78
Table A-3: (Continued)
Country of origin ESS round 2 ESS round 4 ESS round 5 Total
Georgia 0.42 0.26 0.34
Germany 0.56 0.66 0.69 0.64
Ghana 0.37 0.37 0.46 0.40
Greece 0.31 0.31 0.33 0.32
Guatemala 0.72 0.72
Hong Kong 0.44 0.41 0.43
Hungary 0.26 0.38 0.27 0.30
Iceland 0.71 0.97 0.97 0.88
India 0.20 0.20 0.20
Indonesia 0.36 0.36 0.36
Iran (Islamic Republic) 0.17 0.17 0.17
Iraq 0.22 0.16 0.17 0.19
Ireland 0.54 0.78 0.77 0.69
Israel 0.52 0.55 0.54
Italy 0.33 0.68 0.68 0.56
Japan 0.18 0.15 0.15 0.16
Jordan 0.07 0.07
Kazakhstan 0.28 0.28 0.28
Korea, Republic of 0.27 0.26 0.26 0.26
Kyrgyzstan 0.39 0.25 0.25 0.29
Latvia 0.58 0.71 0.64
Lebanon 0.37 0.37
Lithuania 0.44 0.45 0.44
Luxembourg 0.54 0.77 0.77 0.69
Macedonia 0.52 0.52 0.52
Malaysia 0.15 0.15 0.18 0.16
Mali 0.23 0.23
Malta 0.58 0.58
Mexico 0.68 0.71 0.69
Moldova 0.39 0.36 0.36 0.37
Montenegro 0.74 0.74
Morocco 0.33 0.32 0.32 0.32
Netherlands 0.64 0.79 0.79 0.74
New Zealand 0.73 0.78 0.78 0.76
Nigeria 0.23 0.23 0.23
Norway 0.80 0.90 0.84 0.85
Pakistan 0.20 0.20 0.20
Palestine 0.22 0.22
Peru 0.73 0.65 0.65 0.68
Philippines 0.21 0.21 0.21
Poland 0.40 0.55 0.54 0.49
Portugal 0.42 0.60 0.53 0.51
Qatar 0.23 0.23
Romania 0.41 0.39 0.36 0.39
Russian Federation 0.45 0.46 0.36 0.42
Rwanda 0.64 0.35 0.50
Saudi Arabia 0.09 0.09
Serbia 0.69 0.69 0.69
Singapore 0.46 0.37 0.42
Slovakia 0.48 0.41 0.40 0.43
Slovenia 0.58 0.72 0.72 0.67
South Africa 0.49 0.49 0.48 0.49
Spain 0.56 0.71 0.73 0.67
Sweden 0.78 0.92 0.86 0.86
Table A-3: (Continued)
Country of origin ESS round 2 ESS round 4 ESS round 5 Total
Taiwan, Province of China 0.54 0.47 0.47 0.49
Thailand 0.41 0.41 0.40 0.40
Trinidad 0.66 0.66 0.62 0.65
Tunisia 0.18 0.18 0.18
Turkey 0.17 0.16 0.32 0.21
Ukraine 0.33 0.35 0.28 0.32
United Kingdom 0.51 0.73 0.67 0.64
United States 0.67 0.70 0.70 0.69
Uruguay 0.69 0.69 0.65 0.68
Uzbekistan 0.27 0.27 0.27
Viet Nam 0.38 0.38 0.38
Zambia 0.51 0.51
Zimbabwe 0.57 0.57 0.57
Note: Country-of-origin gender ideology is defined as the share of respondents who disagree with the statement, “when jobs are scarce, men should have more right to a job than women.”
Table A-4: Destination gender ideology by ESS round
Destination country ESS Round 2 ESS Round 4 ESS Round 5 Total
Austria 0.49 0.66 0.58
Belgium 0.55 0.72 0.73 0.67
Bulgaria 0.45 0.46 0.46
Croatia 0.59 0.53 0.56
Cyprus 0.46 0.32 0.39
Czech Republic 0.37 0.48 0.45 0.43
Denmark 0.84 0.94 0.92 0.90
Estonia 0.45 0.63 0.63 0.57
Finland 0.71 0.85 0.79 0.78
France 0.55 0.76 0.65 0.65
Germany 0.57 0.68 0.70 0.65
Greece 0.32 0.31 0.33 0.32
Hungary 0.26 0.38 0.27 0.30
Iceland 0.70 0.70
Ireland 0.53 0.77 0.77 0.69
Italy 0.32 0.32
Latvia 0.57 0.57
Lithuania 0.44 0.44 0.44
Luxembourg 0.56 0.56
Netherlands 0.65 0.80 0.79 0.75
Norway 0.82 0.90 0.87 0.86
Poland 0.40 0.55 0.53 0.49
Portugal 0.41 0.59 0.51 0.50
Romania 0.39 0.39
Russian Federation 0.47 0.36 0.41
Slovakia 0.47 0.41 0.41 0.43
Slovenia 0.57 0.71 0.72 0.67
Spain 0.57 0.72 0.74 0.67
Sweden 0.78 0.93 0.88 0.86
Switzerland 0.49 0.65 0.61 0.59
Ukraine 0.32 0.32 0.27 0.30
United Kingdom 0.51 0.73 0.67 0.64
Note: Destination gender ideology is defined as the share of natives (third generation+) who disagree with the statement, “when jobs are scarce, men should have more right to a job than women.”
Table A-5: Definition of the regions
Asia Middle East Post Soviet
Bangladesh Palestine Russian Federation
China Iran Ukraine
Taiwan, Province of China Iraq Uzbekistan
Cyprus Israel Southern Europe
Hong Kong Jordan Albania
India Lebanon Bosnia and Herzegovina
Indonesia Qatar Croatia
Japan Saudi Arabia Greece
Korea, Republic Of Turkey Italy
Malaysia Egypt Malta
Pakistan Northern Africa Montenegro
Philippines Algeria Portugal
Singapore Morocco Serbia
Viet Nam Tunisia Slovenia
Thailand North America Spain
Oceania Canada Macedonia
Australia United States Sub-Saharan Africa
New Zealand Northern Europe Ethiopia
Eastern Europe Denmark Ghana
Bulgaria Finland Mali
Czech Republic Iceland Nigeria
Hungary Ireland Rwanda
Poland Norway South Africa
Romania Sweden Zimbabwe
Slovakia United Kingdom Burkina Faso
Latin America Post-Soviet Zambia
Argentina Azerbaijan Western Europe
Brazil Armenia Austria
Chile Belarus Belgium
Colombia Estonia France
Ecuador Georgia Germany
Guatemala Kazakhstan Luxembourg
Mexico Kyrgyzstan Netherlands
Peru Latvia Switzerland
Trinidad and Tobago Lithuania
Additional figures
Figure A-1: Immigrants’ gender attitudes toward working women
Note: Figure A-1 describes the dependent variable used in the analysis, which corresponds to gender attitudes toward working women among first- and second-generation immigrants living in 32 countries.
Source: ESS.
Robustness checks
To address potential concerns about the robustness of the findings, the models presented in Table 2 are re-estimated under the following model specifications:
• Check 1: We replicate the analysis, treating the dependent variable as an ordinal categorical variable rather than a continuous one. We use an ordered logistic regres-sion model with clustered standard errors at the community level. The crossclassi-fied structure is not maintained because the estimation is too complex to converge combined with a nonlinear outcome variable. While the coefficients of a linear model and a nonlinear model cannot be directly compared, we can check whether the sign and the statistical significance of the findings are consistent across model specifications.