M E T H O D O L O G Y A R T I C L E
Open Access
WorMachine: machine learning-based
phenotypic analysis tool for worms
Adam Hakim
1*†, Yael Mor
1,2*†, Itai Antoine Toker
2, Amir Levine
3, Moran Neuhof
2, Yishai Markovitz
2and Oded Rechavi
1,2*Abstract
Background:Caenorhabditis elegansnematodes are powerful model organisms, yet quantification of visible phenotypes is still often labor-intensive, biased, and error-prone. We developed WorMachine, a three-step MATLAB-based image analysis software that allows (1) automated identification of C. elegans worms, (2) extraction of morphological features and quantification of fluorescent signals, and (3) machine learning techniques for high-level analysis.
Results: We examined the power of WorMachine using five separate representative assays: supervised classification of binary-sex phenotype, scoring continuous-sexual phenotypes, quantifying the effects of two different RNA interference treatments, and measuring intracellular protein aggregation.
Conclusions: WorMachine is suitable for analysis of a variety of biological questions and provides an accurate and reproducible analysis tool for measuring diverse phenotypes. It serves as a “quick and easy,” convenient, high-throughput, and automated solution for nematode research.
Keywords: Caenorhabditis elegans, Machine learning, Deep learning, High-throughput image analysis, Feature extraction, Image processing, Phenotype analysis
Background
Caenorhabditis elegans nematodes are powerful genetic model organisms which are instrumental for research on a wide range of biological questions. It is relatively simple to grow C. elegans under tightly regulated en-vironmental conditions, and since the worm has a short generation time (3 days) and a large brood size (±250), large sample sizes and statistical power are easily obtained. In many cases, however, when pheno-typic features are examined, the advantage of having a large sample size comes with great cost, because of the need to manually analyze the features of interest in the tested animals. Programs for quantifying C. elegans’ phenotypes from still images exist, for example, WormSizer [1], Fiji [2], QuantWorm [3], and WormToolbox [4]. However, the analysis process of these programs is not fully automated, and not all
informative phenotypic features can be analyzed simultan-eously in one package. Moreover, each type of software answers different specific research requirements.
We created WorMachine as a fast, friendly, and high-throughput image processing platform. WorMachine enables automated calculation of many morphological and Fluorescent features and accessible machine learn-ing techniques for higher level features-based analysis (described in detail in the Implementation and Methods sections), such as classification and phenotype scoring. WorMachine is entirely MATLAB-based and combines the capabilities of different programs into one software package; the user-friendly interface was designed to suit investigators with no background in MATLAB, image processing, or machine learning, and it requires no additional plugins or installations. WorMachine is not limited to any specific image format, resolution, acquisi-tion software, or microscope.
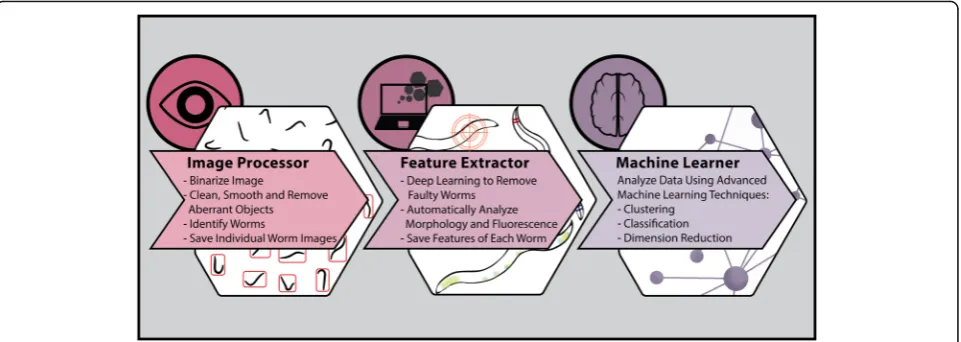
Implementation
WorMachine’s workflow includes three sequential pro-grams: Image Processor, Feature Extractor, and Machine
* Correspondence:[email protected];[email protected];
†Equal contributors
1Sagol School of Neuroscience, Tel Aviv University, Tel Aviv, Israel
Full list of author information is available at the end of the article
Learner (Fig. 1). WorMachine’s codes, demonstration video, and a sample Tag Image File Format (TIFF) image with which to try the program are accessible through links supplied in WorMachine's manual, available Add-itional file 1.
The Image Processor uses still bright-field (BF) im-ages of worm plates as input (acquired using any typical image acquisition microscope). Fluorescent images can similarly be analyzed together with overlapping BF acquisitions. The image acquisition procedures and parameters which enabled optimal processing of images in our hands are detailed in the methods section. Identifying real worms from other elements is normally a painstaking stage that delays image analysis. The Image Processor of Wor-Machine binarizes, identifies, and crops individual worms from the original image automatically.
The cropped worm masks are then loaded to the Feature Extractor, where the worms’ morphological and fluorescent features are analyzed individually. During this stage of the analysis, potentially faulty and damaged worm images are flagged by a deep learning network designed particularly for this task and made available for the investigator’s review. The Feature Extractor also enables tagging different worms with labels according to the user’s needs, such as assigning worms to different conditions or groups. For example, the worms’ sex can be labeled, and this information can be used for creating a training data-set for later classification.
Finally, the Machine Learner builds on the ob-tained features and labels to conduct binary classifi-cation, using a support vector machine (SVM), or visualization and scoring of high-dimensional data and dimensionality reduction using principal compo-nent analysis (PCA) or t-distributed stochastic neigh-bor embedding (t-SNE) [5, 6].
Image Processor
WorMachine is best suited to handle TIFF images with one or multiple channels, which can have a maximum size of about 1 GB, depending on the memory of the user’s computer. However, it also supports a wide range of additional formats used by biologists, as it incorporates the Bio-Formats Library [7] for image reading. Imported images are automat-ically grayscaled and contrast-adjusted to accentuate the differences between worms and the background and accordingly to improve the detection of
nema-todes. A representative input TIFF image with
multiple worms before and after grayscaling is shown in Additional file 2: Figure S1. The program gener-ates a binary mask based on the imported image, using adaptive local thresholding [8], and this mask
is then “cleaned” and segmented using MATLAB’s
own Image Processing Toolbox (for details, see methods). Individual worms within a likely size are
automatically identified, smoothed, filled, and
cleaned, using standard image processing procedures included in MATLAB’s Image Processing Toolbox. All individual worm images are numbered and saved to a folder based on their respective image channel (BF, Fluorescence, Masks, etc.). This procedure may be applied automatically on multiple images, using the “Batch Analysis” option (see manual and demo movie link in Additional file 1).
Feature Extractor
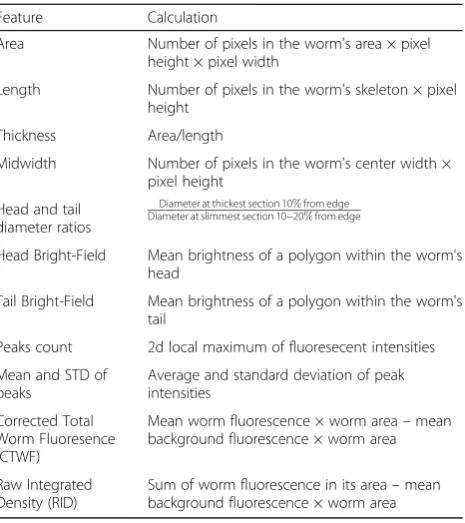
Once individual worm masks are imported into this pro-gram, the analysis may be performed on all channels in parallel. All morphological and Fluorescent measure-ments currently available in WorMachine are detailed in Table 1, and each extraction technique is detailed in the methods section. After extraction, objects which deviate in area size, length, or skeleton disfigurement are flagged
for manual inspection, together with images identified as “noise” by the deep learning network. Thus, the user may further clean and refine her database. The propor-tion of worms excluded by this step is detailed in Add-itional file 3: Table S1.
Machine Learner
At this stage, data extracted from the previous stages can be analyzed with different Machine Learner techniques. First, users may visually review and select features relevant to their analysis. Next, the user can choose between two techniques: (1) SVM for binary classification based on supplied or user-generated training data or (2) high-dimensionality visualization and scoring of complex phenotypes based on various features using PCA or t-SNE. The algorithms and their use are detailed in the methods section, and examples for different applications are provided in the Results section.
Results
We examined WorMachine’s ability to facilitate analyses of multiple different phenotypes. First, we describe the use of the software for classification of worm popula-tions based on binary-sex phenotypes (males or her-maphrodites). Then we demonstrate, using a mutant that displays a continuous-sexual phenotype, that Wor-Machine can accurately create a common scale of worm masculinization. Next, we show how the software can be used to quantify RNA interference (RNAi)-induced gene silencing, protein aggregation, and puncta distribution.
Binary classification of the worms’sex
C. elegans nematodes have two sexes - the majority of the worms are self-fertilizing XX hermaphrodites, and
a small minority (0.1–0.2%) are X0 males [9].
WorMachine can be used to calculate in a high-throughput and precise manner the sex ratios in dif-ferent strains and conditions. To distinguish between
the sexes, WorMachine uses morphological and
brightness features that differentiate between her-maphrodites and males and, also, when fluorescent reporters are available, sex-specific expression pat-terns. The mutant worms that we used here (him-5(e1467); zdIs13 [tph-1p::GFP] IV]) segregate many males and express green fluorescent protein (GFP) in the serotonergic neurons. Mutations in him-5 increase the frequency of XO males (to about 30%) by elevat-ing the frequency of X chromosome nondisjunction [10]. The tph1p::GFP transgene allows one to distin-guish the worms’ sex as it drives GFP expression in male-specific and hermaphrodite-specific neurons: the
hermaphrodite-specific neuron (HSN), the males’
ventral cord motor neurons (CPs), and some tail-specific neurons [11, 12]. We classified worms based on morphological, brightness, and fluorescent features (Additional file 4: Figure S2) and reached 98% classifi-cation accuracy when we trained on all features using 1800 worms. Figure 2 displays the true positive rates of the machine learning program, based on training sets of different sizes (30 to 2000 worms), with and without taking advantage of the sex-specific Fluores-cent pattern. For each size of the training set on which the model was trained, the true positive rates presented were based on predictions the model per-formed on the same held-out test set; the test set was composed of 200 worms, 100 males and 100 her-maphrodites, randomly selected and excluded from the entire dataset in advance of any training.
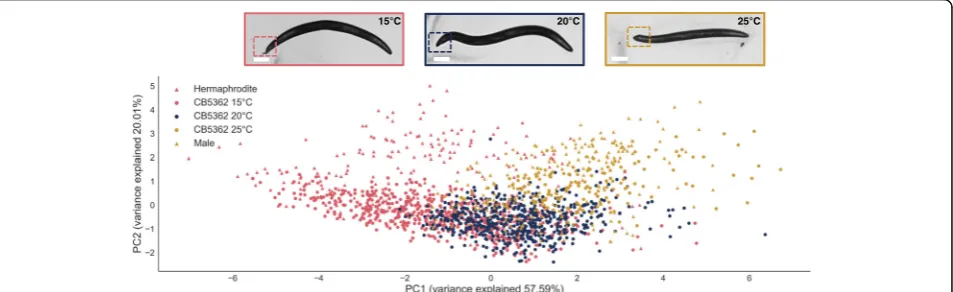
Quantifying a continuous-sex phenotype
Continuous morphological phenotypes are common, and due to their complex nature, their quantification is often challenging. We used the CB5362 strain, which is mutated in the sex determination genes xol-1 and tra-2. These worms display an intersex phenotype which depends on temperature [13]. We used WorMachine to determine the sexual phenotype (= degree of masculinization) of each worm, based on multiple features: the shape of the tail (angle evaluation) [14], the presence or absence of eggs in the gonad (egg-bearing worms have larger midwidth), the worm's length and area (males are smaller than hermaph-rodites), and the head and tail brightness (males have dar-ker tails in BF) (Additional file 4: Figure S2). We grew CB5362 worms at three different temperatures (15, 20, and 25 °C) and imaged them at the first day of adulthood.
Table 1Morphological and fluorescent features and their calculation methods
Feature Calculation
Area Number of pixels in the worm's area × pixel
height × pixel width
Length Number of pixels in the worm's skeleton × pixel
height
Thickness Area/length
Midwidth Number of pixels in the worm's center width ×
pixel height
Head and tail diameter ratios
Diameter at thickest section 10%from edge Diameter at slimmest section 10−20%from edge
Head Bright-Field Mean brightness of a polygon within the worm's
head
Tail Bright-Field Mean brightness of a polygon within the worm's
tail
Peaks count 2d local maximum of fluoresecent intensities
Mean and STD of peaks
Average and standard deviation of peak intensities
Corrected Total Worm Fluoresence (CTWF)
Mean worm fluorescence × worm area–mean
background fluorescence × worm area
Raw Integrated Density (RID)
Sum of worm fluorescence in its area–mean
The program determined the degree of masculinization of each worm, ranging from male to hermaphrodite, using dimensionality reduction techniques. PCA yielded scores that were concurrent with previous literature, showing higher masculinity scores for higher temperatures (Fig. 3, Additional file 5: Figure S3).t-SNE analysis yielded similar results (Additional file 6: Figure S4). In order to verify that the spread of the first PCA component, as illustrated in Fig. 3, is indeed a measure of masculinization degree, we added worms with binary-sex phenotype to the PCA. The figure shows that the higher the temperature in which the continuous-sex phenotype worms were grown, the more they resemble males from the binary-sex phenotype strain in the first principal component.
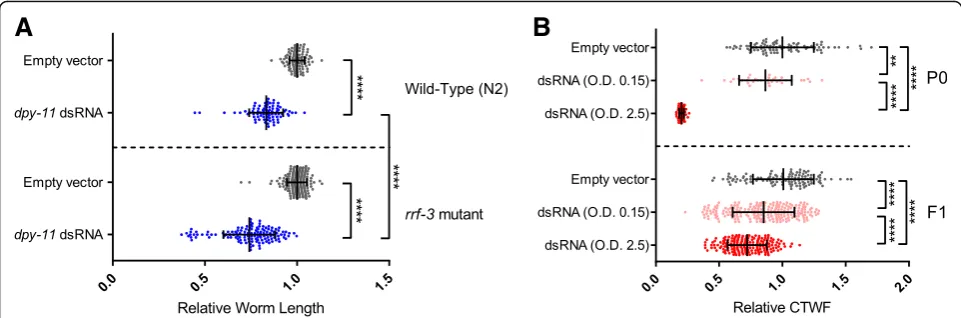
Quantifying RNAi-induced phenotypes
We used WorMachine to quantify the RNAi response of worms fed with anti-dpy-11 or anti-mCherry double-stranded RNA (dsRNA) expressing bacteria.
Anti-dpy-11 RNAi
Knockdown of dpy-11 results in a “Dumpy” phenotype (reduced length) [15]. In addition to using wild-type worms (N2), we also examined the RNAi response in rrf-3(pk1426) mutants, which are hypersensitive to RNAi (they exhibit an enhanced RNAi, or Eri, phenotype) [16]. As can be seen in Fig. 4a, WorMachine successfully cap-tures the stronger response to RNAi ofrrf-3 mutants, in comparison to N2 wild types (p< 10–4).
Fig. 2Success rates in classifying the worms’sex as a function of the number of worms used for training. Shown are results when the fluorescence of a reporter expressed in sex-specific neurons was taken into account (dark blue, dots) and when only morphological and brightness features were considered
(light blue, triangles). The classification is based on these morphological features: head BF, tail BF, area, length, midwidth, thickness, tail ratio, and on the
following fluorescent features: peak number (count), corrected total worm fluorescence (CTWF), and mean peak intensity. The training set included 30–2000 worms, while the test set included 200 worms, 100 of each sex, randomly selected and excluded in advance
20°C
15°C 25°C
Fig. 3A PCA visualizing the effect of temperature on the sexual phenotype. CB5362 worms were grown in different temperatures and imaged during the first day of adulthood. The PCA was calculated on scaled data and was based on the statistically significant and theoretically justified features that distinguish between the sexes (e.g., area, length, midwidth, thickness, tail ratio, head BF, and tail BF, as shown in Additional file 2: Figure S1A).Circular data pointsrepresent individual worms of the CB5363 strain displaying a temperature-dependent intersex phenotype.Triangular data pointsrepresent individual worms with binary-sex phenotype (BFF23).Red circles= 15 °C;blue circles= 20 °C;yellow circles= 25 °C. Triangles representing binary-sex phenotype worms:red triangles= males,
Anti-mCherry RNAi
We used worms that express mCherry ubiquitously (EG7841 oxTi302 [eft-3p::mCherry::tbb-2 3'UTR + Cbr-unc-119(+)] [17]. Worms were treated with dsRNA-expressing bacteria grown to different optical density (OD) values (to obtain a gradient of silencing efficiencies), and the corrected total worm fluorescence (CTWF) was measured. As expected, worms exposed to bacteria grown to higher OD values showed lower CTWF values which reflect greater levels of silencing (p< 10–4) (Fig. 4b). The differences in CTWF values (silencing levels) that were automatically measured by WorMachine were comparable to the differences measured when using ImageJ on manu-ally defined worms (Additional file 7: Figure S5).
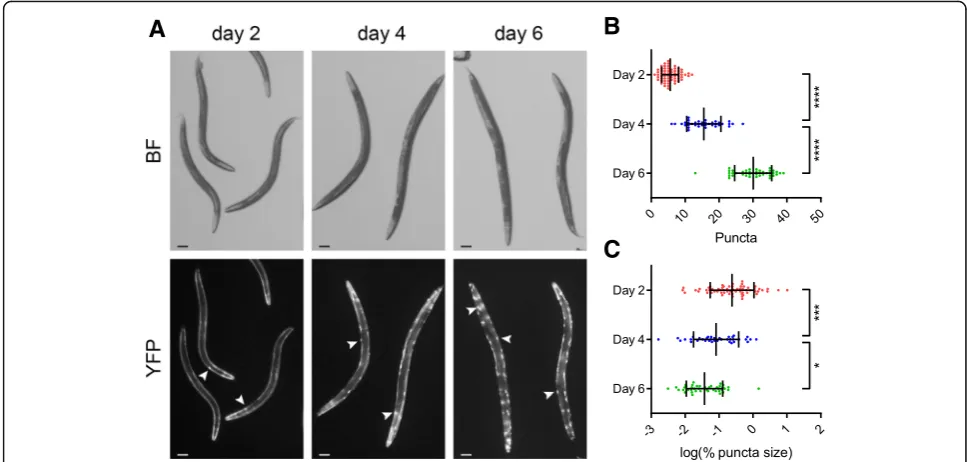
Quantification of intracellular protein aggregation Protein aggregation can be toxic and is a hallmark of many diseases [18]. The Cohen lab (at the Hebrew University of Jerusalem) studies the cellular mechanisms of polyglutamine toxicity and agreed to test whether WorMachine can be useful for quantifying the aggrega-tion of polyglutamine proteins. Importantly, the analysis of this phenotype and the data acquisition were done outside of the Rechavi lab, using a different microscope, and by non-Rechavi lab members (Amir Levine, from the Cohen lab). The transgenic AM140 worm strain expresses a polyglutamine protein (35 repeats) tagged with the yellow fluorescent protein (polyQ35-YFP) in body wall muscles [19]. These animals form visible poly-glutamine puncta that accumulate in an age-dependent manner. The sizes and quantity of these puncta serve as a measure for toxic polyglutamine aggregation [19, 20].
The large variability of puncta quantities among worms in a population and the large differences in puncta sizes within each individual worm normally require the col-lection of large datasets to achieve reproducible and consistent results. WorMachine was able to measure the number and size distributions of polyQ35-YFP in a high-throughput manner. The abundance of polyQ35-YFP puncta increases with age (in accordance with the litera-ture), while the relative sizes of polyQ35-YFP puncta decrease (Fig. 5). The differences in the number of puncta between the different experimental conditions (different days) that were identified manually were also identified by WorMachine (Additional file 7: Figure S5).
Discussion and conclusions
WorMachine offers the nematode research community an easy-to-use, automated, accurate, and reproducible meth-odology to analyze morphological and fluorescent worm features from images obtained using standard micro-scopes. The software is free and has a modular design in each step that is adaptable to user-specific requirements.
Other useful software programs for analysis of C. elegans images exist. The most similar existing software is WormToolbox [4], a module created for CellProfiler [21], which also enables high-throughput phenotypic analysis of morphology and fluorescence. In contrast to WormToolbox, WorMachine is entirely MATLAB-based, and it was built to provide a quick and easy alternative, with an interface that less com-puter literate users can appreciate. In addition, WormToolbox is adjusted for images of worms sus-pended in liquid (for example, in 96-well plates) and
B
A
handles lower quantities of worms per image (up to 15 worms per well). Although WormToolbox is very useful in some contexts, it may be helpful for researchers to use WorMachine, which captures large quantities of worms in 60-mm agarose plates and en-ables extensive batch processing. In fact, our software is only limited by the image file size (depending on the user’s computer memory capacity). Importantly, WorMachine introduces the first, to our knowledge, neural network that is trained to distinguish worms from noise. The deep learning neural network imple-mented in WorMachine recognizes, flags, and omits non-suitable objects, to ensure a high level of quality for the users’generated data.
Further advantages WorMachine offers are the ma-chine learning algorithms provided in its Mama-chine Learner section, which can uncover new information about the data that would be hard to reveal using stand-ard analysis. For example, scoring the continuous-sex phenotype based on the program’s output features provides information on degree of masculinity that is unattainable through each feature on its own. More generally, the dimensionality reduction techniques allow clear visualization of any dataset obtained through WorMachine for easier interpretation.
There are many more possible applications for WorMachine in addition to quantification of the
biological features that we analyzed in this paper. Firstly, the variety of details the software affords enables researchers to easily examine novel relations between them, such as the association between fluorescent markers to morphological features, and determine the most appropriate and artifact-free measure. In addition, the modular design of the software allows adaptation of its algorithms on many experimental datasets. For example, SVM models can be applied on any binary phenotype or experimental manipulation to automatic-ally classify large sets of worms out of a customized lim-ited training dataset. As for complex continuous phenotypes, such as developmental stages or various fluorescent patterns, PCA or t-SNE can be applied on custom datasets to obtain an aggregate continuous score. We hope that many users will find this software useful in the near future.
Methods
Preparation of worms for imaging
Worms were synchronized at each generation in one of two standard ways: (1) mothers were allowed to lay eggs for a limited span of 24 h, or (2) bleaching (“egg-prep”) was performed [22]. Adult worms were washed three times to get eliminate bacterial (OP50) residues. Worms were left in ~ 100μL of M9 buffer and paralyzed via the addition of sodium azide (final concentration of 25–
A
C
B
Fig. 5Quantifying intracellular fluorescent protein aggregation.aRepresentative images of polyQ35-YFP-expressing animals at days 2, 4, and 6 of adulthood.BFbright-field illumination. Fluorescent protein aggregations are marked withwhite arrows. Scale bars = 100μm.bQuantification of polyQ35-YFP puncta at days 2 (red,n= 64), 4 (blue,n= 37), and 6 (green,n= 42) of adulthood. Eachdotrepresents an individual worm.Bars represent mean ± standard deviation (****p< 10–4, one-way ANOVA test with Bonferroni post hoc correction).cQuantification of the relative
50 mM). The paralyzed worms were transferred to im-aging plates and then physically separated from each other using a platinum-wire pick. Separation of the worms is important for allowing the software to cor-rectly process each worm individually. The imaging plates were 60-mm petri dishes filled with 8 mL of modified transparent nematode growth medium (NGM, 2% agarose, 0.3% NaCl, 5 mM K2PO4, 1 mM CaCl2, 1 mM MgSO4).
Microscopy image acquisition
Images were taken on an Olympus IX83 microscope, using fluorescence excitation with a light-emitting diode (LED) light source on two channels: GFP and mCherry fluorescence. For BF imaging, a relatively long exposure time was used for trail erasure, and the contrast was in-creased to better differentiate between worms and back-ground. Pictures were taken with a 4X/0.75 Universal Plan Super Apochromat objective.
For the protein aggregation assays, images were ac-quired using a Nikon SMZ18 stereoscope fitted with a 1X objective, set up to capture both BF illumination and YFP fluorescence.
Measurement of worm length followingdpy-11RNAi treatment
For this assay, we took images of live worms on NGM plates. The worms grew on the indicated treatment after synchronization by egg laying. At the first day of adult-hood, the worms went through four rounds of washes in M9 buffer and were transferred to a new NGM plate. Images of worms were obtained using a DCM-310 digital camera (Scopetek) attached to an SMZ745 stereomicroscope (Nikon) with its objective set to 2X magnification. The ScopePhoto software was used for image acquisition. Images were then loaded to Wor-Machine’s Image Processor using the available preset global setting for low-resolution images. Further ana-lytical steps were performed similarly as in all other presented assays.
C. elegansstrains
The C. elegansstrains employed in this work are as fol-lows: wild-type Bristol N2 strain, BFF23: him-5(e1490) V; zdIs13(tph-1p::GFP) IV; CB5362: tra-2(ar221) II; xol-1(y9) X, AM140:rmIs132(unc-54p::Q35-YFP) I; NL2099: rrf-3(pk1426); EG7841: oxTi302 [eft-3p::mCherry::tbb-2 3'UTR + Cbr-unc-119(+)].
RNAi treatment
We used a standard RNA interference (RNAi) feeding protocol, as previously described [22]. In each stage of the different experiments, worms were cultivated either on HT115 bacteria that transcribe a specific dsRNA
(e.g., targetingmCherryordpy-11) or on control HT115 bacteria that contain only an “empty vector” that does not lead to dsRNA transcription. The NGM plates con-tained isopropyl ß-D-1-thiogalactopyranoside (IPTG) for induction of dsRNA expression. The offspring which hatched on these plates were examined.
Image requirements and limitations
WorMachine was tested on a variety of image resolu-tions, signal-to-noise ratios, bit depths, and contrasts. The software offers three preset global settings, which set all necessary image processing parameters accord-ing to a given microscope magnification used to acquire the image: high ( 10X Objective−0:45pixelμm ), medium ( 4X Objective−1:14pixelμm ), and low ( 2X−5:14
μm
pixel). The software has been successful with resolu-tions of 96, 72, and up to very small dpi, and bit depths of 8, 16, and 24. However, as internal com-puter memory is limited, loading high-resolution im-ages, which are usually very exhaustive in memory uptake, can be problematic. Thus, regardless of reso-lution, bit depth, and contrast, the software is limited to working on ~ 1 GB per image. Further testing showed that worms were successfully processed and analyzed in almost any posture, including omega turns (see examples in Additional file 8: Figure S6). However, worms that complete a full circle, such that one of their ends touches some point on their body, cannot be analyzed with our software and will be flagged as faulty. Worms that touch another worm or object directly would also be excluded, so the best practice is to separate touching worms on the plate before acquiring images. Also, we found that using plates with agarose instead of agar provided images with better foreground-background separation, since it allows more light to pass through the plate’s surface where no worms are present, increasing the back-ground’s brightness relative to the worms on the plate. Lastly, using images with contrast lower than 0.04 (defined as a grayscaled image’s standard devi-ation [23]) is not possible, and therefore worms should be imaged on plates rather than slides (which typically have lower contrast). The software success-fully analyzes images of plates with higher contrast, ranging from 0.06 to 0.15; increasing the contrast fur-ther usually provides better results, as long as the image is not distorted by amplified noise.
Image binarization, cleaning, and segmentation
considered when deciding its value, while the second sets the relative intensity for thresholding the given pixel. The mask image is a matrix of equal size as the original image, containing ones where a sus-pected worm is present and zeros in the background. The filter’s parameters ‘neighbors’ and ‘threshold’ may be adjusted manually, though several default recommended presets are offered, per the image’s resolution. After binarization, objects with areas smaller than a specified value will be deleted, includ-ing objects touchinclud-ing the edges of the image, which are unlikely to be whole worms. All the objects in
an image are identified using MATLAB’s
“region-props” function and are considered worms only if their area is within a specified relative range.
Flagging faulty worms
Morphological outliers
Aberrant worms are flagged using two methods. First, the program locates outliers — worms with extremely large or small areas or lengths or with non-continuous skeletons. All worms’ lengths and areas are standardized, and those that deviate by more than 1.5 or less than – 1.5 standard deviation units from the mean are flagged. Moreover, when the worm’s skeleton is extracted, the worm is smoothed using a median filter until a singular continuous skeleton line is obtained, for a maximum of five attempts. If more than two attempts were required to obtain a smooth skeleton from a worm mask image, or, if after the maximal smoothing attempts the skeleton still contains branch points, the mask image is likely to be disfigured or aberrant and will be flagged.
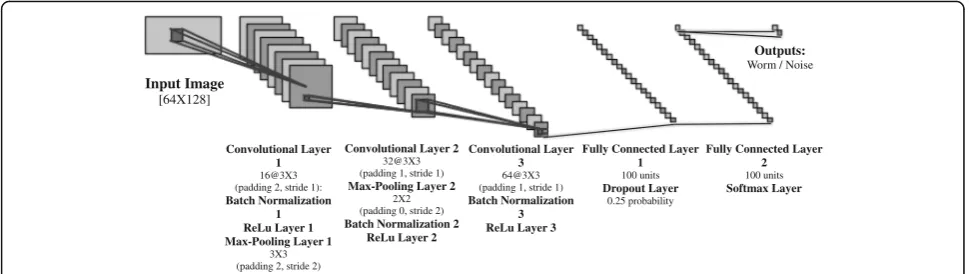
WormNet
A dedicated convolutional neural network (C-NN) was developed particularly for this task. This network has been trained on 11,820 mask images containing equal amounts of “valid” worms and noisy objects or worms with a variety of faulty features. The images were col-lected from various experiments in our lab in which
WorMachine was used for their analysis.
Experimenters manually reviewed their worm images, and they discarded images that were defective for dif-ferent reasons. The discarded images were labeled as faulty, and the remaining images as valid. Mask images were first padded to the size of the 65th per-centile mask size, and all were rescaled to the net-work’s defined input size of 64 × 128 pixels. Worms were then split to 85% training set and 15% hold-out test set. Training was performed with the stochastic gradient descent with momentum optimizer, 0.9 mo-mentum, an L2 regularization of 0.0001, a mini-batch size of 256, and a learning rate of 0.005, for 50 epochs while data was shuffled every epoch. This
yielded 99.2% training accuracy and 93.4% accuracy on the test set. The network’s complete architecture is depicted in Fig. 6. Thus, any user-generated mask images may be automatically padded and rescaled in the same procedure and then classified into “worm” or “non-worm” categories, clearly marked in the pro-gram’s interface for the users’ convenience. Moreover, the program allows users to retrain the network on their own labeled data, to further improve and fit the network to their laboratories’specifications.
Morphological measures
longest cross section is at 10% of its length, then the length of the cross section at 2.5% of the worm’s length is taken as D1. The search for the second diameter of each end (D2) begins 20 pixels from D1’s location and continues up to 20% of the worm’s length, until the shortestcross section is found. Lastly, the diameter ratio for each end is calculated by dividing D1 by D2. We developed this algorithm to maximize the diameter ratio of the wider male tails [25], without biasing against her-maphrodites’tails, to improve distinctiveness between sex phenotypes. Following these adjustments, our software distinguishes the worms’ sex successfully in 98% of the cases tested (see the Results section for more details).
Fluorescent analysis
We applied MATLAB’s “LocalMaximaFinder” object (part of the “Computer Vision” package) to locate the local maximum intensities (peaks) throughout the image, using the adjustable parameters Neighborhood and Threshold. The Neighborhood parameter specifies the size of a square surrounding an identified peak, in which no other local maxima can be considered as peaks. A large Neighborhood allows only peaks that are brightest and furthest apart to be identified, while a small neigh-borhood allows many adjacent peaks to be identified separately. The Threshold parameter enables control over the minimal intensity that can be considered as a peak, and it is set by choosing the desired percentage from the image’s maximum intensity. The number of peaks identified, their mean intensity, and standard devi-ation are reported for each worm. In addition, the raw integrated density (RID) is calculated by summing the intensity values of all pixels within the worm’s area and subtracting the mean background intensity multiplied by the number of pixels in the worm’s area. Lastly, the CTWF is calculated by subtracting the mean intensity
within the worm from the mean intensity of its back-ground, which is then multiplied by the worm’s area.
Binary classification
The creation of a SVM model for binary classification is available, based on a labeled dataset generated by the Feature Extractor. Users may choose a kernel method, whether or not to standardize their data, and the number of cross validations on the data, aimed at reducing model overfitting. The program splits the data into a training set and a test set and performs optimization towards an appropriate SVM model. The resulting model may be later used to classify un-labeled datasets with similar features into the labels on which it was trained. One may create one’s train-ing dataset by manually labeltrain-ing worms and then use the model created based on the data to classify unlabeled worms. Alternatively, one may utilize the dataset to obtain prediction rates for various combi-nations of features, in order to assess the contribution of each feature towards accurate prediction (Fig. 2). We supply a trained model for the purpose of worm sex classification, but we recommend customized labeling and training to create bespoke models that would better suit each lab’s specifications.
Unsupervised scoring
The technique called t-SNE [5], for dimensionality re-duction, is particularly well suited for the visualization of high-dimensional datasets and gives each data point a location on a two- or three-dimensional map. The tech-nique is a variation of stochastic neighbor embedding that is easier to optimize and produces better visualiza-tions [26]. This method of unsupervised learning essen-tially enables scoring data within a single common dimension, giving each sample a continuous value. The data is pre-processed using PCA [6], reducing the Input Image
[64X128]
Convolutional Layer 1
16@3X3 (padding 2, stride 1):
Batch Normalization 1 ReLu Layer 1 Max-Pooling Layer 1
3X3 (padding 2, stride 2)
Convolutional Layer 2
32@3X3 (padding 1, stride 1)
Max-Pooling Layer 2
2X2 (padding 0, stride 2)
Batch Normalization 2 ReLu Layer 2
Convolutional Layer 3
64@3X3 (padding 1, stride 1)
Batch Normalization 3 ReLu Layer 3
Fully Connected Layer 1
100 units
Dropout Layer
0.25 probability
Fully Connected Layer 2
100 units
Softmax Layer Outputs:
Worm / Noise
dimensionality. Later, the dimensionality is reduced again via the t-SNE technique. If the data is indeed la-beled, although labels are not used by t-SNE itself, the labels can be used to color the resulting plot. The algo-rithm’s final output is the low-dimensional data representation.
Additional files
Additional file 1:WorMachine Manual, including links for Demo Video, Software Codes, and Sample TIFF Image. (PDF 737 kb)
Additional file 2: Figure S1.Typical input image. A standard image as acquired by the microscope (A) and after grayscaling (B). Scale bar 1 mm. Both images were compressed for their addition to the paper, but their original size was 1.1 GB. The resolution was 72 dpi with 16 bit depth, and the dimension was 17,610 × 16,116. (PPTX 355 kb)
Additional file 3: Table S1.Reliability of worm identification. Results showed percentage of worm retention from initial object count. This demonstrates that once objects are identified by the Image Processor, they are likely to be identified as a“real worm”rather than be removed as noise. (DOCX 11 kb)
Additional file 4: Figure S2.Features used to establish worm masculinity. Violin plots show the morphological features (A) and fluorescent features (B) used to determine the masculinity ofhim-5;[tph-1p::GFP]worms. A total of 545 pre-labeled worms of each sex were used for analysis (****p< 10–4, ***p< 10–3, *p< 0.05, two-tailedttest afterα= 0.01 trimming to exclude extreme outliers with false discovery rate (FDR) correction for multiple comparisons). Only features that were significantly distinct and had plausible theoretical justification to differentiate between sexes were used for sex phenotype prediction. As can be seen in this figure, males and hermaphrodites differ in some features but not in every feature examined. (PPTX 597 kb)
Additional file 5: Figure S3.Features contribution. Demonstrates the relative contribution of each feature to the separation across the first component of the PCA in Fig. 3. (PNG 13 kb)
Additional file 6: Figure S4.t-SNE visualizing the effect of temperature on the sexual phenotype. The same assay presented in Fig. 3 analyzed witht-SNE instead of PCA. (PNG 692 kb)
Additional file 7: Figure S5.Comparisons between scoring of different phenotypes using WorMachine and alternative scoring methods. A. CTWF measurements, taken either manually using ImageJ or automatically by WorMachine. B. Number of puncta, counted manually, or automatically by WorMachine. (PPTX 296 kb)
Additional file 8: Figure S6.Various worm images demonstrating WorMachine’s capabilities and limitations. A. Images show the software’s ability to skeletonize and analyze worms in a variety of postures. B. The software is limited in identifying worms that touch another worm or any point on their own body. These are flagged as faulty. Scale bar indicates 50μm. (PPTX 204 kb)
Acknowledgements
We want to thank all the Rechavi lab members and especially Dror Cohen, Hila Gingold, Amit Alon, and Itamar Lev for their help and guidance in many discussions. We also thank Yoav Zeevi, a Ph.D. student of Professor Yoav Benjamini, for his guidance with statistical tests performed throughout the paper. Some strains were provided by the Caenorhabditis Genetics Center (CGC), which is funded by the National Institutes of Health (NIH) Office of Research Infrastructure Programs (P40 OD010440).
Funding
A. Hakim and Y. Mor wish to thank the Sagol school of Neuroscience. Y. Mor is thankful for the TEVA NNE fellowship. A. Hakim is grateful to Dino Levi for his mentoring and support. O. Rechavi is thankful to the Adelis foundation grant #0604916191, ERC grant #335624, and ISF grant #1339/17 for funding.
Availability of data and materials
The datasets used and/or analyzed during the current study are available from the corresponding author on reasonable request. The complete software code was uploaded to GitHub and is available via the link in the manual, as part of Additional file 1.
Authors’contributions
AH and YMo conceived, designed, and developed the software. IAT helped with the design, experiments, and implementation of the software. YMa helped with imaging and analysis of the sexual phenotype assays. MN helped deal with theoretical software issues, with the PCA analysis, and with figure illustration. AL performed the aggregation assays and contributed the data from his polyQ35 experiments. All authors helped with the writing of the paper. All authors read and approved the final manuscript.
Ethics approval and consent to participate
Not applicable.
Consent for publication
Not applicable.
Competing interests
The authors declare that they have no competing interests.
Publisher’s Note
Springer Nature remains neutral with regard to jurisdictional claims in published maps and institutional affiliations.
Author details
1
Sagol School of Neuroscience, Tel Aviv University, Tel Aviv, Israel.
2Department of Neurobiology, Wise Faculty of Life Sciences, Tel Aviv
University, Tel Aviv, Israel.3Department of Biochemistry and Molecular Biology, Institute for Medical Research Israel-Canada (IMRIC), School of Medicine, The Hebrew University of Jerusalem, Jerusalem, Israel.
Received: 1 November 2017 Accepted: 21 December 2017
References
1. Moore BT, Jordan JM, Baugh LR, Byerly L, Cassada R, Russel R, et al. WormSizer: high-throughput analysis of nematode size and shape. PLoS One. 2013;8:e57142. http://dx.plos.org/10.1371/journal.pone.0057142. Accessed 12 Oct 2016.
2. Schindelin J, Arganda-Carreras I, Frise E, Kaynig V, Longair M, Pietzsch T, et al. Fiji: an open-source platform for biological-image analysis. Nat Methods. 2012;9:676–82. http://www.nature.com/doifinder/10.1038/nmeth.2019. Accessed 12 Oct 2016.
3. Jung S-K, Aleman-Meza B, Riepe C, Zhong W, Mathew M, Mathew N, et al. QuantWorm: a comprehensive software package for Caenorhabditis elegans phenotypic assays. PLoS One. 2014;9:e84830. http://journals.plos.org/ plosone/article?id=10.1371/journal.pone.0084830. Accessed 12 Oct 2016. 4. Wählby C, Kamentsky L, Liu ZH, Riklin-Raviv T, Conery AL, O’Rourke EJ, et al.
An image analysis toolbox for high-throughput C. elegans assays. Nat Methods. 2012;9:714–6. http://www.ncbi.nlm.nih.gov/pubmed/22522656. Accessed 4 Dec 2017.
5. van der Maaten L, Hinton G. Visualizing data using t-SNE. J Mach Learn Res. 2008;9:2579–605.
6. Jolliffe I. Principal component analysis. Chichester: John Wiley & Sons, Ltd; 2014. http://doi.wiley.com/10.1002/9781118445112.stat06472. Accessed 12 Oct 2016.
7. Linkert M, Rueden CT, Allan C, Burel J-M, Moore W, Patterson A, et al. Metadata matters: access to image data in the real world. J Cell Biol. 2010;189:777–82. http://www.ncbi.nlm.nih.gov/pubmed/20513764. Accessed 23 Oct 2017.
8. Bradley D, Roth G. Adaptive thresholding using the integral image. J Graph Tools. 2007;12:13–21. http://www.tandfonline.com/doi/abs/10.1080/ 2151237X.2007.10129236. Accessed 12 Oct 2016.
10. Hodgkin J, Horvitz HR, Brenner S. Nondisjunction mutants of the nematode Caenorhabditis elegans. Genetics. 1979;91:67–94.
11. Shyn SI, Kerr R, Schafer WR. Serotonin and Go modulate functional states of neurons and muscles controlling C. elegans egg-laying behavior. Curr Biol. 2003;13:1910–5.
12. Loer CM, Kenyon CJ. Serotonin-deficient mutants and male mating behavior in the nematode Caenorhabditis elegans. J Neurosci. 1993;13:5407–17. 13. Hodgkin J. Exploring the envelope: systematic alteration in the
sex-determination system of the nematode Caenorhabditis elegans. Genetics. 2002;162:767–80.
14. Chandler CH, Phillips PC, Janzen FJ. The evolution of sex-determining mechanisms: lessons from temperature-sensitive mutations in sex determination genes in Caenorhabditis elegans. J Evol Biol. 2009;22: 192–200.
15. Ko FCF, Chow KL. A novel thioredoxin-like protein encoded by the C. elegans dpy-11 gene is required for body and sensory organ
morphogenesis. Development. 2002;129:1185–94. http://www.ncbi.nlm.nih. gov/pubmed/11874914. Accessed 23 Oct 2017.
16. Simmer F, Tijsterman M, Parrish S, Koushika SP, Nonet ML, Fire A, Ahringer J, Plasterk RH. Loss of the putative RNA-directed RNA polymerase RRF-3 makes C. elegans hypersensitive to RNAi. Current biology. 2002;12(15):1317–1319. 17. Frøkjær-Jensen C, Davis MW, Ailion M, Jorgensen EM. Improved
Mos1-mediated transgenesis in C. elegans. Nat Methods. 2012;9:117–8. http:// www.nature.com/doifinder/10.1038/nmeth.1865. Accessed 23 Oct 2017. 18. Kopito RR. Aggresomes, inclusion bodies and protein aggregation. Trends
Cell Biol. 2000;10:524–30. http://www.ncbi.nlm.nih.gov/pubmed/11121744. Accessed 23 Oct 2017.
19. Morley JF, Brignull HR, Weyers JJ, Morimoto RI. The threshold for polyglutamine-expansion protein aggregation and cellular toxicity is dynamic and influenced by aging in Caenorhabditis elegans. Proc Natl Acad Sci. 2002;99:10417–22. http://www.ncbi.nlm.nih.gov/pubmed/12122205. Accessed 23 Oct 2017.
20. Caldwell GA, Cao S, Sexton EG, Gelwix CC, Bevel JP, Caldwell KA. Suppression of polyglutamine-induced protein aggregation in
Caenorhabditis elegans by torsin proteins. Hum Mol Genet. 2003;12:307–19. http://www.ncbi.nlm.nih.gov/pubmed/12554684. Accessed 23 Oct 2017. 21. Carpenter AE, Jones TR, Lamprecht MR, Clarke C, Kang I, Friman O, et al. Cell
Profiler: image analysis software for identifying and quantifying cell phenotypes. Genome Biol. 2006;7:R100. http://www.ncbi.nlm.nih.gov/ pubmed/17076895. Accessed 4 Dec 2017.
22. Stiernagle T. Maintenance of C. elegans. WormBook. 2006. http://www. wormbook.org/chapters/www_strainmaintain/strainmaintain.html. Accessed 23 Oct 2017.
23. Moulden B, Kingdom F, Gatley LF. The standard deviation of luminance as a metric for contrast in random-dot images. Perception. 1990;19:79–101. http://journals.sagepub.com/doi/10.1068/p190079. Accessed 4 Dec 2017. 24. Labocha MK, Jung S-K, Aleman-Meza B, Liu Z, Zhong W. WormGender—
open-source software for automatic Caenorhabditis elegans sex ratio measurement. PLoS One. 2015;10:e0139724. http://dx.plos.org/10.1371/ journal.pone.0139724. Accessed 23 Oct 2017.
25. Geng W, Cosman P, Huang C. Automated worm tracking and classification. 2003. Asilomar Conference on Signals, Systems and Computers, IEEE, 2004. http://citeseerx.ist.psu.edu/viewdoc/download;jsessionid=
3B3800028E12BA1492A95642DE70A3EB?doi=10.1.1.659.9101&rep= rep1&type=pdf. Accessed 23 Oct 2017.
26. Hinton GE, Roweis ST. Stochastic neighbor embedding. Advances in Neural Information Processing Systems 15 (NIPS 2002). p. 833–40. http://papers. nips.cc/paper/2276-stochastic-neighbor-embedding.pdf.
• We accept pre-submission inquiries
• Our selector tool helps you to find the most relevant journal
• We provide round the clock customer support
• Convenient online submission
• Thorough peer review
• Inclusion in PubMed and all major indexing services
• Maximum visibility for your research
Submit your manuscript at www.biomedcentral.com/submit