R E S E A R C H A R T I C L E
Open Access
Association of adipocyte genes with ASP
expression: a microarray analysis of subcutaneous
and omental adipose tissue in morbidly obese
subjects
Robin E MacLaren
1,2, Wei Cui
1,2, HuiLing Lu
1, Serge Simard
1, Katherine Cianflone
1,2*Abstract
Background:Prevalence of obesity is increasing to pandemic proportions. However, obese subjects differ in insulin resistance, adipokine production and co-morbidities. Based on fasting plasma analysis, obese subjects were
grouped as Low Acylation Stimulating protein (ASP) and Triglyceride (TG) (LAT) vs High ASP and TG (HAT).
Subcutaneous (SC) and omental (OM) adipose tissues (n = 21) were analysed by microarray, and biologic pathways in lipid metabolism and inflammation were specifically examined.
Methods:LAT and HAT groups were matched in age, obesity, insulin, and glucose, and had similar expression of insulin-related genes (InsR, IRS-1). ASP related genes tended to be increased in the HAT group and were correlated (factor B, adipsin, complement C3, p < 0.01 each). Differences between LAT and HAT group were almost
exclusively in SC tissue, with little difference in OM tissue. Increased C5L2 (p < 0.01), an ASP receptor, in HAT suggests a compensatory ASP pathway, associated with increased TG storage.
Results:HAT adipose tissue demonstrated increased lipid related genes for storage (CD36, DGAT1, DGAT2, SCD1, FASN, and LPL), lipolysis (HSL, CES1, perilipin), fatty acid binding proteins (FABP1, FABP3) and adipocyte
differentiation markers (CEBPa, CEBPb, PPARg). By contrast, oxidation related genes were decreased (AMPK, UCP1, CPT1, FABP7). HAT subjects had increased anti-inflammatory genes TGFB1, TIMP1, TIMP3, and TIMP4 while proinflammatory PIG7 and MMP2 were also significantly increased; all genes, p < 0.025.
Conclusion:Taken together, the profile of C5L2 receptor, ASP gene expression and metabolic factors in adipose tissue from morbidly obese HAT subjects suggests a compensatory response associated with the increased plasma ASP and TG.
Background
Obesity is a risk factor for metabolic syndrome, cardio-vascular disease, and diabetes [1,2]. The incidence of obesity has increased dramatically in the last decade throughout the world [3]. The rate of deaths from obe-sity related diseases is also on the rise. Understanding the factors that contribute to obesity related diseases is crucial to help obese patients achieve better health status.
Notwithstanding the strong associations of obesity with dyslipidemia and insulin resistance, it has been recognized in recent years that not all forms of obesity are the same. Visceral obesity presents a greater risk for obesity related disease than subcutaneous obesity [4]. Classification of obese populations based on their level of insulin sensitivity identifies distinct subsets variously referred to as insulin-sensitive obese [5-7], metaboli-cally-healthy but obese [8], and metabolically-normal obese [9]. In each of these cases, specific parameters, such as glucose or insulin, are within the normal healthy range found in non-obese subjects. Most studies classify “healthier obese subjects” according to insulin * Correspondence: [email protected]
1Centre de Recherche Institut Universitaire de Cardiologie et de
Pneumologie de Quebec, Laval University, Quebec, G1V 4G5, Canada
sensitivity, but also according to other parameters such as HDL cholesterol, plasma triglycerides [9,10], C-reac-tive protein, interleukin-6, LDL cholesterol, and visceral fat [11]. We have recently shown that intracellular insu-lin signalinsu-ling pathways in adipose tissue are different between insulin sensitive versus insulin resistant obese subjects [12].
However, in addition to altered glucose metabolism, dyslipidemias, such as elevated plasma triglyceride (TG), are common in obesity and are an independent risk fac-tor for many diseases including diabetes, metabolic syn-drome, and cardiovascular disease [1]. When coupled with other risk factors such as high LDL cholesterol, low HDL cholesterol, or insulin resistance, the risk for these diseases increases [13,14]. Accordingly, in the pre-sent study, obese subjects were evaluated based on char-acterization according to fasting triglyceridemia and acylation stimulating protein (ASP) to examine potential differences in adipose tissue gene expression.
Cellular studies have demonstrated that acylation sti-mulating protein (ASP) is a main anabolic stimulator of TG storage in adipose tissue and is produced by adipo-cytes [15]. ASP stimulates TG synthesis via the ASP receptor, C5L2, a seven transmembrane G protein coupled receptor [16,17]. Downstream several key sig-nalling proteins have been identified, including phos-pholipase C, phosphatidylinositol-3 kinase, Akt and protein kinase C [18] culminating in increased glucose transport and diacylglycerol acyltransferase activity [18]. ASP is identical to C3adesArg and is produced through the interaction of the precursor protein C3, Factor B, and adipsin (a.k.a. Factor D), components of the alterna-tive complement immune pathway which are secreted by adipose tissue.
In the adipose tissue milieu ASP levels increase post-prandially, although general circulating levels change lit-tle [19-21]. Overall, fasting ASP is strongly predictive of postprandial TG (evaluated as area-under-the-curve: AUC) in both men and women [22]. ASP is increased in obesity, as well as insulin resistance, diabetes, cardiovas-cular disease, hyperthyroidism and polycystic ovary syn-drome [15,23-25], all disorders associated with obesity [26,27]. However obesity is not an essential feature of elevated ASP levels, as ASP is increased in subjects with diabetes or polycystic ovary syndrome, even in the absence of obesity [25].
A direct association between plasma ASP on one hand and the metabolic function of the subcutaneous and omental adipose tissue on the other hand are unknown, and this is the first study to examine this. Further there are no studies on C5L2 adipose expression in humans. Our hypothesis was that morbidly obese subjects sepa-rated based on the fasting plasma levels of ASP and TG into HAT (High ASP and Triglyceride) and LAT (Low
ASP and Triglyceride) groups would demonstrate differ-ential expression of genes in lipid metabolic and inflam-matory biologic pathways. Characterization of subcutaneous and omental adipose tissue using a micro-array approach was used. To target lipid metabolic and inflammatory biologic pathways, all known genes in these pathways were identified and all those available in the microarray were pooled a priori, and then expres-sion in LAT vs HAT for both subcutaneous and omen-tal adipose tissue was evaluated.
Results
Subject Characteristics
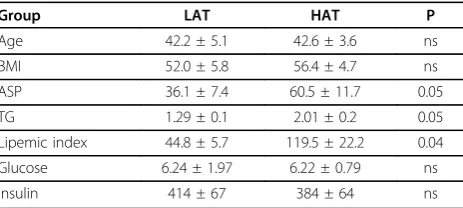
A total of 11 subjects participated in the microarray study. A fasting blood sample and subcutaneous and omental adipose tissue samples were taken from each subject. Of the 21 adipose samples, 20 were paired omental (OM) and subcutaneous (SC) samples from 10 subjects, and the remaining SC sample was unpaired. As shown in Table 1, the subjects were divided into 2 groups based on an ASP-TG lipemic index (as described in methods). Using this functional ASP calculation two groups were defined, one with low ASP, low TG, and thus a lower lipemic index which we have termed the Low ASP and TG group (LAT, n = 4) and a second group with high ASP (60.5 ± 11.7 vs. 36.1 ± 7.4 nmol/ L), TG (2.01 ± 0.2 vs. 1.3 ± 0.1 mmol/L), and lipemic index (119.5 ± 22.2 vs. 44.8 ± 5.7, p < 0.05), which we have termed the High ASP and TG group (HAT, n = 7). Both groups were morbidly obese based on body mass index (BMI) where a BMI > 30 kg/m2 is considered obese and BMI > 40.0 kg/m2 is morbidly obese [28]. The two groups did not differ significantly in average BMI (52.0 ± 5.8 vs. 56.4 ± 4.7, p=ns), nor in average age. Average insulin and glucose values were the same between the two groups (Table 1, p ns for all). While none of the patients had been previously diagnosed as diabetic, at the time of pre-operative sampling one
Table 1 Subject Characteristics.
Group LAT HAT P
Age 42.2 ± 5.1 42.6 ± 3.6 ns
BMI 52.0 ± 5.8 56.4 ± 4.7 ns
ASP 36.1 ± 7.4 60.5 ± 11.7 0.05
TG 1.29 ± 0.1 2.01 ± 0.2 0.05
Lipemic index 44.8 ± 5.7 119.5 ± 22.2 0.04
Glucose 6.24 ± 1.97 6.22 ± 0.79 ns
Insulin 414 ± 67 384 ± 64 ns
Age (years), body mass index (BMI, kg/m2
subject in the LAT group and two subjects in the HAT group had glucose values > 7.0. For all tables and fig-ures, the data are presented as averages ± SEM for the groups as indicated.
Microarray Analysis
In order to avoid sample bias, no samples were pooled prior to microarray analysis, and all 21 tissue samples were analysed individually. Two different analysis para-digms were used for the evaluation of the microarray results: (i) overall evaluation using SAM analysis and (ii) evaluation targeting the specific biological pathways of interest, lipid metabolism and inflammation. As the pri-mary hypothesis was to evaluate LAT (Low ASP-TG index) vs HAT (High ASP-TG index) we first compared these two groups using overall analysis. The cDNA microarrays contained a total of ~20,000 probes (~10,000 human genes, plus ESTs, housekeeping genes, and positive and negative controls) which were analysed for all 21 samples. Information on Codelink Uniset 20K I Gene List #30019 can be obtained directly from http:// www.gehealthcare.com/usen/microarrays/codelink_gene-lists.html. The complete data set is reported in GEO (Gene Expression Omnibus) available at: http://www. ncbi.nlm.nih.gov/geo/ as Accession # GSE 15524.
SAM (Significant Analysis of Microarrays) analysis was performed on SC and OM samples separately, but using the same analysis parameters. The SAM procedure [29] using version 3.09 is available at http://www-stat.stan-ford.edu/~tibs/SAM using suggested guidelines. This program is a validated statistical technique for identify-ing differentially expressed genes across high density microarrays. With an estimated false discovery rate (FDR) of 2.0%, and a minimum of a 2-fold change con-sidered significant, 464 genes were identified as signifi-cantly different between HAT and LAT in SC tissue (which represents 2.3% of all genes on the microarray). Using the same analysis parameters, no genes were iden-tified as significantly different between HAT and LAT in OM tissue. Using less stringent criteria (FDR = 5% and minimum 2-fold change), 1236 genes were identified in SC, but again, none in OM tissue. Even when criteria were relaxed to an FDR of 15%, only 6 genes were iden-tified in OM. Thus, the major changes between HAT and LAT were restricted to SC adipose tissue. When gene expression in OM tissue was compared to SC tis-sue using paired analysis and stringent parameters (FDR = 2.0% and minimum 2 fold difference), only 108 genes were identified. Using less stringent criteria (FDR = 5%, minimum 2 fold change), only 178 significant genes were identified. By far, the major differences in gene expression in relation to the classification of subjects as HAT or LAT using the lipemic index (plasma ASP and TG) in this sample set are in SC adipose tissue.
Therefore further analysis was focused on SC tissue, although supplementary information is provided for omental tissue as well.
The genes identified in SC adipose tissue were further examined. Of those genes identified as different using FDR = 2.0% and a minimum twofold change, 453 were up-regulated (positive genes) and 11 were down-regu-lated (negative genes) in HAT subjects as compared to LAT with q values for the genes identified ranging from 0.00000 to 0.02103. Gene description and access to Codelink Uniset 20K I Gene List #30019 http://www. gehealthcare.com/usen/microarrays/codelink_genelists. html were used to assign the genes manually into func-tional categories. Many of the genes identified (~50%) were tagged as EST, “hypothetical proteins” or clones labelled based on putative protein sequence as “similar to” or “hypothetical” with no known function. Of the genes with assigned function, the positively regulated genes coded for proteins involved in extracellular signal-ling (including cell-cell signalsignal-ling and endocrine func-tions), intracellular signalling, intermediary metabolism and energy metabolism, structural proteins, transcription and translation (including cell growth, differentiation, apoptosis and proteolysis) based on manual group assignment. A supplementary table listing the positive and negative genes is available upon request.
represents 58%. A number of these genes had also been identified using the SAM analysis (such as genes involved in lipid synthesis); this is a substantial path-way enrichment.
Housekeeping Genes & Insulin Related Genes
The expression of 4 housekeeping genes suggested for studies in adipose [30] was evaluated across all 11 SC samples was evaluated (Additional File 2, Table S2). The expression of B2M, GUSB, PPIA, and TFRC were con-stant across all 11 samples with no significant differ-ences when LAT and HAT were compared. There were no significant correlations between any of the house-keeping genes and age, BMI, or fasting plasma levels of ASP, TG, insulin, or glucose.
The expression of insulin receptor (InsR), insulin receptor substrates 1 and 4 (IRS1 and IRS4), insulin like growth factors 1 and 2 (IGF1 and IGF2) were also eval-uated (Additional File 2, Table). The expression of these genes was also constant across all 11 samples and not significantly different between the two groups, which is consistent with the plasma data for insulin and glucose. There were no significant correlations between these genes and age or BMI. As the two groups have similar insulin related gene profiles, differences between the 2 groups are not likely explained by differences in insulin signalling or sensitivity.
ASP Generation Genes
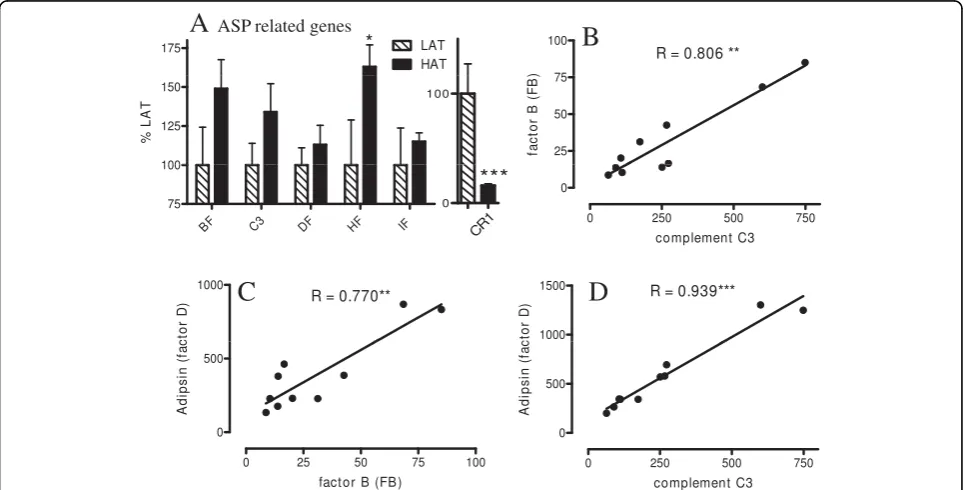
We next looked at genes related to plasma ASP genera-tion by adipose tissue. As previously published [31,32], the key genes in the conversion of complement C3 to its ASP form (aka C3adesArg) are all produced by adi-pocytes: C3, factor B (FB), adipsin (or factor D), and carboxypeptidase N (CPN1). Additionally, factors that enhance or inhibit the process are also produced by adi-pocytes: factors H, I, and properdin [33]. As shown in Figure 1A, C3, factor B and factor H are all moderately increased in HAT vs LAT (where LAT is set as 100%). We also analyzed the expression pattern of CR1, aka CD35, an inhibitor to both the classical and alternative complement pathways. CR1 inhibits both C3 and C5 convertases, thus decreasing production of C5a, C3a and desArg forms including ASP, and has a high affinity for C3b [34]. As CR1 was decreased in HAT SC tissue (Fig-ure 1A) this reduction may be permissive for increased ASP production via C3 convertase. Properdin, which stabilizes C3 convertase, also tended to be increased (Additional File 1, Table S1). Additionally, C3, adipsin and factor B were all closely correlated to one another in SC tissue (Figure 1B to 1D). These 3 genes also cor-related closely with other genes and have been termed the“ASP triad”in the present study. In omental (OM) tissue, although expression of C3 and factor B were higher than in SC, overall there was no difference
between LAT and HAT for any of the factors other than a decrease in factor B in HAT subjects (Additional File 1, Table S1).
Real time RT-PCR Analysis of ASP Receptor C5L2
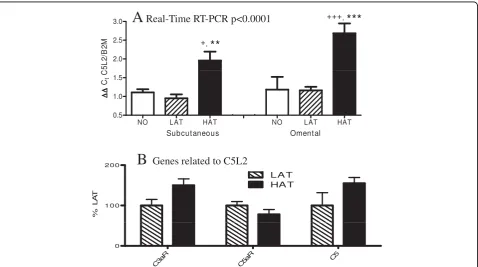
As C5L2, a newly identified receptor, was not present on the microarray used for analysis, quantitative expres-sion of C5L2 in the LAT and HAT groups was mea-sured using TAQMAN real time RT-PCR via the delta-delta Ct method relative to expression of B2M, a house-keeping gene. For the real time RT-PCR, a non-obese control group was added and results are provided for both SC and OM tissue, as this is the first quantitative measurement of C5L2 in human adipose tissue. This additional non-obese group had the following character-istics: BMI 25.1 ± 1.4 kg/m2, age 54.8 ± 7.6 years, plasma ASP 30.4 ± 1.5 nmol/L, plasma TG 1.12 ± 0.18 mmol/L, glucose 3.75 ± 0.21 mmol/L, insulin 137.2 ± 16.1 pmol/L and lipemic index 34.8 ± 6.7. As shown in Figure 2A, using 2-way ANOVA, there is a significant difference in groups (p < 0.0001), but no significant dif-ference between tissues (SC vs OM). With post-hoc
analysis, HAT is significantly increased vs LAT in SC and OM (p < 0.01 and p < 0.001, respectively), and HAT is also significantly different from NO in SC and OM (p < 0.05 and p < 0.001, respectively), while there was no significant difference between LAT and NO. There was also a positive correlation between expression in SC adipose tissue and OM adipose tissue, such that subjects with high expression in SC tissue also had high expression in OM (R = 0.676, p = 0.023).
Other complement factors and receptors
The majority of the genes involved in ASP production were initially identified as being alternative complement factors and thus part of the immune system [35]. There-fore we looked at the regulation of other complement factors, including C5 and two receptors of complement activation, C3aR and C5aR. The sequence of C5L2 clo-sely resembles these two receptors. It has been demon-strated [16,17,36] that C3a, C5a, and ASP all bind to C5L2, only C3a binds to C3aR, and only C5a binds to C5aR. Both C3aR and C5aR are expressed at similar levels in the LAT and HAT groups for both SC and
Figure 2C5L2 expression is increased in HAT group while similar immune receptors are unaltered. (A) C5L2 gene expression in SC and OM adipose tissue from control non-obese (NO), LAT, and HAT subjects as assessed byΔΔreal time RT-PCR for C5L2 relative to the
OM tissues (Figure 2B and Additional File 1, Table S1) and there is no significant correlation with C3, factor B or adipsin, although C5 had a negative correlation.
Lipid Synthesis Genes
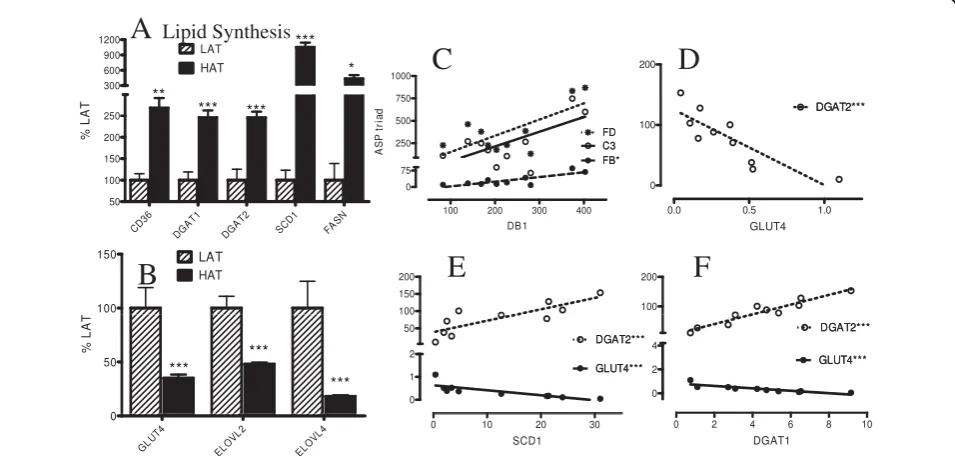
A wide variety of genes are involved in dietary lipid sto-rage and de novo lipid synthesis. We have focused here on all of the key genes that could be identified from each pathway including fatty acid and glucose transpor-ters (CD36, GLUT4), and TG synthesis enzymes such as diacylglycerol acyltransferases (DGAT1 and DGAT2), and fatty acid elongating enzymes (ELOV) potentially related to ASP function. Microarray analysis revealed increased expression of fatty acid transporter (CD36) but decreased glucose transporter (GLUT4, Figure 3). Genes involved in TG synthesis were up-regulated in the HAT group, including stearoyl CoA desaturase (SCD1), DGAT1 and DGAT 2, fatty acid synthase (FASN), phosphatidic acid phosphatase (PAP2A2) and malic enzyme (ME1) (Figure 3, Additional File 1, Table S1). On the other hand, other genes related to de novo fatty acid synthesis were down-regulated (Figure 3B). The fatty acid elongation enzyme genes (ELOVL2 and ELOVL4) were both down-regulated (Figure 3B). By contrast there were no significant differences in OM tis-sue, other than an increase in ME1 in HAT subjects
(Additional File 1, Table S1). It is interesting to note that there is a significant correlation with the ASP triad (C3/B/adipsin) and specific lipid metabolic genes, where DB1, DGAT1, ME1 and Glut4 are examples (Figure 3 and Additional File 1, Table S1) Several other genes cor-related well within the group of metabolic genes such as DGAT1, DGAT2, SCD1, FASN, GLUT4 and ELOV2 (Figure 3 and Additional File 1, Table S1).
Lipolysis Related Genes
A number of intracellular and extracellular adipocyte lipases hydrolyze TG. The main extracellular lipase, lipoprotein lipase (LPL), hydrolyzes dietary fats, releas-ing fatty acids for cellular transport and intracellular esterification to TG. LPL and hepatic lipase (LIPC), both of which localize to the cell surface membrane, tended to be up-regulated in the HAT group vs LAT and corre-lated significantly with the ASP triad in SC tissue (Fig-ure 4A, 4C, 4D). On the other hand, two additional extracellular lipases, pancreatic lipase (PNLIP) and endothelial lipase (EL), were down-regulated (Figure 4B and Additional File 1, Table S1).
Hormone sensitive lipase (HSL) was considered the primary intracellular adipocyte lipase responsible for releasing fatty acids from the cell; however, additional lipases have subsequently been identified. Both HSL,
and perilipin, which interacts directly with HSL to regu-late lipolysis, were up-reguregu-lated in the HAT group (Fig-ure 4E) as were carboxylesterase 1 (CES1, aka triacylglycerol lipase) and monoglyceride lipase (MGLL) (Figure 4E). These lipases correlated closely with the metabolic genes GLUT4, DGAT2 and HSL (Figure 4G, 4H, Additional File 1, Table S1). Adiponutrin, on the other hand, was down-regulated in the HAT group (Fig-ure 4F). Again, there were no differences for any of the genes in OM tissue, other than a decrease in LIPC in HAT subjects (Additional File 1, Table S1).
Oxidation Genes
A number of genes related to oxidation in adipose tissue were down-regulated in HAT vs LAT (Additional File 1, Table S1), including carnitine palmitoyltransferase (CPT-1C), carnitine acetyltransferase (CRAT), uncou-pling protein (UCP1), AMP-activated kinase (AMPK) as well as some AMPK regulatory genes (PRKAB2, PRKAG3, Additional File 1, Table S1). Other AMPK regulatory genes (PRKAA1, PRKAG1, and PRKAG2) were up-regulated in the HAT group (Additional File 1, Table S1). Acetyl CoA carboxylase (ACC) was increased in SC HAT tissue, and had some weak correlations with the ASP triad (Additional File 1, Table S1). The con-trasting regulation of ACC and AMPK is reflected in their opposing physiological roles: ACC catalyzes the rate limiting step in fatty acid synthesis and AMPK senses energy availability and inactivates ACC. CPT-1C and UCP1 (Additional File 3, Figure S1) were both cor-related with GLUT4 and DGAT2 but, consistent with the trends described above, only partially with any of the genes from the ASP triad (Additional File 1, Table S1). There were no differences in OM tissue between LAT and HAT for any genes except for PRKAG1 which increased in HAT subjects (Additional File 1, Table S1).
Fatty Acid Binding Protein (FABP) Genes
As shown in Additional File 4, Figure S2, some of the FABP group of genes were up-regulated in the HAT SC tissue, but not all (Additional File 4, Figure S2). Several correlated strongly with the ASP triad (Additional File 4, Figures S2C to S2E). Although FABP4 was first iden-tified in adipose tissue [37], all of these binding proteins are ubiquitously expressed. Further, FABP2 and FABP7 are decreased (Additional File 4, Figure S2B). The roles of FABP are varied, including differential binding of var-ious fatty acids, with functional links that include signal-ling and association with transcription factors, channelling to lipid synthesis vs oxidation, cell growth, proliferation and differentiation [38]. These differential roles of FABP may explain the opposite changes. How-ever no differences were detected in OM tissue (Addi-tional File 1, Table S1).
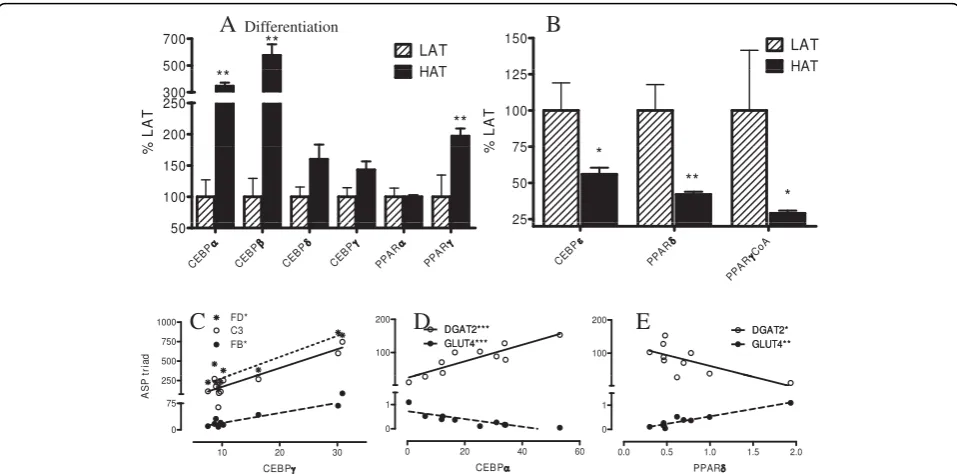
Differentiation Genes: the C/EBP and PPAR families Both the C/EBP and the PPAR nuclear receptor families are important factors in adipocyte differentiation. The C/EBP genes a andb were increased (Figure 5), while C/EBPεwas decreased (Figure 5B). C/EBPb is a check-point for differentiation and is induced by C/EBPa, which is increased early in the differentiation process. Interestingly, C/EBPgcorrelates with the ASP triad (Fig-ure 5C).
PPARgis best recognized as a late marker of differen-tiation. PPARgwas increased in the HAT group, along with many of the other differentiation genes (Figure 5A). However, PPARδwas an exception, being signifi-cantly down-regulated (Figure 5B). While the role of PPARδis not fully understood, it is believed that activa-tion of PPARδleads to increased fatty acid metabolism [39]. In accordance with decreased expression of genes in fatty acid oxidation, and increased expression of fatty acid storage genes, the decrease in PPARδis consistent with that interpretation. The majority of differentiation genes correlate with the metabolic genes (Figure 5). There was no change in OM tissue for any of the genes examined (Additional File 1, Table S1).
Inflammatory Genes
Recently, there has been intense interest in the potential interactions between adipocytes and macrophages within the adipose tissue milieu. The potential role of ASP in both the immune system and storage lipid metabolism makes it all the more pertinent to examine pro-and anti-inflammatory genes in association with ASP and the lipemic index. The anti-inflammatory genes trans-forming growth factor beta 1 (TGFB1) and tissue inhibi-tor of metalloproteinase (TIMP1, 3 and 4) were increased in the HAT group (Additional File 5, Figure S3A), with decreases in some interleukin genes such as IL4. Of the pro-inflammatory interleukin and receptor genes, there was little difference between the LAT and HAT groups other than for PIG7 (Additional File 5, Fig-ure S3B) with no difference in OM tissue (Additional File 1, Table S1).
changes between HAT and LAT (Additional File 1, Table S1).
Confirmatory Analysis by Real Time PCR
Confirmatory analysis by real time PCR using the delta-delta Ct method relative to expression of B2M, a house-keeping gene, was also conducted for 7 additional genes. The genes chosen included two genes with markedly increased expression in HAT vs LAT (CD36 and DGAT2), two genes with moderately increased expres-sion in HAT vs LAT (C3 and CEBPg) and two genes with little change in expression in HAT vs LAT (C5aR
and FABP4). In addition, results for insulin receptor (INSR) were also presented. Further, all genes were ana-lyzed in both SC and OM tissue, for all samples avail-able, in duplicate or triplicate. As can be seen in Table 2, overall results from the real-time PCR correlated well with the results from the microarray analysis in both SC and OM tissues from LAT and HAT subjects.
Discussion
Adipose tissue has been well documented as an endo-crine organ in the last two decades [42]. The recognition that ASP (aka C3adesArg) is produced by adipose tissue,
Figure 5Expression of CEBPs and PPARs in LAT vs HAT. Gene expression of differentiation related gene families, CEBPs and PPARs (A and B) in SC adipose tissue from LAT (hatched bars) and HAT (solid bars) as assessed by microarray where LAT expression is set at 100%. Correlations between the ASP triad and CEBPgare shown in (C) with R values (Spearman coefficients) for C3, FB, and adipsin are 0.527, 0.709, and 0.698 respectively. Correlations for CEBPa(D) and PPARδ(E) with GLUT4 and DGAT2 respectively are (D) -0.915, 0.830 and (E) 0.758, -0.673. Lines are based on linear regression. Data is expressed as means ± SEM where * p < 0.025, ** p < 0.01 and *** p < 0.001.
Table 2 Real Time PCR Analysis of Selected Genes in Subcutaneous and Omental LAT and HAT Groups
Gene Accession # Subcutaneous Omental
LAT HAT % LAT HAT %
C5L2 NM_018485 0.950 ± 0.105 1.958 ± 0.237** 206% (NA) 1.161 ± 0.096 2.684 ± 0.263** 231% (NA)
C3 NM_000064 0.588 ± 0.086 0.928 ± 0.117* 158% (134%) 2.655 ± 0.829 2.344 ± 0.026 88% (45%)
C5aR NM_00173 1.412 ± 0.189 1.588 ± 0.120 112% (78%) 1.738 ± 0.240 1.926 ± 0.229 111% (122%)
CD36 NM_000072 0.877 ± 0.134 1.717 ± 0.212** 196% (268%) 0.411 ± 0.072 0.874 ± 0.103** 213% (96%)
DGAT2 NM_032564 1.671 ± 0.358 3.383 ± 0.513* 202% (245%) 0.606 ± 0.207 1.110 ± 0.151* 183% (144%)
FABP4 NM_001442 0.732 ± 0.093 0.776 ± 0.075 106% (128%) 0.638 ± 0.064 0.739 ± 0.083 116% (92%)
CEBPg NM_001806 1.006 ± 0.226 1.497 ± 0.126* 160% (143%) 3.371 ± 1.694 3.607 ± 1.318 97% (75%)
INSR X02160 1.553 ± 0.278 1.580 ± 0.252 102% (112%) 1.407 ± 0.617 1.630 ± 0.371 116% (62%)
and that the three precursor proteins C3, factor B and adipsin, all increase with differentiation of adipocytes [43] was one of the first demonstrations that hormones with both paracrine and endocrine functions were pro-duced within the adipose milieu. The primary function of ASP in adipocytes appears to be promotion of lipid storage, and this is achieved through increases in fatty acid esterification and glucose uptake [44].
A number of human studies have demonstrated posi-tive associations between ASP and various metabolic disturbances (diabetes, metabolic syndrome, cardiovas-cular disease, nephrotic syndrome, polycystic ovary syn-drome) with or without the presence of obesity. Previous studies have demonstrated that circulating plasma ASP is associated with TG and fatty acid levels [15], with a strong correlation between fasting ASP and postprandial TG clearance even in non-obese individuals [22]. The demonstration of direct adipose tissue produc-tion of ASP postprandially in human studies [19-21], coupled to evidence that dietary TG in the form of chy-lomicrons directly stimulate C3 and ASP production in cultured human adipocytes [45,46] provides a strong link between plasma ASP and TG. Consequently, the aim of the present study was to evaluate microarray expression in subcutaneous vs. omental adipose tissue in relation to plasma ASP and TG (lipemic index), and genes directly related to ASP production, storage lipid metabolism and inflammation.
However, there are several limitations to this study. The samples were derived from morbidly obese subjects, limiting interpretations to that population. Further, although there were often large relative differences between the two groups (LAT vs HAT), the limited number of samples restricted the statistical power. There was also no functional analysis of the adipose tis-sue. On the other hand, the strengths of the study are that no samples were pooled and microarray analysis was conducted individually on all 21 samples. It should be noted that intact adipose tissue was specifically cho-sen for the analysis. This tissue reprecho-sents a pool of adi-pocytes as well as preadiadi-pocytes, macrophages, and endothelial cells. Direct analysis of the tissue prevented the introduction of artefactual changes resulting from processing and separating the various cell populations. Hence, this can be viewed as both a strength and a weakness.
Interestingly, while the design of the study allowed for a comprehensive comparison of gene expression between SC and OM adipose tissue, we discovered that the significant differences were found primarily in the SC tissue. SAM analysis determined that OM tissue did not have significant differences between the LAT and HAT groups. Targeted analysis of specific biological pathways allowed us to compare genes from many
different gene families simultaneously. Differential results between LAT and HAT in the SC tissue included genes involved in the alternative complement system, lipid synthesis, lipolysis, oxidation, fatty acid binding proteins, markers of differentiation, pro-inflammatory, anti-inflammatory, macrophage recruitment, and matrix remodelling genes. This contrasts markedly with a pre-vious study comparing insulin resistant obese with insu-lin sensitive obese where differences were primarily noted in OM tissue, with no differences in SC tissue [12]. This is a particularly interesting point. While dif-ferences in omental adipose tissue in relationship to insulin resistance have been noted (in microarray studies and others), our present study specifically identified dif-ferences in subcutaneous adipose tissue with respect to ASP related metabolism. While differences in subcuta-neous adipose tissue have been identified using other biochemical parameters (such as differences in triglycer-ide synthesis in subcutaneous adipose tissue in non-obese vs non-obese subjects) this is the first to identify this based on ASP metabolism. We speculate (as a hypoth-esis to be tested) that this may indicate a compensatory mechanism, whereby genes related to ASP are concomi-tantly increased with genes related to lipid storage, how-ever this remains to be tested in future studies.
In contrast to the demonstrated changes in the gene families described above, there were no significant dif-ferences in housekeeping genes, insulin signalling genes and non-related complement genes between these two groups (LAT vs HAT). We demonstrated that four genes commonly reported as housekeeping genes [30], B2M, GUSB, PPIA, and TFRC, were not significantly different between the LAT and HAT groups nor did they correlate with age or BMI. Further, not only were plasma glucose and insulin comparable between the 2 groups, the expression of genes related to insulin resis-tance and insulin signalling such as insulin receptor InsR, IRS-1, IRS-4, IGF1, and IGF2 were comparably expressed between LAT and HAT groups, and did not correlate with age or BMI. Further, the expression of other complement genes (C5) and receptors (C3aR, C5aR) that are not involved in ASP production or sig-nalling were not different between groups (LAT and HAT). This suggests that there is selective regulation of metabolic genes directly related to the role of ASP, inde-pendent of insulin or other immune related genes.
coupled receptor, has been shown to be present on human adipocytes and preadipocytes [17], but this is the first quantitative evaluation of C5L2 reported in human adipose tissue. While C5L2 is increased in the HAT group, the expression of C5L2 in the LAT group is very similar to the non-obese control group in both SC and OM tissue. Further, in the present study there was a sig-nificant correlation between C5L2 expression in SC and OM adipose tissue. These results are consistent with increased binding of ASP to adipose plasma membranes in obese subjects vs non-obese subjects, although the C5L2 receptor was as yet unrecognized at that time, and no plasma data was available [47]. We have also pre-viously demonstrated an association between SC and OM adipose tissue for radiolabelled ASP binding to plasma membranes, across a range of BMI from obese and non-obese subjects. On the other hand, in our pre-vious study, ASP binding and affinity was greater in SC vs OM adipose tissue, while in the present study, C5L2 mRNA expression was not different in SC vs OM, which could reflect a further level of regulation at the plasma membrane.
This is the first study evaluating expression of ASP related genes, including the receptor C5L2, in the con-text of plasma ASP. The few studies that have examined complement C3 gene expression in adipose tissue have demonstrated associations with BMI, adipose tissue site, insulin sensitivity, age and postprandial lipemia [48-53]. Only one study examined the levels of plasma ASP in relationship to adipose tissue gene expression and demonstrated significant associations between C3 mRNA, plasma ASP and both insulin sensitivity and postprandial TG [51].
This raises the question whether chronically increased plasma ASP represents an ASP resistant state (analogous to increased plasma insulin reflecting insulin resistance), or whether the increased ASP is compensatory. Hypothetically, the presence of increased plasma ASP, increased expression of C3, factor B and adipsin in the microarray and increased C5L2 based on real-time PCR would suggest a compensatory mechanism, indicative of a more effective response, and interpretation of the results are evaluated in that context below.
There was a striking correlation between the three genes most relevant to ASP production: C3, Factor B, and adipsin (aka Factor D), constituting an ASP triad. Other complement genes (C3aR and C5aR) that are neither related to ASP production nor signalling do not correlate with the “ASP triad.” This selectivity within the alternative complement pathway and the correlation with many metabolic genes points to the physiological relevance. A general trend observed was that the HAT group has up-regulated genes for lipid TG storage. Along with the high plasma ASP and high C5L2
receptor, there are multiple genes including intracellular lipid storage, lipoprotein lipase, and fatty acid trafficking genes that are increased in the HAT group. The simul-taneous increase in both lipid storage and lipolytic genes suggests an overall increase in substrate cycling and fatty acid flux [2,54]. Concurrently, de novo TG synth-esis and oxidative genes were down-regulated. Taken together, the cells appear to be responding to an increased plasma TG level in the HAT group and are increasing their uptake and storage of TG. Many of the increased storage genes correlated with the“ASP triad” of genes including DB1 and LPL. Among the oxidative genes, ACC correlates negatively with the ASP triad.
Changes in adipose tissue function implicate altera-tions in differentiation genes, remodelling genes, and inflammatory complications [40,41,55,56]. The HAT group is characterized by increased in differentiation factors CEBPa, b, and CEBPδas well as PPARg, consis-tent with the increased TG storage genes. Interestingly, we have previously demonstrated that ASP stimulates adipogenesis in cultured 3T3-L1 and 3T3-F442A cells, reflected by early increases in CEBP, followed later by increases in PPARg, DGAT-1, adipsin and TG accumu-lation [57].
The HAT group is also characterized by increased anti-inflammatory gene TGFb1 and inhibitors of metal-loproteinases TIMP1, TIMP3 and TIMP4 and decreased metalloproteinase MMP20 and MMP10. On the other hand, there were few increases in pro-inflammatory genes, although pro-inflammatory and cell remodelling factors such as PIG7, CCR2 and MMP2 were increased. An interesting link between the role of the alternative complement pathway factors ASP and C5L2 and immune and adipose have been supported by active demonstration of adipose tissue macrophage infiltration, apoptosis and tissue remodelling in obesity, and the dif-ferences demonstrated between HAT and LAT.
Conclusion
Overall, the profile of C5L2 receptor, ASP gene expres-sion and metabolic factors in adipose tissue from the HAT group of morbidly obese subjects suggests a com-pensatory response associated with the increased plasma ASP and TG. A shift in the various pro-inflammatory, anti-inflammatory, macrophage recruitment and matrix remodelling proteins demonstrates a differential expres-sion in the HAT group, although the specific benefits or deleterious effects of this regulation remain to be elucidated.
Methods Subjects
there were two men and nine women, all morbidly obese (BMI > 40 kg/m2). Chi2 analysis indicated no sig-nificant difference in gender distribution. A sample of subcutaneous and omental adipose tissue along with a fasting blood sample were collected during gastric bypass surgery (n = 11). Ethics approval for this project was obtained from the McGill University Health Centre (Royal Victoria Hospital) ethics review committee (Mon-treal, QC) and subjects signed an informed consent form prior to participation. Of the 11 subjects, none had previously been identified as having diabetes or any other known disease (other than the presence of morbid obesity). All women were pre-menopausal. None were taking hypoglycaemic or lipid lowering medication. Body weight was stable at the time of study.
For the real time RT-PCR analysis, a lean control group was included to compare C5L2 gene expression (a gene not on the microarray) to the morbidly obese subjects. This group consisted of four non-obese sub-jects, two women and two men. Adipose tissue samples were collected during elective hysterectomy surgery (n = 2), valve replacement (n = 1), and hernia (n = 1) sur-geries. All other inclusion/exclusion parameters were the same as for the morbidly obese group. Although we cannot rule out the presence of an inflammatory com-ponent in these subjects, all were elective and not emer-gency surgeries.
Blood samples
Venous blood samples were collected in the fasting state into non-heparinized EDTA tubes. Samples were col-lected at 7:00 am, on the ward following a 12 hour fast, prior to transfer of patients to surgery. Blood samples were centrifuged at 2000 rpm at 4°C for 10 minutes and plasma was stored at -80°C for later analysis. Insulin levels were measured by RIA (Medicorp, Montreal, Canada). Glucose was measured by colorimetric enzyme assay (GOD-PAP, Roche Diagnostics. Plasma triglycer-ides were measured by GPO-PAP (glycerol phosphate oxidase coupled to phenol and 4-aminophenazone) method. ASP levels were measured by colorimetric enzymatic ELISA [44].
Calculation of Indices
A lipemic index utilizing the fasting values of ASP and TG was calculated. ASP strongly correlates with post-prandial TG [22], therefore a lipemic index of [ASP × TG] may be indicative of ASP effects on clearance of postprandial TG.
Adipose tissue microarray
Adipose tissue was collected at the beginning of the operation (within 30 minutes) into sterile 50 mL conical tubes and immediately flash- frozen in liquid nitrogen.
Subcutaneous adipose tissue was collected from the sub-cutaneous abdominal wall and omental adipose tissue was collected from the greater omentum which is repre-sentative of intra-abdominal adipose depots drained by the portal vein. RNA was extracted from tissues using Qiagen spin columns (Qiagen, Mississauga, Canada) fol-lowing manufacturer’s protocol for fatty tissue with the addition of two RNase free DNase treatments (Qiagen) between RW1 washes. RNA quality was assessed by spectrometry (260/280 ratio) with ratios of 1.9 - 2.0. As well, RNA quality was assessed by chromatography. Synthesis of cRNA by in vitro transcription and hybridi-sation was performed as previously described [12,58]. Briefly, 10 ug of high quality total RNA was converted to cDNA and then to biotin-labelled cRNA (10 mM Biotin-11-UTP, Perkin-Elmer) by linear amplification (iExpress Assay reagent kit, GE Healthcare Bio-Sciences, Montreal, Quebec). 10 ug of labelled cRNA was hybri-dised to CodeLink UniSet Human 20 K I (GE Health-care Bio-Sciences). The microarray slides were processed according to manufacturer’s instructions and analysed using Codelink System Software (GE Health-care Bio-Sciences). The spot intensities were median normalized (signal intensity of probe/median intensity of all discovery probes). The results have been deposited to GEO database under accession number GSE 15524.
Real Time RT-PCR
Real time RT-PCR was used to evaluate the expression pattern of C5L2, the ASP receptor, because no probes for C5L2 were present on the microarray. The specific
primer/probe sets used were human C5L2
which was linear within the tested exponential range, and all samples (n = 15) were analysed simultaneously, in duplicate or triplicate (no samples were pooled). Expression patterns for all genes, including C5L2 were analysed by real-time PCR using delta delta CTmethod expressed relative to the housekeeping gene B2M, according to manufacturer’s protocol. Further, B2M was shown to be consistent across all samples (no significant changes) in both the microarray analysis (Additional File 2, Table S2) and in real time RT-PCR.
Analysis and Statistics
Plasma data is presented as means ± SEM, and the two groups (HAT vs LAT) were compared by 2-sided t-test. The results were considered significant with p-values≤ 0.05. For real-time PCR, data is presented as means ± SEM data. For C5L2 data, the groups were compared by two-way ANOVA for tissue (SC and OM) and groups (HAT, LAT, and NO) with all-pairwise post-hoc test used to compare significant differences between groups. For all other genes analyzed by real-time PCR, the two groups (HAT vs LAT) were compared by 2-sided t-test. The results were considered significant with p-values≤0.05.
Two types of analysis were conducted for the microar-ray analysis: (i) SAM analysis and (ii) targeted analysis of biologic pathways involved in lipid storage and inflam-mation. For the former, analysis was conducted using SAM (Significant Analysis of Microarrays) program [29] version 3.09 and available at http://www-stat.stanford. edu/~tibs/SAM using suggested guidelines (see on-site manual). This program is a validated statistical techni-que for identifying differentially expressed genes across high density microarrays. This analysis technique pro-vides a list of significant differentially expressed genes and their q values, and an estimate of the false discovery rate (FDR) which represents the percentage of genes that could be identified by chance [29]. Following SAM analysis of subcutaneous and omental tissues, we further analyzed the data targeting specific metabolic biologic pathways (according to the a priori hypothesis).
For the targeted microarray analysis, the following procedure was used: (i) using known biochemical path-ways, a list of proteins/genes involved in ASP genera-tion, complement related factors, lipid storage metabolism including TG synthesis, lipolysis and oxida-tion, adipocyte differentiaoxida-tion, and inflammatory genes were collated; (ii) accession numbers were identified using Entrez Gene http://www.ncbi.nlm.nih.gov/; (iii) the Codelink gene list was screened to tag all of the accession numbers present in the array; (iv) all genes identified with the associated SC and OM datasets were then pooled and (v) the data was then statistically ana-lyzed for HAT vs LAT. All data was assembled prior to
initiating analysis on HAT vs LAT. All genes identified in these pathways are presented for SC and OM tissues (Additional File 1, Table S1), whether significantly dif-ferent or not (according to a 2-sided t-test).
Microarray data were expressed using mean ± SEM. The cross-nested design was to analyze two experimen-tal factors: (i) the comparison between two groups (LAT versus HAT), and (ii) between the different tissues (SC vs OM). A mixed model analysis was performed with interaction between the fixed factors. To proceed with the analysis, we used a model with a compound symme-try structure. For most variables, values were log trans-formed to stabilize variances. Reported p values are based on these transformations. Relationships between variables were expressed using Spearman correlation coefficients. For all microarray data, the results were considered significant with p-values ≤0.025, where ns indicates not significant. Graphical and statistical ana-lyses were conducted using GraphPad Prism (San Diego, CA), SAS, version 9.1.3 (SAS Institute Inc, Cary, NC) and SigmaStat (Jandel Scientific, CA).
Additional file 1: Table 1: Microarray expression in subcutaneous and omental adipose tissue of genes involved in adipose metabolism. Table of results of subcutaneous and omental adipose tissue in LAT and HAT, and correlation values with selected parameters Click here for file
[ http://www.biomedcentral.com/content/supplementary/1755-8794-3-3-S1.PDF ]
Additional file 2: Table 2: Housekeeping genes and genes related to insulin resistance. Table of results of housekeeping genes in LAT and HAT
Click here for file
[ http://www.biomedcentral.com/content/supplementary/1755-8794-3-3-S2.PDF ]
Additional file 3: Figure 1: Expression of oxidation related genes in SC adipose tissue in LAT and HAT. Graphics figure of correlations between oxidation related genes
Click here for file
[ http://www.biomedcentral.com/content/supplementary/1755-8794-3-3-S3.PDF ]
Additional file 4: Figure 2: Expression of fatty acid binding protein genes in SC adipose tissue in LAT and HAT. Graphics figure of correlations between fatty acid binding protein genes
Click here for file
[ http://www.biomedcentral.com/content/supplementary/1755-8794-3-3-S4.PDF ]
Additional file 5: Figure 3: Inflammatory profile of pro- and anti-inflammatory genes in SC adipose tissue in LAT and HAT. Graphics figure of correlations between pro- and anti-inflammatory genes Click here for file
[ http://www.biomedcentral.com/content/supplementary/1755-8794-3-3-S5.PDF ]
Additional file 6: Figure 4: Macrophage recruitment and matrix metalloproteinase genes in SC tissue in HAT and LAT. Graphics figure of correlations between macrophage recruitment and matrix metalloproteinase genes
Click here for file
Acknowledgements
This work was supported by a grant from CIHR (MOP77532) to KC, KC holds a Canada Research Chair in Adipose Tissue, and RM was supported by a scholarship from NSERC.
Author details
1Centre de Recherche Institut Universitaire de Cardiologie et de
Pneumologie de Quebec, Laval University, Quebec, G1V 4G5, Canada.
2Experimental Medicine, McGill University Health Centre, Montreal, Quebec,
H3A 1A1, Canada.
Authors’contributions
RM designed the overall project, recruited samples, carried out the microarray analysis and real-time PCR analysis as well as analyzed the data and drafted the manuscript. WC and HLL were responsible for microarray analysis and real-time PCR (with RM), as well as contributing to data analysis and writing of the manuscript. SS, a biostatistician, was responsible for statistical analysis, interpretation and contribution to writing the manuscript. KC designed and oversaw the research as principal investigator and contributed to writing the manuscript. All authors read and approved the final manuscript.
Competing interests
The authors declare that they have no competing interests.
Received: 20 October 2008
Accepted: 27 January 2010 Published: 27 January 2010
References
1. Redinger RN:The prevalence and etiology of nongenetic obesity and associated disorders.South Med J2008,101:395-399.
2. Frayn KN:Adipose tissue and the insulin resistance syndrome.Proc Nutr Soc2001,60:375-380.
3. James WP:The epidemiology of obesity: the size of the problem.J Intern Med2008,263:336-352.
4. Seidell JC, Hautvast JG, Deurenberg P:Overweight: fat distribution and health risks. Epidemiological observations. A review.Infusionstherapie 1989,16:276-281.
5. Reaven G:All obese individuals are not created equal: insulin resistance is the major determinant of cardiovascular disease in overweight/obese individuals.Diab Vasc Dis Res2005,2:105-112.
6. Reaven G, Abbasi F, McLaughlin T:Obesity, insulin resistance, and cardiovascular disease.Recent Prog Horm Res2004,59:207-223. 7. Sims EA:Are there persons who are obese, but metabolically healthy?.
Metabolism2001,50:1499-1504.
8. Karelis AD, St Pierre DH, Conus F, Rabasa-Lhoret R, Poehlman ET:Metabolic and body composition factors in subgroups of obesity: what do we know?.J Clin Endocrinol Metab2004,89:2569-2575.
9. Brochu M, Tchernof A, Dionne IJ, Sites CK, Eltabbakh GH, Sims EA, Poehlman ET:What are the physical characteristics associated with a normal metabolic profile despite a high level of obesity in postmenopausal women?.J Clin Endocrinol Metab2001,86:1020-1025. 10. Lim SC, Tan BY, Chew SK, Tan CE:The relationship between insulin
resistance and cardiovascular risk factors in overweight/obese non-diabetic Asian adults: the 1992 Singapore National Health Survey.Int J Obes Relat Metab Disord2002,26:1511-1516.
11. Shin MJ, Hyun YJ, Kim OY, Kim JY, Jang Y, Lee JH:Weight loss effect on inflammation and LDL oxidation in metabolically healthy but obese (MHO) individuals: low inflammation and LDL oxidation in MHO women. Int J Obes (Lond)2006,30:1529-1534.
12. MacLaren R, Cui W, Simard S, Cianflone K:Influence of obesity and insulin sensitivity on insulin signaling genes in human omental and
subcutaneous adipose tissue.J Lipid Res2008,49:308-323. 13. Calabro P, Yeh ET:Intra-abdominal adiposity, inflammation, and
cardiovascular risk: new insight into global cardiometabolic risk.Curr Hypertens Rep2008,10:32-38.
14. Bonora E:The metabolic syndrome and cardiovascular disease.Ann Med 2006,38:64-80.
15. Cianflone K, Xia Z, Chen LY:Critical review of acylation-stimulating protein physiology in humans and rodents.Biochim Biophys Acta2003,
1609:127-143.
16. Kalant D, Cain SA, Maslowska M, Sniderman AD, Cianflone K, Monk PN:The chemoattractant receptor-like protein C5L2 binds the C3a des-Arg77/ acylation-stimulating protein.J Biol Chem2003,278:11123-11129. 17. Kalant D, MacLaren R, Cui W, Samanta R, Monk PN, Laporte SA, Cianflone K:
C5L2 is a functional receptor for acylation-stimulating protein.J Biol Chem2005,280:23936-23944.
18. Maslowska M, Legakis H, Assadi F, Cianflone K:Targeting the signaling pathway of acylation stimulating protein.J Lipid Res2006,47:643-652. 19. Kalant D, Phelis S, Fielding BA, Frayn KN, Cianflone K, Sniderman AD:
Increased postprandial fatty acid trapping in subcutaneous adipose tissue in obese women.J Lipid Res2000,41:1963-1968.
20. Saleh J, Summers LK, Cianflone K, Fielding BA, Sniderman AD, Frayn KN:
Coordinated release of acylation stimulating protein (ASP) and triacylglycerol clearance by human adipose tissue in vivo in the postprandial period.J Lipid Res1998,39:884-891.
21. Sniderman AD, Cianflone K, Summers L, Fielding B, Frayn K:The acylation-stimulating protein pathway and regulation of postprandial metabolism. Proc Nutr Soc1997,56:703-712.
22. Cianflone K, Zakarian R, Couillard C, Delplanque B, Despres JP, Sniderman A:
Fasting acylation-stimulating protein is predictive of postprandial triglyceride clearance.J Lipid Res2004,45:124-131.
23. Maslowska M, Vu H, Phelis S, Sniderman AD, Rhode BM, Blank D, Cianflone K:Plasma acylation stimulating protein, adipsin and lipids in non-obese and obese populations.Eur J Clin Invest1999,29:679-686. 24. Yu H, Yang Y, Zhang M, Lu H, Zhang J, Wang H, Cianflone K:Thyroid
status influence on adiponectin, acylation stimulating protein (ASP) and complement C3 in hyperthyroid and hypothyroid subjects.Nutr Metab (Lond)2006,3:13.
25. Yang Y, Lu HL, Zhang J, Yu HY, Wang HW, Zhang MX, Cianflone K:
Relationships among acylation stimulating protein, adiponectin and complement C3 in lean vs obese type 2 diabetes.Int J Obes (Lond)2006,
30:439-446.
26. Cottam DR, Mattar SG, Barinas-Mitchell E, Eid G, Kuller L, Kelley DE, Schauer PR:The chronic inflammatory hypothesis for the morbidity associated with morbid obesity: implications and effects of weight loss. Obes Surg2004,14:589-600.
27. Fruhbeck G:The adipose tissue as a source of vasoactive factors.Curr Med Chem Cardiovasc Hematol Agents2004,2:197-208.
28. Sucharda P:[Clinical significance of the quantification of obesity. The Quetelet index and its use].Cas Lek Cesk1989,128:1040-1043. 29. Tusher VG, Tibshirani R, Chu G:Significance analysis of microarrays
applied to the ionizing radiation response.Proc Natl Acad Sci USA2001,
98:5116-5121.
30. Gorzelniak K, Janke J, Engeli S, Sharma AM:Validation of endogenous controls for gene expression studies in human adipocytes and preadipocytes.Horm Metab Res2001,33:625-627.
31. Cianflone KM, Sniderman AD, Walsh MJ, Vu HT, Gagnon J, Rodriguez MA:
Purification and characterization of acylation stimulating protein.J Biol Chem1989,264:426-430.
32. Sniderman AD, Cianflone K:The adipsin-ASP pathway and regulation of adipocyte function.Ann Med1994,26:388-393.
33. Peake PW, O’Grady S, Pussell BA, Charlesworth JA:Detection and quantification of the control proteins of the alternative pathway of complement in 3T3-L1 adipocytes.Eur J Clin Invest1997,27:922-927. 34. Krych-Goldberg M, Atkinson JP:Structure-function relationships of
complement receptor type 1.Immunol Rev2001,180:112-122. 35. Giclas PC:Alternative pathway evaluation.Curr Protoc Immunol2001,
Chapter 13, Unit.
36. Gerard NP, Lu B, Liu P, Craig S, Fujiwara Y, Okinaga S, Gerard C:An anti-inflammatory function for the complement anaphylatoxin C5a-binding protein, C5L2.J Biol Chem2005,280:39677-39680.
37. Gerbens F, Jansen A, van Erp AJ, Harders F, Meuwissen TH, Rettenberger G, Veerkamp JH, te Pas MF:The adipocyte fatty acid-binding protein locus: characterization and association with intramuscular fat content in pigs. Mamm Genome1998,9:1022-1026.
38. Chmurzynska A:The multigene family of fatty acid-binding proteins (FABPs): function, structure and polymorphism.J Appl Genet2006,
47:39-48.
40. Bourlier V, Zakaroff-Girard A, Miranville A, De Barros S, Maumus M, Sengenes C, Galitzky J, Lafontan M, Karpe F, Frayn KN,et al:Remodeling phenotype of human subcutaneous adipose tissue macrophages. Circulation2008,117:806-815.
41. Strissel KJ, Stancheva Z, Miyoshi H, Perfield JW, DeFuria J, Jick Z,
Greenberg AS, Obin MS:Adipocyte death, adipose tissue remodeling, and obesity complications.Diabetes2007,56:2910-2918.
42. Rocha VZ, Libby P:The multiple facets of the fat tissue.Thyroid2008,
18:175-183.
43. Cianflone K, Roncari DA, Maslowska M, Baldo A, Forden J, Sniderman AD:
Adipsin/acylation stimulating protein system in human adipocytes: regulation of triacylglycerol synthesis.Biochemistry1994,33:9489-9495. 44. Baldo A, Sniderman AD, St Luce S, Avramoglu RK, Maslowska M, Hoang B,
Monge JC, Bell A, Mulay S, Cianflone K:The adipsin-acylation stimulating protein system and regulation of intracellular triglyceride synthesis.J Clin Invest1993,92:1543-1547.
45. Maslowska M, Scantlebury T, Germinario R, Cianflone K:Acute in vitro production of acylation stimulating protein in differentiated human adipocytes.J Lipid Res1997,38:1-11.
46. Scantlebury T, Maslowska M, Cianflone K:Chylomicron-specific
enhancement of acylation stimulating protein and precursor protein C3 production in differentiated human adipocytes.J Biol Chem1998,
273:20903-20909.
47. Saleh J, Christou N, Cianflone K:Regional specificity of ASP binding in human adipose tissue.Am J Physiol1999,276:E815-E821.
48. Xia Z, Cianflone K:Acylation-stimulating protein precursor proteins in adipose tissue in human obesity.Metabolism2003,52:1360-1366. 49. Gabrielsson BG, Johansson JM, Lonn M, Jernas M, Olbers T, Peltonen M,
Larsson I, Lonn L, Sjostrom L, Carlsson B,et al:High expression of complement components in omental adipose tissue in obese men.Obes Res2003,11:699-708.
50. Ylitalo K, Nuotio I, Viikari J, Auwerx J, Vidal H, Taskinen MR:C3, hormone-sensitive lipase, and peroxisome proliferator-activated receptor gamma expression in adipose tissue of familial combined hyperlipidemia patients.Metabolism2002,51:664-670.
51. Koistinen HA, Vidal H, Karonen SL, Dusserre E, Vallier P, Koivisto VA, Ebeling P:Plasma acylation stimulating protein concentration and subcutaneous adipose tissue C3 mRNA expression in nondiabetic and type 2 diabetic men.Arterioscler Thromb Vasc Biol2001,21:1034-1039. 52. Imbeault P, Vidal H, Tremblay A, Vega N, Nadeau A, Despres JP, Mauriege P:
Age-related differences in messenger ribonucleic acid expression of key proteins involved in adipose cell differentiation and metabolism.J Clin Endocrinol Metab2001,86:828-833.
53. Dusserre E, Moulin P, Vidal H:Differences in mRNA expression of the proteins secreted by the adipocytes in human subcutaneous and visceral adipose tissues.Biochim Biophys Acta2000,1500:88-96. 54. Hammond VA, Johnston DG:Substrate cycling between triglyceride and
fatty acid in human adipocytes.Metabolism1987,36:308-313.
55. Medina-Gomez G, Gray S, Vidal-Puig A:Adipogenesis and lipotoxicity: role of peroxisome proliferator-activated receptor gamma (PPARgamma) and PPARgammacoactivator-1 (PGC1).Public Health Nutr2007,10:1132-1137. 56. Poulain-Godefroy O, Lecoeur C, Pattou F, Fruhbeck G, Froguel P:
Inflammation is associated with a decrease of lipogenic factors in omental fat in women.Am J Physiol Regul Integr Comp Physiol2008,295: R1-7.
57. Maslowska M, Wang HW, Cianflone K:Novel roles for acylation stimulating protein/C3adesArg: a review of recent in vitro and in vivo evidence. Vitam Horm2005,70:309-332.
58. Jones KL, Kins SS, Iqbal MJ:Endophyte-Infected Tall Fescue Diet Alters Gene Expression in Heifer Luteal Tissue as Revealed by Interspecies Microarray Analysis.Molecular Reproductive Developement2004, ,67:
154-161.
Pre-publication history
The pre-publication history for this paper can be accessed here:http://www. biomedcentral.com/1755-8794/3/3/prepub
doi:10.1186/1755-8794-3-3
Cite this article as:MacLarenet al.:Association of adipocyte genes with ASP expression: a microarray analysis of subcutaneous and omental adipose tissue in morbidly obese subjects.BMC Medical Genomics2010 3:3.
Submit your next manuscript to BioMed Central and take full advantage of:
• Convenient online submission
• Thorough peer review
• No space constraints or color figure charges
• Immediate publication on acceptance
• Inclusion in PubMed, CAS, Scopus and Google Scholar • Research which is freely available for redistribution