Open Access
Research article
Carboplatin-induced gene expression changes
in vitro
are
prognostic of survival in epithelial ovarian cancer
Panagiotis A Konstantinopoulos
1, Elena Fountzilas
1, Kamana Pillay
1,
Luiz F Zerbini
2, Towia A Libermann
2, Stephen A Cannistra
1and
Dimitrios Spentzos*
1,2Address: 1Division of Hematology/Oncology, Beth Israel Deaconess Medical Center, Harvard Medical School, Boston, Massachusetts, USA and 2Division of Interdisciplinary Medicine and Biotechnology, Beth Israel Deaconess Medical Center, Harvard Medical School, Boston, Massachusetts, USA
Email: Panagiotis A Konstantinopoulos - [email protected]; Elena Fountzilas - [email protected];
Kamana Pillay - [email protected]; Luiz F Zerbini - [email protected]; Towia A Libermann - [email protected]; Stephen A Cannistra - [email protected]; Dimitrios Spentzos* - [email protected]
* Corresponding author
Abstract
Background: We performed a time-course microarray experiment to define the transcriptional response to carboplatin in vitro, and to correlate this with clinical outcome in epithelial ovarian cancer (EOC). RNA was isolated from carboplatin and control-treated 36M2 ovarian cancer cells at several time points, followed by oligonucleotide microarray hybridization. Carboplatin induced changes in gene expression were assessed at the single gene as well as at the pathway level. Clinical validation was performed in publicly available microarray datasets using disease free and overall survival endpoints.
Results: Time-course and pathway analyses identified 317 genes and 40 pathways (designated time-course and pathway signatures) deregulated following carboplatin exposure. Both types of signatures were validated in two separate platinum-treated ovarian and NSCLC cell lines using published microarray data. Expression of time-course and pathway signature genes distinguished between patients with unfavorable and favorable survival in two independent ovarian cancer datasets. Among the pathways most highly induced by carboplatin in vitro, the NRF2, NF-kB, and cytokine and inflammatory response pathways were also found to be upregulated prior to chemotherapy exposure in poor prognosis tumors.
Conclusion: Dynamic assessment of gene expression following carboplatin exposure in vitro can identify both genes and pathways that are correlated with clinical outcome. The functional relevance of this observation for better understanding the mechanisms of drug resistance in EOC will require further evaluation.
Background
Epithelial ovarian cancer (EOC) is the leading cause of cancer mortality from gynecologic malignancies [1]. The
majority of patients present with advanced disease that is typically managed with surgical cytoreduction followed by postoperative chemotherapy [2]. Platinum analogs
Published: 28 November 2008
BMC Medical Genomics 2008, 1:59 doi:10.1186/1755-8794-1-59
Received: 8 July 2008 Accepted: 28 November 2008
This article is available from: http://www.biomedcentral.com/1755-8794/1/59
© 2008 Konstantinopoulos et al; licensee BioMed Central Ltd.
including carboplatin (CBDCA, cis-diammine-1,1-cyclob-utane dicarboxylate platinum) are the mainstay of treat-ment yielding response rates of approximately 70% in newly diagnosed patients with advanced disease [3,4]. However, the major limitation to the successful treatment of EOC is the frequent development of disease recurrence, followed by resistance to chemotherapy, resulting in an overall 5-year survival of only 20–30% for patients with advanced disease.
In an attempt to understand the mechanisms of chemo-therapy resistance, several studies have used microarray technology to assess tumor gene expression at the time of diagnosis or at the time of subsequent recurrence [5-8]. A limitation of this approach is the difficulty of obtaining tumor tissue at the time of relapse, and the fact that such tissue may not be fully representative of the mechanisms that mediate drug response early in the patient course, at a time when first line chemotherapy is being adminis-tered.
In order to overcome these limitations, we wished to determine whether a dynamic assessment of gene expres-sion after carboplatin exposure in vitro might have clinical relevance and provide insights into the mechanisms of chemoresistance. For this purpose, we employed time-course and pathway analysis approaches in order to cap-ture changes in individual genes as well as gene pathways [9-12]. The significance of using this approach for path-way discovery in EOC is discussed.
Methods
Cell lineThe 36M2 human EOC cell line was developed in our lab-oratory as previously reported [13-15]. This cell line was derived from serial passage of ovarian serous carcinoma cells in nude mice and exhibits clinical and histologic characteristics similar to papillary serous EOC in humans. It was grown in RPMI 1640 media with L-glutamine, 10% fetal bovine serum and 1% of penicillin/streptomycin.
Cell death detection assay
Cell death was measured using the Cell Death Detection ELISA (Roche Diagnostics, GmBH, Mannheim Germany), according to manufacturer's instructions. Cell Death Detection ELISA is a photometric enzyme immunoassay that allows qualitative and quantitative in vitro determina-tion of cytoplasmic histone-associated fragments (mono-and oligonucleosomes). In brief, after cell lysis (mono-and cen-trifugation, the cytoplasmic fractions were prediluted 1:10 with incubation buffer that contained both biotin-conju-gated mouse monoclonal anti-histone antibodies and horseradish peroxidase-conjugated mouse monoclonal anti-DNA antibodies (sandwich ELISA principle). Quanti-fication of DNA fragments (a surrogate of in vitro
apopto-sis) was done by photometric determination of horseradish peroxidase using ABTS (2,2'-azino-di [3-ethylbenzthiazoline sulfonate]) [16].
Design of time-course microarray experiment
We treated the 36M2 cell line with varying concentrations (0.1 μM to 200 μM) of carboplatin for 24 hrs. Cells were then washed thoroughly with PBS and allowed to grow in fresh medium. Cell death was assessed for each carbopla-tin dosage at discarbopla-tinct time points using the previously described ELISA assay.
Doses of carboplatin up to 10 μM resulted in apoptotic cell death similar to control at all time points, while treat-ment with 200 μM was associated with significant apop-totic death at early time points (see Additional File 1). Treatment with 100 μM resulted in early apoptotic changes at 36 hours, followed by significant cell death at 48 hours (see Additional File 2).
Since our goal was to capture the transcriptional response to carboplatin up until early apoptotic changes became evident, we treated the 36M2 cell line with carboplatin 100 μM or vehicle-control for 24 hrs and cells were har-vested and processed for RNA isolation at 24, 30 and 36 hrs after treatment. We did not study time points beyond 36 hrs since significant apoptotic cell death could obscure the transcriptional response to carboplatin. All data for all time points were obtained in duplicates.
RNA Isolation and Affymetrix GeneChip Hybridization
Total RNA was isolated using the RNeasy Mini Kit (Qiagen Valencia, CA, USA) according to manufacturer's instruc-tions. cDNA synthesis and hybridization on oligonucle-otide microarrays (U133 Plus 2.0 Array GeneChip, Affymetrix, Inc., Santa Clara, CA) containing approxi-mately 54,700 transcripts were carried out using standard protocols. Microarray experiments were performed at the Beth Israel Deaconess Medical Center (BIDMC) Genom-ics Core [8,17,18] as previously described. Raw data were processed using Robust Multi-Array (RMA) analysis [19]. Signal intensities were normalized, background corrected, and bottom-trimmed at signal intensity of 50. Genes were filtered out if their log intensity variation percentile was less than 25% and/or if they were absent in more than 85% of the experiments. All raw microarray data are pro-vided in GEO, accession number: GSE13525.
Statistical Methods
a. Time series analysis
approach applies a regression model to estimate the effect of the interaction between time and class (in this case class reflects treated versus control cells) and identifies genes whose variation of expression over time was different between carboplatin and control treated cells. Statistical significance for this model was set at 0.01 at a false discov-ery rate of 0.15.
b. Pathway Analysis
Pathway analysis was performed using the gene set com-parison tool of BRB-ArrayTools Version 3.6 (Biometrics Research Branch, National Cancer Institute). We analyzed all predefined Biocarta pathways (obtained through the NCI public database) for differential expression between the carboplatin-treated and the vehicle-treated cells. Bio-carta' is a trademark of Biocarta Inc. (San Diego, CA).
The statistical significance for differential expression of each pathway was estimated using the functional class scoring method [20]. In brief, a p value was computed for each gene in each pathway and then the set of p-values for each pathway was summarized by the LS score (mean neg-ative natural logarithm of the p-values of the respective single gene univariate test) and the Kolmogorov-Smirnov (KS) score [20]. For each pathway, significance was assessed by testing the null hypothesis that the list of dif-ferentially expressed genes from each pathway was a ran-dom selection from the entire project gene list. N genes (equal to the number of genes of the pathway) were ran-domly selected from the project gene list, and the LS and KS statistics and their random distribution were com-puted (100,000 random selections). The LS (KS) permu-tation p-value was defined as the proportion of random simulations for which the LS (KS) statistic was larger than the LS (KS) statistic computed for the pathway with the original gene list. Statistical significance was set at 0.005.
c. Hierarchical Clustering
Publicly available gene expression data from the ovarian cancer cell line A2780 and the non-small cell lung cancer (NSCLC) cell line A549 were used for unsupervised hier-archical clustering with the average linkage method as implemented in the BRB Array Tools Version 3.6. All genes were median-centered across the experiments.
The gene signatures used for hierarchical clustering were mapped across different platforms (from U133 Plus 2.0 to U95Av2 platforms and from U133 Plus 2.0 to U133A platforms) using the Affymetrix 'best match' tool. Mapped time-course and pathway signatures were used without additional filtering for unsupervised hierarchical cluster-ing.
d. Survival Analysis
In order to evaluate whether the gene expression signa-tures associated with carboplatin exposure provided
clin-ically relevant information, we used two independent, clinically annotated, publicly available microarray data-sets previously published by our group and others (http:/ /www.bidmcgenomics.org/OvarianCancer and http:// data.cgt.duke.edu/oncogene.php/, respectively) [21,22]. In regard to our dataset, the study protocol for collection of tissue and clinical information was approved by the institutional review board at our institution and patients provided written informed consent authorizing the collec-tion and use of the tissue for study purposes.
We tested whether these signatures would predict disease free survival (DFS) and overall survival (OS) using the Survival Risk Prediction Algorithm as implemented in BRB-ArrayTools Version 3.6. We used the DFS and OS def-initions exactly as used in these previously published studies. Gene signatures were mapped from U133 Plus 2.0 to U95Av2 platforms and from U133 Plus 2.0 to U133A platforms using the Affymetrix 'best match' tool.
The methodological principles of the Survival Risk Predic-tion Algorithm have been previously described [23]. In brief, a high and a low-risk survival groups were defined based on a multivariate model of the expression level of the genes contained in each gene signature and the Cox regression coefficient for each gene (supervised principal component method). This multivariate model was used in a leave-one-out cross validation process to assign risk-group membership for clinical samples. Kaplan-Meier DFS and OS curves were plotted for two risk groups, with higher or lower than median risk of death or recurrence. Statistical significance of the survival splits was assessed by the log-rank test and a permutation statistic was calcu-lated by randomly reassigning the survival data among cases, repeating the entire survival risk prediction 100 times and estimating how many times the log-rank statis-tic is lower than the log-rank statisstatis-tic for the real data. This represented the permutation significance level for testing the null hypothesis that there is no relation between the expression data and survival.
Results
Time-course analysis of gene expression after carboplatin exposure
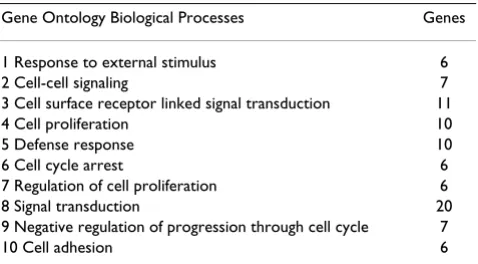
transduction," "cell proliferation," "cell-cycle regulation," and "cell adhesion." The 10 most upregulated genes after carboplatin exposure are shown in Table 2. In order to support the validation of these carboplatin related genes we investigated the expression of the 10 most upregulated genes identified in our analysis in another dataset that included gene expression data (Affymetrix U95Av2 plat-form) from A2780 ovarian cancer cells treated either with cisplatin or control [24]. Despite the different experiment design, and the different cell line, and after mapping probesets from U133 to U95, 7 genes (GDF15, GADD45A, ATF3, IL8, IL6, MAFF and TNFAIP3), were also upregulated in cisplatin treated cells versus control.
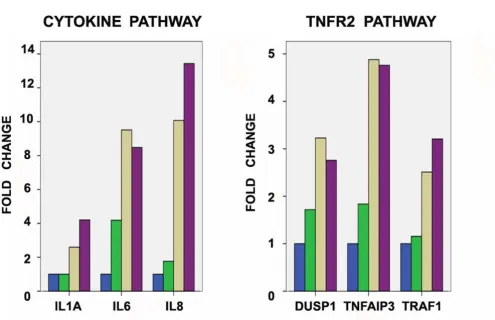
Several of these genes belong to previously described sig-naling pathways, namely the TNFR2 sigsig-naling pathway (TNFAIP3), the ATM signaling pathway (GADD45A), the NF-kB signaling pathway (TNFAIP3), the cytokine and inflammatory response pathway (IL6 and IL8) and the oxidative stress response via NRF2 pathway (MAFF). As an example of the expression changes induced by carboplatin exposure, Figure 1 illustrates the over time fold expression changes of selected genes of two of these pathways (TNFR2 and cytokine and inflammatory response path-ways). A complete list of all 317 genes (designated as "time-course signature") is included in Additional File 4.
Furthermore, we identified the deregulated genes between carboplatin and vehicle-treated cells for each time point (Figure 2). Specifically 24, 30 and 36 hours after carbopl-atin exposure 210, 800 and 1664 genes (see Additional File 5) were differentially expressed between carboplatin and vehicle-treated cells respectively (108 out of 210, 601 out of 800 and 1015 out of 1664 were upregulated in car-boplatin treated cells). Of note 88% of the genes (281 out of 317 genes) in the time course signature were among the genes deregulated between treatment and control.
Dynamic assessment of signaling pathways induced by carboplatin exposure
We hypothesized that individual genes that are differen-tially regulated after carboplatin exposure (Table 2) might
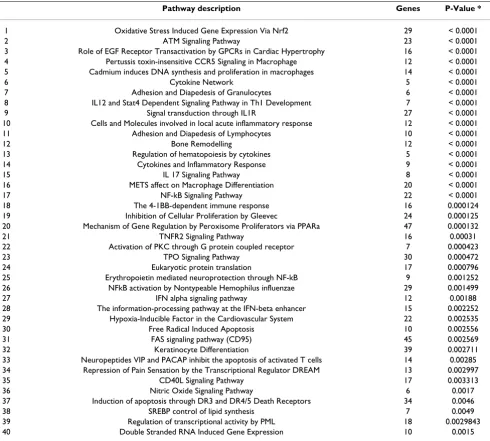
be surrogates for carboplatin-induced changes in their corresponding pathways. Conversely, we considered the possibility that pathways may also be differentially regu-lated following carboplatin exposure, which might not be captured by the behavior of individual genes. Accordingly, we performed pathway analysis as previously described [20] and identified a total of 40 pathways that were differ-entially expressed between carboplatin-treated and vehi-cle-treated cells at a significance level of p = 0.005. This 40 pathway list (Table 3) includes diverse signaling pathways associated with apoptosis, response to DNA damage, cytokine signaling, DNA repair, mitogenesis and antioxi-dant response. The 270 genes comprising all 40 signaling pathways (designated as 'pathway signature') are pro-vided in Additional File 6.
External validation of time course and pathway signatures
In order to demonstrate the reproducibility of the time-course and pathway signatures we utilized two previously published microarray datasets from different laboratories. The first dataset included gene expression data (Affyme-trix U95Av2 platform) from A2780 ovarian cancer cells [24] treated either with cisplatin or control. Despite the change in microarray platform, both time-course and pathway signatures successfully distinguished between cisplatin and vehicle-treated A2780 cells (see Additional File 7).
The second dataset included gene expression data (Affymetrix U133A platform) from the A549 NSCLC cell line that was treated for 24 hr with vehicle control, or car-boplatin [25]. Again, both signatures successfully sepa-rated the carboplatin- and vehicle-treated A549 samples (see Additional File 8) indicating that the time-course and pathway signatures are reproducible, even in a non-ovar-ian cancer cell line.
Clinical relevance of time course and pathway signatures
We have shown that exposure to carboplatin in vitro
induced a characteristic change in the expression of sev-eral genes and their corresponding pathways. In order to determine whether this observation has clinical relevance, we investigated whether the time course or pathway anal-ysis correlated with disease free survival (DFS) and overall survival (OS) using two separate, clinically annotated ovarian cancer microarray datasets. The first dataset (Dataset 1, run on Affymetrix U95Av2 arrays, previously published work by our group [8]) included 66 ovarian cancers and the second dataset (Dataset 2, run on Affyme-trix U133A arrays) included 133 ovarian cancers [21]. DFS and OS data were available for Dataset 1, while only OS data were available for Dataset 2.
We used the U95Av2-mapped subset of the time-course signature (obtained through the Affymetrix 'best match' algorithm) for survival risk prediction on Clinical Dataset Table 1: Selected biological processes represented in the
time-course signature.
Gene Ontology Biological Processes Genes
1 Response to external stimulus 6
2 Cell-cell signaling 7
3 Cell surface receptor linked signal transduction 11
4 Cell proliferation 10
5 Defense response 10
6 Cell cycle arrest 6
7 Regulation of cell proliferation 6
8 Signal transduction 20
9 Negative regulation of progression through cell cycle 7
Table 2: The 10 most upregulated genes after at 36 hours after carboplatin exposure compared to baseline.
GENE NAME GENE SYMBOL FOLD CHANGE
Activating transcription factor 3 ATF3 17.2
Interleukin 8 IL8 13.4
Interleukin 6 (interferon, beta 2) IL6 8.5
Growth differentiation factor 15 GDF15 7
Chromosome 1 open reading frame 79 C1orf79 6.3
Pentraxin-related gene, rapidly induced by IL-1 beta PTX3 6.3
v-maf musculoaponeurotic fibrosarcoma oncogene homolog F (avian) MAFF 6
Claudin 1 CLDN1 5.9
Growth arrest and DNA-damage-inducible, alpha GADD45A 5.7
Tumor necrosis factor, alpha-induced protein 3 TNFAIP3 4.9
Over time fold expression changes (compared to baseline-0 hours) of selected genes in the TNFR2 and cytokine pathways in carboplatin-treated 36 M2 cells
Figure 1
1. Despite the change in platform, survival risk prediction using the U95Av2-mapped subset of the time-course sig-nature distinguished between a high and a low-risk group for DFS (median 9 versus 18 months, log-rank p = 0.005, permutation p = 0.04, Figure 3A) and OS (median 41 months versus not yet reached, log rank p = 0.04, permu-tation p = 0.11, Figure 3B). Similarly, the U133A-mapped subset of the time-course signature discriminated between a low-risk and a high-risk group in Dataset 2 (median OS 33 versus 118 months, log-rank p = 0.001, permutation p = 0.02, see Additional File 9, panel A).
As with the time-course signature, survival risk prediction using the U95A2-mapped subset of the pathway signature distinguished between patients with unfavorable and favorable DFS in Dataset 1, (median DFS 11 versus 17 months, log-rank p = 0.01, permutation p = 0.08, Figure 3C), and OS (median OS 34 months versus not yet reached, log-rank p = 0.002, permutation p = 0.05, Figure 3D). Similarly, the U133A-mapped subset of the pathway signature distinguished between patients with unfavora-ble and favoraunfavora-ble OS in Dataset 2 (median OS 31 vs 112 months, log-rank p < 0.001, permutation p = 0.04, see Additional File 9, panel B).
Scatterplots showing differentially-expressed genes between carboplatin and vehicle-treated cells at 24, 30 and 36 hours
Figure 2
Importantly, both pathway and time-course signatures were independently associated with DFS and OS when tested in multivariate analysis that included known prog-nostic factors of ovarian cancer including age and debulk-ing status. Specifically, multivariate analysis showed that pathway signature was associated with DFS (adjusted Hazard Ratio: 2.04, 95% C.I. 1.1–3.78) and OS (adjusted Hazard Ratio: 2.2, 95% C.I. 1.05–4.57), while time-course signature was associated with DFS (adjusted Hazard Ratio: 2.52, 95% C.I. 1.36–4.67) and OS (adjusted Haz-ard Ratio: 1.96, 95% C.I. 0.92–4.2). There were no pub-licly available data regarding age and debulking status for Dataset 2.
NRF2, NF-kB, and cytokine network genes are upregulated at baseline in tumors from patients with unfavorable outcome
Given the observation that carboplatin induced changes in gene expression had prognostic significance when applied to baseline, pre-chemotherapy tumor samples, we sought to identify which gene networks were upregulated in patients with poor outcome compared to those with good outcome, hypothesizing that they might be relevant to the development of chemoresistance. We analyzed the baseline expression levels of the 10 most upregulated genes after carboplatin exposure shown in Table 1, and their 5 corresponding pathways (TNFR2, ATM, NF-kB, NRF2 and cytokine and inflammatory response path-Table 3: Pathways deregulated after carboplatin exposure.
Pathway description Genes P-Value *
1 Oxidative Stress Induced Gene Expression Via Nrf2 29 < 0.0001
2 ATM Signaling Pathway 23 < 0.0001
3 Role of EGF Receptor Transactivation by GPCRs in Cardiac Hypertrophy 16 < 0.0001
4 Pertussis toxin-insensitive CCR5 Signaling in Macrophage 12 < 0.0001
5 Cadmium induces DNA synthesis and proliferation in macrophages 14 < 0.0001
6 Cytokine Network 5 < 0.0001
7 Adhesion and Diapedesis of Granulocytes 6 < 0.0001
8 IL12 and Stat4 Dependent Signaling Pathway in Th1 Development 7 < 0.0001
9 Signal transduction through IL1R 27 < 0.0001
10 Cells and Molecules involved in local acute inflammatory response 12 < 0.0001
11 Adhesion and Diapedesis of Lymphocytes 10 < 0.0001
12 Bone Remodelling 12 < 0.0001
13 Regulation of hematopoiesis by cytokines 5 < 0.0001
14 Cytokines and Inflammatory Response 9 < 0.0001
15 IL 17 Signaling Pathway 8 < 0.0001
16 METS affect on Macrophage Differentiation 20 < 0.0001
17 NF-kB Signaling Pathway 22 < 0.0001
18 The 4-1BB-dependent immune response 16 0.000124
19 Inhibition of Cellular Proliferation by Gleevec 24 0.000125
20 Mechanism of Gene Regulation by Peroxisome Proliferators via PPARa 47 0.000132
21 TNFR2 Signaling Pathway 16 0.00031
22 Activation of PKC through G protein coupled receptor 7 0.000423
23 TPO Signaling Pathway 30 0.000472
24 Eukaryotic protein translation 17 0.000796
25 Erythropoietin mediated neuroprotection through NF-kB 9 0.001252
26 NFkB activation by Nontypeable Hemophilus influenzae 29 0.001499
27 IFN alpha signaling pathway 12 0.00188
28 The information-processing pathway at the IFN-beta enhancer 15 0.002252
29 Hypoxia-Inducible Factor in the Cardiovascular System 22 0.002535
30 Free Radical Induced Apoptosis 10 0.002556
31 FAS signaling pathway (CD95) 45 0.002569
32 Keratinocyte Differentiation 39 0.002711
33 Neuropeptides VIP and PACAP inhibit the apoptosis of activated T cells 14 0.00285
34 Repression of Pain Sensation by the Transcriptional Regulator DREAM 13 0.002997
35 CD40L Signaling Pathway 17 0.003313
36 Nitric Oxide Signaling Pathway 6 0.0017
37 Induction of apoptosis through DR3 and DR4/5 Death Receptors 34 0.0046
38 SREBP control of lipid synthesis 7 0.0049
39 Regulation of transcriptional activity by PML 18 0.0029843
40 Double Stranded RNA Induced Gene Expression 10 0.0015
ways), in tumors from patients with favorable and unfa-vorable DFS and OS as identified by the time course signature. Four of these genes (PTX3, GADD45A, 6, IL-8 and MAFF) were statistically significantly upregulated in patients with unfavorable DFS compared to those with favorable DFS. Furthermore, pathway analysis showed that 3 of the 5 pathways ("oxidative stress response via NRF2", "NF-kB signaling," and "cytokine and inflamma-tory response" pathways) were differentially expressed between unfavorable and favorable prognosis tumors (Table 4). Importantly, the same genes of these 3 path-ways that were upregulated in unfavorable outcome tumors (Table 4), had already been shown to be upregu-lated after carboplatin exposure (Table 1, Figure 1).
Finally, since these genes were upregulated at baseline in poor outcome tumors we analyzed whether they con-tained prognostic information. The combined expression levels of these genes were not associated with OS or DFS in either datasets. This strengthens the value of our approach to use dynamic gene expression as a mean to capture prognostic information.
Discussion
In this study, we used time-course and pathway analysis to obtain a dynamic assessment of gene expression after car-boplatin exposure in vitro. Time-course analysis formally assesses the statistical interaction between time (as a con-tinuous variable) and class (in this case carboplatin versus
Association between in vitro signatures and clinical outcome (Dataset 1)
Figure 3
vehicle-treated cells), while pathway analysis combines measurements across multiple gene members of each pathway to identify networks deregulated after carbopla-tin exposure that are typically missed in the single gene approach. Our analyses identified two gene expression signatures – designated time-course and pathway signa-tures, respectively – that are induced after carboplatin exposure (Tables 1 and 3). In order to assess the clinical relevance of these signatures, we investigated whether the expression of their genes in tumor specimens obtained at the time of surgery (prior to chemotherapy administra-tion) was associated with clinical outcome. Interestingly, despite the different microarray platforms used, baseline, pre-chemotherapy expression of time-course and pathway signature genes distinguished between a high- and low-risk group of patients with unfavorable and favorable OS and DFS respectively, in two previously published inde-pendent clinically annotated microarray datasets. Given the dynamic nature of these signatures, their prognostic value when assessed in a static, pre-chemotherapy tumor sample obtained at diagnosis was unanticipated.
In order to further investigate this observation, we com-pared the baseline, pre-chemotherapy expression of the 10 most upregulated genes (Table 2) and their corre-sponding pathways, between tumors from patients with favorable and unfavorable DFS. Interestingly, 4 of the 10 genes (MAFF, IL-6, IL-8 and PTX3) and 3 of 5 pathways (NRF2 oxidative stress response, NF-kB signaling and cytokine and inflammatory response pathways) were sta-tistically significantly upregulated in patients with unfa-vorable DFS or OS compared to those with faunfa-vorable DFS or OS. The finding that some of the genes and pathways that are upregulated after carboplatin exposure in vitro, are also upregulated at baseline in tumors from patients with unfavorable DFS, suggests that they may be involved in mediating chemoresistance.
While the role of the NF-kB signaling pathway in plati-num resistance has been extensively studied [26], emerg-ing data indicate that the NRF2 signalemerg-ing pathway may also be involved in this process (Table 4). Electrophilic xenobiotics, such as platinum analogs, induce dissocia-tion of the transcripdissocia-tion factor NRF2 from its cytoplasmic inhibitor Keap1 [27]. NRF2 then translocates to the nucleus, where it heterodimerizes with members of the small MAF family of proteins (including MAFF, among the 10 most upregulated genes in Table 2) to activate the transcription of antioxidant, xenobiotic detoxification and drug efflux pump genes that confer cytoprotection against drugs [28,29]. Members of the cytokine and inflammatory response pathway have also been associ-ated with chemotherapy resistance, albeit not yet with platinum resistance. Specifically, IL-6, (again among the most 10 upregulated genes in Table 2) is reportedly upreg-ulated after paclitaxel exposure in vitro and has been asso-ciated with paclitaxel resistance by inducing multidrug resistance gene-1 transcription with subsequent P-glyco-protein overexpression [30,31].
Importantly, we performed in silico validation of our in
vitro time-course and pathway signatures using published
microarray data from a different ovarian cancer cell line and a NSCLC cell line exposed to platinum in different laboratories. Despite the differences in microarray plat-forms in both cases, our signatures successfully distin-guished between carboplatin and vehicle-treated cells confirming their association with carboplatin exposure irrespective of cell line selection. Additionally, the obser-vation that both signatures discriminated between carbo-platin and vehicle-treated lung cancer cells suggests that the gene networks involved in the transcriptional response to carboplatin may be shared by cancer cells, regardless of tissue of origin.
Table 4: Selected genes of the NRF2, cytokine response and NF-kB signaling pathways upregulated in patients with unfavorable DFS and OS
PATHWAY PATHWAY P VALUE * GENE GENE P VALUE**
Oxidative stress response via Nrf2 < 0.0001 MAFF < 0.0001
NRF2 (NFE2L2) < 0.0001
CRYZ < 0.001
CREB1 0.015
Cytokine and Inflammatory Response < 0.0001 IL-6 0.005
IL-8 0.013
IL-15 0.0005
NF-kB signaling pathway 0.0002 NF-kB1 < 0.0001
IL1-R1 0.003
CHUK 0.002
RELA 0.005
Further mechanistic insights may also be derived from examining the full content of the time-course and path-way signatures. Several pathpath-ways mediating apoptosis, DNA damage response, cytokine signaling, DNA repair, and mitogenesis were involved in cellular transcriptional response to carboplatin. Some of these pathways are known to be deregulated after platinum exposure includ-ing the ATM, FAS and epidermal growth factor receptor (EGFR) pathways [32-34]. However, other pathways not previously linked to platinum exposure were also identi-fied by our pathway analysis, for example, the death receptor DR3, DR4/5 apoptotic pathway and the IL1R, IL-17, and tumor necrosis factor (TNFR2) pathways among others.
It is revealing that some of the 40 pathways identified by pathway analysis were not captured by time-course analy-sis. For instance, while none of the gene members of the PKC-GPCR (G-protein coupled receptor) pathway were included in the time course signature, pathway analysis indicated that this pathway is nonetheless involved in the cellular response to carboplatin, consistent with previous studies demonstrating its activation after platinum expo-sure and potential association with platinum resistance in vitro [35-37]. Conversely, not all genes identified by time course analysis were captured by pathway analysis, for example two genes among those with the highest fold change in the time-course signature, ATF3 (activating transcription factor 3) and claudin 1 (Table 2). These find-ings indicate that complementary insights into chemore-sponse might be gained by analyzing the results of microarray time course experiments not only from the perspective of individual genes, but by considering gene families as defined by pathway analysis. Further studies will be necessary to define the precise role of these genes and pathways in promoting chemoresistance or chemo-sensitivity, and to evaluate their potential as novel drug targets in patients with EOC.
Conclusion
In conclusion, this work demonstrates for the first time that systematic dynamic assessment of gene expression changes following carboplatin exposure in vitro, using formal time course and pathway statistical approaches, can identify genes and pathways associated with clinical outcome in ovarian cancer. Pathways highly induced in vitro, such as the NRF2, NF-kB, and cytokine and inflam-matory response pathway, were shown for the first time to be upregulated in poor prognosis tumors in a statistically robust manner. This study provides proof of principle that comprehensive transcriptional assessment following exposure to chemotherapeutic agents in vitro provides information that can be translated to the clinical setting, as well as potential useful mechanistic insights into chem-oresistance.
Competing interests
The authors declare that they have no competing interests.
Authors' contributions
All authors participated in the design, performance of the study and interpretation of the results. All authors read and approved the final manuscript.
Additional material
Additional file 1
Apoptotic curve of 36M2 cells with various carboplatin concentra-tions. This figure shows the apoptotic curve of 36M2 cells treated with varying concentrations of carboplatin (0.1 μM to 200 μM) for 24 hours. Click here for file
[http://www.biomedcentral.com/content/supplementary/1755-8794-1-59-S1.tiff]
Additional file 2
Early apoptotic changes at 36 hours with 100 μM of carboplatin. Treatment with 100 μM of carboplatin resulted in early apoptotic changes at 36 hours, followed by significant cell death at 48 hours.
Click here for file
[http://www.biomedcentral.com/content/supplementary/1755-8794-1-59-S2.tiff]
Additional file 3
Theoretical principles of time series analysis. The theoretical principles of time series analysis as described in BRB Array Tools software. Click here for file
[http://www.biomedcentral.com/content/supplementary/1755-8794-1-59-S3.doc]
Additional file 4
Time course signature. A complete list of all 317 genes designated as time-course signature.
Click here for file
[http://www.biomedcentral.com/content/supplementary/1755-8794-1-59-S4.xml]
Additional file 5
Up and dowregulated genes for each time point. List of all genes that are up- or downregulated between treatment and control for each time point.
Click here for file
[http://www.biomedcentral.com/content/supplementary/1755-8794-1-59-S5.xls]
Additional file 6
Pathway Signature. The full list of the 270 genes comprising all 40 sig-naling pathways designated as pathway signature.
Click here for file
Acknowledgements
The authors would like to acknowledge Dr Amy Commander and Marie Joseph for their assistance and Bob Choy for creation of the supplementary data webpage.
Grant Support:
Supported in part by the Amgen Hematology/Oncology Fellowship Award (Panagiotis Konstantinopoulos), the Ovarian Cancer SPORE (P50 CA105009, Career Development Award) (Dimitrios Spentzos), the R21 CA 107352 (Towia Libermann), LeAnn's Project, the Bernice Shopkin Weisman Fund, and the Ovarian Cancer Research Fund in memory of Amy Sachs Simon (Stephen Cannistra).
References
1. Jemal A, Siegel R, Ward E, Murray T, Xu J, Thun MJ: Cancer statis-tics, 2007. CA Cancer J Clin 2007, 57(1):43-66.
2. Cannistra SA: Cancer of the ovary. N Engl J Med 2004,
351(24):2519-2529.
3. Bookman MA, Greer BE, Ozols RF: Optimal therapy of advanced ovarian cancer: carboplatin and paclitaxel vs. cisplatin and paclitaxel (GOG 158) and an update on GOG0 182-ICON5.
Int J Gynecol Cancer 2003, 13(6):735-740.
4. Parmar MK, Ledermann JA, Colombo N, du Bois A, Delaloye JF, Kris-tensen GB, Wheeler S, Swart AM, Qian W, Torri V, et al.: Paclitaxel plus platinum-based chemotherapy versus conventional platinum-based chemotherapy in women with relapsed ovarian cancer: the ICON4/AGO-OVAR-2.2 trial. Lancet
2003, 361(9375):2099-2106.
5. Sakamoto M, Kondo A, Kawasaki K, Goto T, Sakamoto H, Miyake K, Koyamatsu Y, Akiya T, Iwabuchi H, Muroya T, et al.: Analysis of gene expression profiles associated with cisplatin resistance in human ovarian cancer cell lines and tissues using cDNA microarray. Hum Cell 2001, 14(4):305-315.
6. Roberts D, Schick J, Conway S, Biade S, Laub PB, Stevenson JP, Ham-ilton TC, O'Dwyer PJ, Johnson SW: Identification of genes asso-ciated with platinum drug sensitivity and resistance in human ovarian cancer cells. Br J Cancer 2005, 92(6):1149-1158. 7. Cheng TC, Manorek G, Samimi G, Lin X, Berry CC, Howell SB: Iden-tification of genes whose expression is associated with cispl-atin resistance in human ovarian carcinoma cells. Cancer Chemother Pharmacol 2006, 58(3):384-395.
8. Spentzos D, Levine DA, Kolia S, Otu H, Boyd J, Libermann TA, Can-nistra SA: Unique gene expression profile based on pathologic response in epithelial ovarian cancer. J Clin Oncol 2005,
23(31):7911-7918.
9. Slonim DK: From patterns to pathways: gene expression data analysis comes of age. Nat Genet 2002, 32(Suppl):502-508. 10. Curtis RK, Oresic M, Vidal-Puig A: Pathways to the analysis of
microarray data. Trends Biotechnol 2005, 23(8):429-435. 11. Subramanian A, Tamayo P, Mootha VK, Mukherjee S, Ebert BL,
Gil-lette MA, Paulovich A, Pomeroy SL, Golub TR, Lander ES, et al.: Gene set enrichment analysis: a knowledge-based approach for interpreting genome-wide expression profiles. Proc Natl Acad Sci USA 2005, 102(43):15545-15550.
12. Storey JD, Xiao W, Leek JT, Tompkins RG, Davis RW: Significance analysis of time course microarray experiments. Proc Natl Acad Sci USA 2005, 102(36):12837-12842.
13. Strobel T, Cannistra SA: Beta1-integrins partly mediate binding of ovarian cancer cells to peritoneal mesothelium in vitro.
Gynecol Oncol 1999, 73(3):362-367.
14. Strobel T, Swanson L, Cannistra SA: In vivo inhibition of CD44 limits intra-abdominal spread of a human ovarian cancer xenograft in nude mice: a novel role for CD44 in the process of peritoneal implantation. Cancer Res 1997, 57(7):1228-1232. 15. Tai YT, Strobel T, Kufe D, Cannistra SA: In vivo cytotoxicity of
ovarian cancer cells through tumor-selective expression of the BAX gene. Cancer Res 1999, 59(9):2121-2126.
16. Rieder J, Lirk P, Bodrogi F, Sawires M, Gruber G, Hoffmann G: Cisa-tracurium, but not mivacurium, induces apoptosis in human umbilical vein endothelial cells in vitro. Eur J Anaesthesiol 2005,
22(1):16-19.
17. Jones J, Otu H, Spentzos D, Kolia S, Inan M, Beecken WD, Fellbaum C, Gu X, Joseph M, Pantuck AJ, et al.: Gene signatures of progres-sion and metastasis in renal cell cancer. Clin Cancer Res 2005,
11(16):5730-5739.
18. Gu X, Zerbini LF, Otu HH, Bhasin M, Yang Q, Joseph MG, Grall F, Onatunde T, Correa RG, Libermann TA: Reduced PDEF expres-sion increases invaexpres-sion and expresexpres-sion of mesenchymal genes in prostate cancer cells. Cancer Res 2007,
67(9):4219-4226.
19. Irizarry RA, Hobbs B, Collin F, Beazer-Barclay YD, Antonellis KJ, Scherf U, Speed TP: Exploration, normalization, and summa-ries of high density oligonucleotide array probe level data.
Biostatistics 2003, 4(2):249-264.
20. Pavlidis P, Qin J, Arango V, Mann JJ, Sibille E: Using the gene ontol-ogy for microarray data mining: a comparison of methods and application to age effects in human prefrontal cortex.
Neurochem Res 2004, 29(6):1213-1222.
21. Bild AH, Yao G, Chang JT, Wang Q, Potti A, Chasse D, Joshi MB, Har-pole D, Lancaster JM, Berchuck A, et al.: Oncogenic pathway sig-natures in human cancers as a guide to targeted therapies.
Nature 2006, 439(7074):353-357.
22. Spentzos D, Levine DA, Ramoni MF, Joseph M, Gu X, Boyd J, Liber-mann TA, Cannistra SA: Gene expression signature with inde-pendent prognostic significance in epithelial ovarian cancer.
J Clin Oncol 2004, 22(23):4700-4710.
23. Bair E, Tibshirani R: Semi-supervised methods to predict patient survival from gene expression data. PLoS Biol 2004,
2(4):E108.
24. Varma R, Hector S, Greco WR, Clark K, Hawthorn L, Porter C, Pendyala L: Platinum drug effects on the expression of genes in the polyamine pathway: time-course and concentration-effect analysis based on Affymetrix gene expression profiling
Additional file 7
Unsupervised hierarchical clustering of A2780 ovarian cancer cells. Unsupervised hierarchical clustering using average linkage method of A2780 ovarian cancer cells exposed to cisplatin or control. Time course (A, left) and pathway signatures (B, right) successfully separate cisplatin and vehicle-treated A2780 cells.
Click here for file
[http://www.biomedcentral.com/content/supplementary/1755-8794-1-59-S7.tiff]
Additional file 8
Unsupervised hierarchical clustering of A549 NSCLC cells. Unsuper-vised hierarchical clustering using average linkage method of A549 NSCLC cells exposed to carboplatin or vehicle control. Time course (A, left) and pathway signatures (B, right) successfully separate carboplatin and vehicle-treated A549 cells.
Click here for file
[http://www.biomedcentral.com/content/supplementary/1755-8794-1-59-S8.tiff]
Additional file 9
Association of time course and pathway signatures with OS in Dataset 2. Association of time course and pathway signatures with OS in Dataset 2. A) Association between time course signature and OS [(median OS for the unfavorable and favorable groups was 33 and 118 months respectively (p = 0.001, log-rank test), hazard-ratio 2.2 (95% C.I. 1.4–3.6)]. B) Association between pathway signature and OS [(median OS for the unfavorable and favorable groups was 31 and 112 months respectively (p < 0.001, log-rank test), hazard-ratio 2.6 (95% C.I. 1.6–4.2)]. Click here for file
Publish with BioMed Central and every scientist can read your work free of charge
"BioMed Central will be the most significant development for disseminating the results of biomedical researc h in our lifetime."
Sir Paul Nurse, Cancer Research UK
Your research papers will be:
available free of charge to the entire biomedical community
peer reviewed and published immediately upon acceptance
cited in PubMed and archived on PubMed Central
yours — you keep the copyright
Submit your manuscript here:
http://www.biomedcentral.com/info/publishing_adv.asp
BioMedcentral
of A2780 ovarian carcinoma cells. Cancer Chemother Pharmacol
2007, 59(6):711-723.
25. Girnun GD, Naseri E, Vafai SB, Qu L, Szwaya JD, Bronson R, Alberta JA, Spiegelman BM: Synergy between PPARgamma ligands and platinum-based drugs in cancer. Cancer Cell 2007,
11(5):395-406.
26. Mabuchi S, Ohmichi M, Nishio Y, Hayasaka T, Kimura A, Ohta T, Saito M, Kawagoe J, Takahashi K, Yada-Hashimoto N, et al.: Inhibition of NFkappaB increases the efficacy of cisplatin in in vitro and in vivo ovarian cancer models. J Biol Chem 2004,
279(22):23477-23485.
27. Itoh K, Tong KI, Yamamoto M: Molecular mechanism activating Nrf2-Keap1 pathway in regulation of adaptive response to electrophiles. Free Radic Biol Med 2004, 36(10):1208-1213. 28. Itoh K, Chiba T, Takahashi S, Ishii T, Igarashi K, Katoh Y, Oyake T,
Hayashi N, Satoh K, Hatayama I, et al.: An Nrf2/small Maf het-erodimer mediates the induction of phase II detoxifying enzyme genes through antioxidant response elements. Bio-chem Biophys Res Commun 1997, 236(2):313-322.
29. Motohashi H, Yamamoto M: Carcinogenesis and transcriptional regulation through Maf recognition elements. Cancer Sci 2007,
98(2):135-139.
30. Rincon M, Broadwater G, Harris L, Crocker A, Weaver D, Dressler L, Berry D, Sutton L, Michaelson R, Messino M, et al.: Interleukin-6, multidrug resistance protein-1 expression and response to paclitaxel in women with metastatic breast cancer: results of cancer and leukemia group B trial 159806. Breast Cancer Res Treat 2006, 100(3):301-308.
31. Wang TH, Chan YH, Chen CW, Kung WH, Lee YS, Wang ST, Chang TC, Wang HS: Paclitaxel (Taxol) upregulates expression of functional interleukin-6 in human ovarian cancer cells through multiple signaling pathways. Oncogene 2006,
25(35):4857-4866.
32. Fedier A, Schlamminger M, Schwarz VA, Haller U, Howell SB, Fink D:
Loss of atm sensitises p53-deficient cells to topoisomerase poisons and antimetabolites. Ann Oncol 2003, 14(6):938-945. 33. Kinoshita H, Yoshikawa H, Shiiki K, Hamada Y, Nakajima Y, Tasaka K:
Cisplatin (CDDP) sensitizes human osteosarcoma cell to Fas/CD95-mediated apoptosis by down-regulating FLIP-L expression. Int J Cancer 2000, 88(6):986-991.
34. Ling YH, Donato NJ, Perez-Soler R: Sensitivity to topoisomerase I inhibitors and cisplatin is associated with epidermal growth factor receptor expression in human cervical squamous car-cinoma ME180 sublines. Cancer Chemother Pharmacol 2001,
47(6):473-480.
35. Basu A, Weixel K, Saijo N: Characterization of the protein kinase C signal transduction pathway in cisplatin-sensitive and -resistant human small cell lung carcinoma cells. Cell Growth Differ 1996, 7(11):1507-1512.
36. Mohanty S, Huang J, Basu A: Enhancement of cisplatin sensitivity of cisplatin-resistant human cervical carcinoma cells by bry-ostatin 1. Clin Cancer Res 2005, 11(18):6730-6737.
37. Tortora G, Ciardiello F: Antisense strategies targeting protein kinase C: preclinical and clinical development. Semin Oncol
2003, 30(4 Suppl 10):26-31.
Pre-publication history
The pre-publication history for this paper can be accessed here: