Iranian Chemical Society
Anal. Bioanal. Chem. Res., Vol. 3, No. 1, 41-51, June 2016.
Determination of Phenol and Carvacrol in Honey Samples Using Dispersive
Liquid-Liquid Microextraction and Experimental Design for Optimization
A. Daneshfar*, R. Tabaraki, R. Khodakarami and T. Khezeli
Department of Chemistry, Faculty of Science, Ilam University, Ilam, Iran
(Received 31 August 2015, Accepted 3 January 2016)
A very simple, rapid and sensitive dispersive liquid-liquid microextraction (DLLME) followed by gas chromatography and flame ionization detection (GC-FID) was developed for the determination of phenol and carvacrol in honey samples. A mixture of 100 µl dichloromethane (extraction solvent) and 0.5 ml acetonitrile (disperser solvent) was rapidly injected into sample solution. Thereby a cloudy solution was formed. After centrifuging, the fine droplets of extraction solvent were sedimented in the bottom of the conical test tube. Sedimented phase (0.6 µl) was injected into the GC-FID system. Experimental parameters which control the performance of DLLME, such as type and volumes of extraction and disperser solvents, pH, salt effect and extraction time were investigated. Under optimum conditions obtained by the response surface methodology, the method was found to be linear in the range of 10-200 mg l-1. The limits of detection for
phenol and carvacrol were 4.15 and 3.9, respectively, and the extraction recovery ranged from 67-97.3%.
Keywords: Phenol, Carvacrol, Dispersive liquid-liquid microextraction, GC-FID
INTRODUCTION
Phenolic compounds are a group of substances that are important in food hygiene due to their bactericidal effects. It is generally accepted that a natural product is healthier than that of synthetic origin. However, this question is still open for discussions, and many studies have been carried on this subject [1,2]. Nevertheless, some natural products have been used in folk medicine since ancient times, and it is important to ascertain the origin of biological activity to apply products for human wellbeing.
Honey was selected for the analysis because it has been produced in many countries since olden times. It is the most popular and easiest available bee product highly appreciated by people. Honey consists of carbohydrates, amino acids, proteins, organic acids, vitamins, minerals and various phytochemicals [3]. It is rich in phenolic acids and flavonoids, which exhibit a wide range of biological effects and act as natural antioxidants [4], Honey was found to exhibit radical scavenging capacity [5], anticancer and
*Corresponding author. E-mail: [email protected]
wound healing properties [6], The composition of honey phenolic compounds depends on the floral source used to collect nectar, seasonal and environmental factors, geographic origin, storage conditions [7,8]. The variation of the botanical composition of honey is very wide; some honeys have a stronger biological activity than others [9].
detection [14]. These compounds have been also determined using gas chromatographs equipped with flame ionization [15,16] and mass spectrometric detection [17].
In this research factorial design was chosen to determine the most significant factors (volume of disperser and extraction solvent and pH). The chemometric approach relies on a rational experimental design, which allows the simultaneous variation of all experimental factors, saving time and material, with minimum number of test runs. With factorial design it is possible to determine the main effect as well the interactive effects of the selected factor.
The analysis of the response surfaces can be done in several ways. The most immediate way of concluding the optimum conditions is the graphical inspection of the surfaces, since the 3D pictures give the complete overview of the systems. The aim of the present work was optimizing a DLLME method followed by GC-FID for the extraction and determination of phenol and carvacrol in honey samples. Response surface methodology (RSM) is a collection of statistical and mathematical techniques successfully used for developing, improving and optimizing processes. The main advantage of RSM is the reduced number of experimental trials needed to evaluate multiple parameters and their interactions. Therefore, it is less laborious and time-consuming than other approaches required to optimize a process. Unlike the conventional empirical method, RSM can generate a mathematical model, and take into account the possible inter relationship among the test variables while minimizing the number of experiments [18].
EXPRIMENTAL
Reagents and Standards
Phenol, carvacrol (2-isopropyl-2methylphenol), methanol (HPLC grade), Ethanol (HPLC grade), acetone (HPLC grade), acetonitrile (ACN) (HPLC grade), sodium chloride were supplied by Merck (Darmstadt, Germany).
Instrumentation
The analysis was performed with a gas chromatograph (GC-17 Shimadzu, Japan) equipped with a flame-ionization detector (GC-FID) and a BP5 capillary column (25 m × 0.32 mm I.D., film thickness 0.5 µm). Helium (99.999%) was
used as the carrier gas. The inlet was operated in split mode with a split ratio of 20:1. The oven temperature was programmed as follows: initial 90 C (held for 1.0 min) ramped at 15 C min-1 to 180 C (held for 6.0 min) and then was raised to 270 C at 80 C min-1 (held for 5 min). The temperatures of injector and detector were set at 280 C and 300 C, respectively.
GC-MS analyses were performed using an Agilent gas chromatograph 7890A (Agilent, Little Falls, DE, USA) coupled with an electronically controlled split/split less injection port and interfaced to a MSD-5975C mass selective detector. The gas chromatograph was equipped with a DB-5MS fused silica capillary column (30 m × 0.25 mm I.D., 0.25 μm film thickness) purchased from J & W Scientific (Folsom, CA, USA). Helium (99.9999%) was used as carrier gas, with a flow rate of 1 ml min-1. The oven temperature was programmed as follows: initial temperature 40 C (held for 1 min), ramped at 50 C min-1 to 250 C (held for 10 min). The injection was performed at 280 C in the split mode (ratio 20:1). The transfer line and ion source were set at 280, 250 and 200 C, respectively. The mass spectra were taken in total-ion-scanning (TIC) mode and the electron impact energy was set at 70 eV. Mass range was from m/z 50-600 amu. The identification of analytes was performed by matching its retention time against that of the standards and GC-MS.
The pH measurements were made with a 780 pH meter (Metrohm, Switzerland) equipped with a combined Ag/AgCl glass electrode. The centurion scientific centrifuge
(model K280R, UK) was used for centrifuging.
DLLME Procedure
Preparation of Standard Solutions and Samples
Stock standard solution of two analytes (100 mg l-1) was prepared in CH2Cl2. Working solutions were prepared by
appropriate dilution of the stock standard solution. All solutions were stored in the dark. 30 g of honey were diluted with 200 ml of double distilled water in a beaker. The solution was homogenized over 30 min using a magnetic stirring bar, then filtered and subjected to the above mentioned DLLME-GC-FID.
Experimental Design and Statistical Analysis
Response surface methodology was applied to determine the optimized extraction conditions for phenol and carvacrol from honey samples. Statistical analysis was performed using the Minitab 16 (Minitab Inc., State College, PA, USA) software and fitted to a second-order polynomial regression model containing the coefficient of linear, quadratic and interaction terms. Central composite design (CCD) was used to investigate the effects of three independent variables (pH, volume of extraction solvent (µl) and volume of disperser solvent (ml)) at three levels on phenol and carvacrol response. Each variable was coded at three levels, -1, 0 and +1. The quadratic model for each response was as follows:
j k
j ij i k
i k
i i i
i k
i iX X X X
Y
1 2 1
1
0 (1)
where β0, βi, βii, βij are regression coefficients for intercept,
linear, quadratic and interaction terms, respectively. Xi and
Xj are coded value of the independent variables while k
equals to the number of the tested factors (k = 3).
An analysis of variance (ANOVA) with 95% confidence level was then carried out for each response variable to test the model significance and suitability. The significances of all terms in the polynomial were statistically analyzed by computing the F-value at probabilities (p) of 0.001, 0.01 and 0.05. The absence of any lack of fit (p > 0.05) also strengthened the reliability of all models. The models were used for the construction of three dimensional response surface plots to predict the relationship between independent and dependent variables.
RESULTS AND DISCUSSION
In this research, DLLME combined with GC-FID was developed for determination of phenol and carvacrol in honey samples. The effect of different parameters such as kind of extraction and disperser solvents and volume of them, extraction time, pH and salt addition were examined and optimal conditions were selected. In this research factorial design was chosen to determine the most significant factors (volume of disperser and extraction solvent and pH). Chromatographic peak area of analytes was used to assess the extraction efficiency under experimental conditions tested.
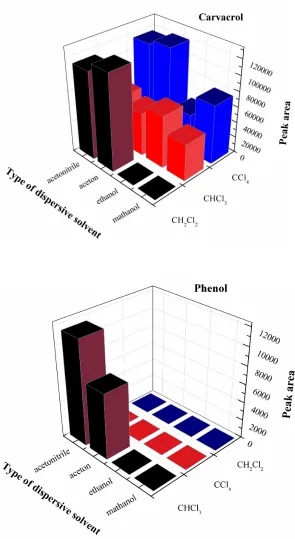
Selection of Extraction Solvent
Selection of an appropriate solvent is a major parameter for a DLLME process. Organic solvent is selected based on higher density rather than water, extraction capability of interested compounds and good gas chromatography behavior. Dichloromethane, chloroform and tetrachloride carbon were selected as extraction phase and compared for extraction of phenol and carvacrol from aqueous solution containing 2 mg l-1 of two analytes. According to Fig. 1, dichloromethane provides the higher extraction efficiencies for both phenol and carvacrol. Thus the dichloromethane was selected as extraction solvent.
Selection of Disperser Solvent
Miscibility of disperser solvent in organic phase (extraction solvent) and aqueous phase (sample solution) is the most important point for selection of disperser solvent. Thereby acetonitrile, acetone, methanol and ethanol which have this ability, were selected for this purpose. A series of sample solutions were studied by using 1 ml of each disperser solvent containing 150 µl dichloromethane. According to Fig. 1 the acetonitrile provides the better extraction efficiency. Thus acetonitrile was selected as a disperser solvent.
Effect of Extraction Time
constant experimental condition. Figure 2 shows the peak area of analytes versus extraction time. According to Fig. 2, the variations of peak area versus extraction time were not remarkable. Indicating that time has no impact on extraction efficiency. It is revealed that after formation of cloudy solution, the surface area between extraction solvent and aqueous phase (sample) becomes infinitely large. Thereby transition of analytes from aqueous phase to extraction solvent is fast. Subsequently equilibrium state is achieved quickly, so that the extraction time is very short. Low extraction time is an advantage of DLLME technique.
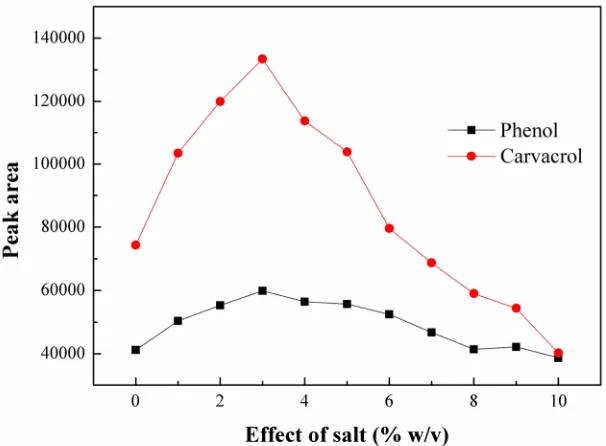
Effect of Salt Addition
The effect of increasing the ionic strength of the aqueous solutions was evaluated by adding NaCl (0-%10, w/v) into the aqueous solution containing 2 mg l-1 of phenol and carvacrol. Plots of average peak area as a function of the percentage of NaCl are shown in Fig. 3. According to this figure, analytical signals of the analytes, are increased with addition of NaCl up to 3% (w/v) and then decreased with further increasing NaCl concentration. At the beginning of extraction, salting out effect played a predominant role, resulting in a decrease of dissolubility of analytes in aqueous phase and therefore an improvement of extraction. With increasing the NaCl concentration, another effect caused by the presence of salt changed the physical properties of the solution. Hence, salt concentration of 3/100 was chosen for further experiments [19].
Selection of Extraction and Disperser Solvent Volume and pH by Factorial Design
A three-level factorial design requires more experimental runs to evaluate all possible combinations of the three levels of each considered. The following factors were evaluated: extraction and disperser solvent volume and pH. Table 1 lists the factors, corresponding symbols and levels and Table 2 shows the experimental design matrix and the results derived from each run. According to Fig. 4, optimum condition for extraction solvent, disperser solvent and pH were respectively: 100 μl, 0.5 ml, 3.
Modeling of the Extraction Process
The responses (total phenolic content, antioxidant activities and yield) of each run of the experimental design
are presented in Table 2. Regression analysis was performed on the experimental data and the coefficients of model were evaluated for the model significance.
Equations (2-3) show the relationship between X1 (pH),
X2 (volume of extraction solvent (µl) and X3 (volume of
disperser solvent (ml) on the peak area of phenol (Y1) and
carvacrol (Y2), respectively:
Y1 = 118530 - 23094 X1* - 21 X2 - 9405 X3 + 1813 X12*
- X22* - 9504 X32 + 14 X1 X2* + 1710 X1X3 +
105 X2X3*
SE = 3361; R2 = 0.915 (2)
Y2 = 345914 + 42019 X1 - 2082 X2* - 319522 X3*
- 3584 X12 + 3 X22* + 58110 X32 - 26X1 X2 +
1115 X1X3 + 656 X2X3*
SE = 13320; R2 = 0.971 (3)
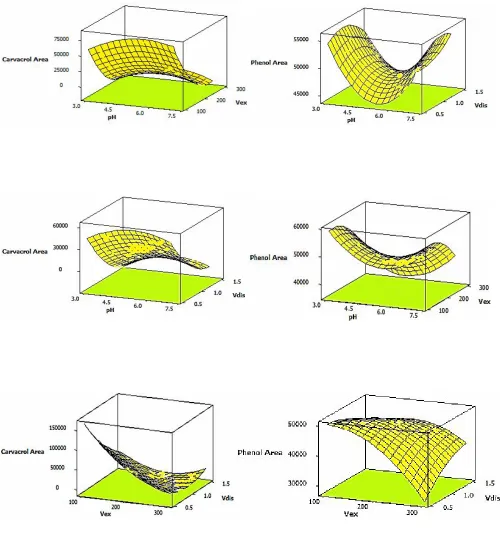
An analysis of variance (ANOVA) with 95% confidence level was then carried out for each response variable to test the model significance and suitability. As shown, the linear, quadratic and interaction terms have significant effects (star means significant variables at p ≤ 0.05). The large values of R2 indicated that the models adequately represent the experimental results. The models were used for the construction of three dimensional response surface plots to predict the relationship between independent and dependent variables (Fig. 4).
Analysis of the experimental results showed that pH has the greatest effect on phenol area. The linear term (pH), quadratic term (Vex2) and interaction terms (pH × Vex and
Vex × Vdis) were important. The effect of pH and volume of
extraction solvent or volume of disperser solvent on phenol area appeared as a saddled shape (Fig. 4).
Carvacrol area was highly affected by volumes of extraction solvent and disperser solvent. The linear terms (Vex and Vdis), quadratic term (Vex2) and interaction term
(Vex × Vdis) were important. Quadratic term (Vex2) and
interaction term (Vex × Vdis) were appeared in two RSM
models and showed that interaction is significant between Vex and Vdis. These types of interaction cannot detect in
on-at-a-time optimization approach. As shown in Fig. 4, peak area of phenol and carvacrol were maximum when both Vex
Fig. 2. Effect of time on the extraction efficiency of phenol and carvacrol. Experimental conditions: disperser solvent: (acetonitrile, 1 ml), extraction solvent: (dichloromethane, 100 μl).
The multiple response optimization was also performed. The multi-response optimization for extraction was carried out by desirability function approach. The maximization of these two responses is of practical importance since they might conflict with each other. Therefore, it is necessary to find out the optimal point as a compromise for the maximal phenol and carvacrol extraction. The individual desirability (di) for Y1 and Y2 were calculated by one side
transformation and then used to calculate overall desirability (D) of the optimization. The scale in the range of 0.0
(undesirable) to 1.0 (very desirable) is used to obtain a global function (D) that should be maximized according to efficient selection and optimization of designed variables. The overall desirability of optimization was found to be D = 0.94. At this D value, optimum values of the selected variables were as follows: pH 3, volume of extraction solvent 100µl and volume of disperser solvent 0.5 ml which responded for Y1 = 63079 and Y2 = 141670, respectively. At
optimal conditions, experimental area were Y1 = 65332 and
Y2 = 135978, respectively.
Table 1. Factors and Their lLevels in Factorial Design
1 0 -1 Factors 7.0 5.0 3.0 X1) pH
( 300 200 100 (X2) Volume of extraction solvent (µl)
1.5 1.0 0.5 (X3) Volume of disperser solvent (ml)
Table 2. Design Matrix and Responses for Factorial Design
Calibration Curves
Calibration graphs were performed using the external standard technique. The limits of detection, linear ranges and regression coefficient obtained from the calibration graphs are shown in Table 3.
Real Sample Analysis and Recovery
The extraction of phenol and carvacrol from honey is very easy because of its dissolution in water. Recovery of
two compounds was determined by adding the standards at three different concentrations to honey samples prior to applying the extraction procedure. The analytes were extracted from four kinds of honey samples in optimized condition with DLLME method. Figure 5 shows the GC-FID chromatogram of analytes and Fig. 6 GC-MS shows chromatogram of analytes in honey sample. Results of the relative recovery of honey samples using the optimized DLLME method are given in Table 4.
Table 3. Linear Range (L.R.), Coefficient of Determination (R2) and Limit of Detection (LOD) for Phenol and Carvacrol
L.R. ( mg l-1) LOD
(mg l-1) R2
Analyte
10-200 4.146
0.9978 Phenol
10-200 3.8499
0.9989 Carvacrol
Fig. 6. GC-MS chromatogram of honey sample obtained by DLLME under optimized conditions.
Table 4. Recovery Results of Phenol and Carvacrol
Added (mg l-1)
100 50
15
Recovery (%) Found
(mg l-1) Analyte
Sample honey
97 92
93 0.575
Phenol Evergreenoak (Querous Brantiikink)
83 89
96 7.121
Carvacrol
89 78
91 1.587
Phenol Milkvetch (Astragalus adscendens Boiss)
89 96
93 3.148
Carvacrol
86 94
83 4.083
Phenol Algerian cedar (Cedrus Atlantica)
81 89
97 4.99
Carvacrol
85 71
80 6.123
Phenol Black cumin (Nigella sativa-sibth)
67 82
88 2.738
CONCLUSIONS
In this study, DLLME combined with GC-FID has been used for determination of phenol and carvacrol in honey samples. DLLME provides the good repeatability, high recovery and a much short time. The comparison of this method with other extraction methods demonstrated that DLLME is very fast, simple, accurate and inexpensive.
REFERENCES
[1] A.G. Lea, P. Bridle, C. Timberlake, V.L. Singleton, Am. J. Enol. Viticult. 30 (1979) 289.
[2] G.J. Topliss, A.M. Clarc, E. Ernest, D.C. Hofford, A.R.D. Johnson, M. J. Rimoldi, J.B. Weimann, Pure Appl. Chem. 74 (2002) 1957.
[3] L.P. Odoo, R. Piro, Apidologie 35 (2004) 38.
[4] N. Gheldof, H.X. Wang, J.N. Engeseth, J. Agri. Food Chem. 50 (2002) 5870.
[5] V. Baltrusaityte, R.P. Venskutonis, V. Cykstryte, Food Chem. 101 (2007) 502.
[6] V.A. Tsiapara, M. Jaakkpla, I. Chinou, Food Chem. 116 (2009) 702.
[7] E. Anklam, Food Chem. 63 (1998) 549.
[8] R.S. Joshi, H. Pechhacker, W. William, W.O. Vonder, Apidologie 31 (2000) 367.
[9] P.C. Molan, Bee Word 73 (1992) 59.
[10] R. Socha, L. Juszczak, S. Pietrzyk, T. Fortuna, Food Chem. 113 (2009) 568.
[11] A.W. Javorski, C.Y. Lee, J. Agri. Food Chem. 35 (1987) 257.
[12] S. Abu-Lafi, I. Odeh, H. Dewik, M. Qabajah, L.O. Hanus, V.M. Dembitsky, Bioresour. Technol. 99 (2007) 3914.
[13] A. Bazylko, H. Strzelecka, Chromatographia 52 (2000) 112.
[14] P. Vinas, M.J. Soler-Romera, M. Hernandez-Cordoba, Talanta 69 (2006) 1063.
[15] M.J. Nozal, J.L. Bernal, J.J. Jimenez, M.J. Gonzalez, M. Higes, J. Chromatogr. A 954 (2002) 207.
[16] C. Kohlert, G. Abel, E. Schmid, M. Veit, J. Chromatogr. B 767 (2002) 11.
[17] M. Lodesani, A. Pellacani, S. Bergomi, E. Carpana, T. Rabitti, P. Lasagni, Apidologie 23 (1992) 25.
[18] C. Liyana-Pathirana, F. Shahidi, Food Chem. 93 (2005) 47.