www.hydrol-earth-syst-sci.net/16/4435/2012/ doi:10.5194/hess-16-4435-2012
© Author(s) 2012. CC Attribution 3.0 License.
Earth System
Sciences
Exploring the physical controls of regional patterns of flow duration
curves – Part 1: Insights from statistical analyses
L. Cheng1,2, M. Yaeger2, A. Viglione3, E. Coopersmith2, S. Ye4, and M. Sivapalan2,4 1Water for a Healthy Country Flagship, CSIRO Land and Water, Canberra, ACT, Australia
2Department of Civil and Environmental Engineering, University of Illinois at Urbana-Champaign, Urbana, IL, USA 3Institute of Hydrology and Water Resources Management, Vienna University of Technology, Vienna
4Department of Geography, University of Illinois at Urbana-Champaign, Urbana, IL, USA
Correspondence to: L. Cheng ([email protected])
Received: 10 May 2012 – Published in Hydrol. Earth Syst. Sci. Discuss.: 6 June 2012 Revised: 13 September 2012 – Accepted: 11 October 2012 – Published: 26 November 2012
Abstract. The flow duration curve (FDC) is a classical method used to graphically represent the relationship be-tween the frequency and magnitude of streamflow. In this sense it represents a compact signature of temporal runoff variability that can also be used to diagnose catchment rainfall-runoff responses, including similarity and differ-ences between catchments. This paper is aimed at extract-ing regional patterns of the FDCs from observed daily flow data and elucidating the physical controls underlying these patterns, as a way to aid towards their regionalization and predictions in ungauged basins. The FDCs of total runoff (TFDC) using multi-decadal streamflow records for 197 catchments across the continental United States are sepa-rated into the FDCs of two runoff components, i.e., fast flow (FFDC) and slow flow (SFDC). In order to compactly dis-play these regional patterns, the 3-parameter mixed gamma distribution is employed to characterize the shapes of the nor-malized FDCs (i.e., TFDC, FFDC and SFDC) over the entire data record. This is repeated to also characterize the between-year variability of “annual” FDCs for 8 representative catch-ments chosen across a climate gradient. Results show that the mixed gamma distribution can adequately capture the shapes of the FDCs and their variation between catchments and also between years. Comparison between the between-catchment and between-year variability of the FDCs revealed significant space-time symmetry. Possible relationships between the pa-rameters of the fitted mixed gamma distribution and catch-ment climatic and physiographic characteristics are explored in order to decipher and point to the underlying physical controls. The baseflow index (a surrogate for the collective
impact of geology, soils, topography and vegetation, as well as climate) is found to be the dominant control on the shapes of the normalized TFDC and SFDC, whereas the product of maximum daily precipitation and the fraction of non-rainy days was found to control the shape of the FFDC. These re-lationships, arising from the separation of total runoff into its two components, provide a potential physical basis for regionalization of FDCs, as well as providing a conceptual framework for developing deeper process-based understand-ing of the FDCs.
1 Introduction
expended towards detailed studies of FDCs, especially in the context of predictions in ungauged basins (Sivapalan et al., 2003a; Booker and Snelder, 2012). However, most re-cent studies on the FDCs have been empirically based, which generally fall into two categories: graphical (i.e., nonpara-metric) and statistical (i.e., paranonpara-metric). The graphical ap-proach focuses on exploring the controls of catchment cli-matic and physiographic characteristics on the shape of the FDC (Mimikou and Kaemaki, 1985; Smakhtin et al., 1997; Mohamoud, 2008), while the statistical approach employs statistical distributions to fit the FDC and then relates the pa-rameters of the distribution to the catchment’s physical char-acteristics (LeBoutillier and Waylen, 1993; Castellarin et al., 2004a; Li et al., 2010).
The graphical (nonparametric) methods have shown that several catchment climatic and physiographic features im-pact the shape of the FDC. Singh (1971) pointed out that physiographical factors, including catchment size, affect the shape of different FDCs in Illinois, USA. Ward and Robin-son (1990) highlighted the role of soil types and geology on the shapes of the FDCs in the UK. Castellarin et al. (2004b) reviewed the regionalization approaches proposed in the lit-erature and compared their performance in the context of predictions in ungauged basins for a large region in cen-tral Italy. Mohamoud (2008) developed a multiple regres-sion model for various percentiles of the FDCs against more than 40 climatic and landscape descriptors in the northeast-ern US. Zheng et al. (2007) showed that land use and land cover changes could cause changes in the streamflow regime and in the FDCs in the Yellow River Basin in China. Lane et al. (2005) demonstrated the role of vegetation changes in altering the shape of FDCs in Australia. Later, Zhao et al. (2012) carefully evaluated the effects of vegetation change on the shapes of the FDCs using data from paired experimen-tal catchments in Australia.
In the realm of statistical (parametric) methods, several probability distributions have been employed to capture the shape of the FDCs. The focus of the statistical studies has been finding the best fit to empirically derived estimates of the FDCs for the purpose of regionalization. The prob-ability distributions used include the log-normal distribu-tion (LeBoutillier and Waylen, 1993; Vogel and Fennessey, 1994; Li et al., 2010); gamma distribution (LeBoutillier and Waylen, 1993; Muneepeerakul et al., 2010); beta distribution (Iacobellis, 2008); and the 2-parameter logistic distribution (Castellarin et al., 2004a, 2007).
Although both graphical and statistical approaches demonstrated that different climatic and landscape charac-teristics impact the shape of the FDCs in different regions of the world (Castellarin et al., 2004b, 2007; Ganora et al., 2009; Li et al., 2010), it has been difficult to generalize the results from these rather diverse place-based studies because of the inadequacy of conceptual or process understanding of the FDCs to help synthesize these outcomes (Botter et al., 2009; Yokoo and Sivapalan, 2011). Recently, a number of
so Yokoo and Sivapalan (2011) proposed a new conceptual framework for reconstruction of FDCs in ungauged basins, both through building bridges between the fast and slow flow parts of total streamflow as precipitation variability cascades through the catchment system, and through recourse to un-derstanding the respective process controls.
Although Yokoo and Sivapalan (2011) carried out prelimi-nary analyses on a few selected catchments within the United States to demonstrate the feasibility of their approach, their results need further validation and advancement. This is the motivation behind this study. Therefore, the goal of the study is to explore, by following a top-down approach (Sivapalan et al., 2003b), the physical controls on the shape of the FDCs by taking advantage of empirical (both statistical and graph-ical) studies. The approach presented here has many simi-larities to the functional approach (L’Vovich, 1979) that was adopted by Sivapalan et al. (2011) and Harman et al. (2011) to analyze inter-annual variability of annual runoff. We fit simple probability distribution functions to the various dura-tion curves, i.e., PDC, TFDC, FFDC, and SFDC, and use the fitted parameters of these distributions to quantify the vari-ability of the FDCs between catchments and between years, and to express their relationship to catchment climatic and physiographical parameters. In this way, the work presented in this paper represents a major step in efforts undertaken to understand the physical controls of the FDCs: (1) it provides empirical validation of the findings of the work by Yokoo and Sivapalan (2011) in actual catchments; (2) it generates regional patterns of the spatial variations of the FDCs across the United States and temporal (inter-annual) variations of annual FDCs in several selected catchments; (3) it helps to identify climatic and landscape controls on both fast flow and slow flow duration curves. These patterns and relationships can help advance the research on developing more process-based understanding of the physical basis of the FDCs for use in regionalization studies. This is the first paper in a 4-part se-ries that explores the controls of regional patterns of FDCs. The next paper by Ye et al. (2012) explores the process con-trols of the seasonal variability of streamflows (i.e., regime curve), and the connection between the regime curve and the FDCs, while the paper by Coopersmith et al. (2012) presents a classification system for a catchment’s seasonal runoff be-havior (i.e., regime curve). Finally, the paper by Yaeger et al. (2012) represents a synthesis of these studies, providing deeper insights into the physical controls of the regional pat-terns of the FDCs but with a process perspective.
This paper is organized as follows: Sect. 2 contains de-scriptions of data sources for the analyses presented and the methodology adopted. Section 3 presents the results of the statistical analyses, including fitting of the empirical FDCs to statistical distributions, and the estimation of parameters. Section 4 presents the regional patterns of the FDCs, i.e., re-gional patterns of the parameters of the mixed gamma distri-bution fitted to the empirical FDCs. Section 5 discusses the similarities among different duration curves and the spatial
(between catchments) and temporal (between years) relation-ship between the shape parameters and climate and catch-ment characteristics. Finally, Sect. 6 presents the conclu-sions drawn from the analyses, with respect to what has been learned regarding the physical controls of the FDCs, and out-lines the future research needed to generate a more process-based understanding of these controls.
2 Data and methodology
2.1 Datasets used
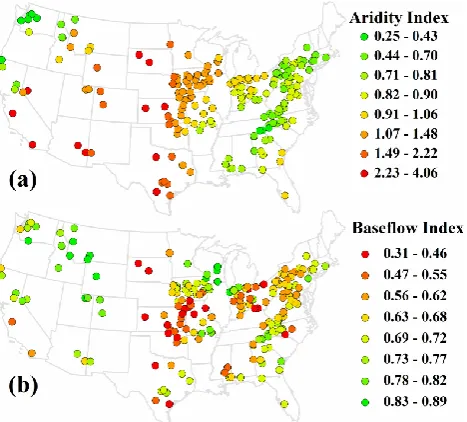
This investigation was carried out using data from the MOPEX dataset previously used by Sivapalan et al. (2011) and Harman et al. (2011). In addition, the time series of the fast flow and slow flow components of total runoff used here are the same as those produced by Sivapalan et al. (2011), through the use of a simple but very robust baseflow sep-aration algorithm proposed by Lyne and Hollick (1979). The MOPEX dataset (Duan et al., 2006) includes more than 400 catchments across the US, most containing up to 54 yr of continuous daily precipitation and streamflow data that can be freely accessed from http://www.nws.noaa.gov/oh/ mopex/index.html. A subset of 197 catchments, which have continuous daily records spanning from 1948 to 2001, was chosen for our analysis. These catchments range in size from 198 km2 to more than 3000 km2, and range in mean an-nual precipitation from 384 mm to more than 2500 mm. The selected 197 catchments, locations of which are shown in Fig. 1, cover a wide range of climate, eco-regions, and land-scapes across the contiguous US, although more than half of them are found in the Appalachian Mountain and the Interior Lowland regions.
Fig. 1. Distribution of 197 MOPEX catchments and spatial variabil-ity of (a) aridvariabil-ity index (AI) and (b) baseflow index (BI).
of total slow flow to the total streamflow of each catchment over the entire study period. BI is a property of the stream-flow regime, and as such it can reflect the collective impact of landscape properties such as geology, soil properties, to-pography, and vegetation on the streamflow regime (in addi-tion to climate) (Harman et al., 2009; Kirchner, 2009). In this study, BI is used as a surrogate for these catchment or land-scape properties. The regional patterns of AI and BI of the study catchments are shown in Fig. 1. The equation to esti-mate SI and its spatial pattern are provided in the Supplement and Fig. S2.
2.2 The mixed gamma distribution
As mentioned before, several probability distribution func-tions have been used in the past to model the FDC statis-tically. The choice of distributions is mostly determined by the objectives of the study and the flow regimes of the study catchments. In general, if the FDCs are represented by overly complex distributions with several parameters, more accurate fits could be achieved, yet one might also expect to find some correlation between different parameters and consequent un-certainty in the parameter estimates, which may confound efforts to distinguish the physical controls on the statistical parameters. Therefore, in order to achieve the goals of this paper, a simple statistical distribution is chosen, considering the need for parameter parsimony and the need to connect these parameters to climatic and landscape properties.
The gamma distribution is a two-parameter, continuous probability distribution. It is defined by a shape parameter,
κ, and a scale parameter,θ. Note that the FDC is the com-plementary cumulative distribution function (CCDF) of the
daily streamflow (Vogel and Fennessey, 1994). The FDC has to accommodate the presence of zero flows, especially in arid regions. For this reason, in this study, we employ the follow-ing mixed gamma distribution to represent the FDCs:
f (q, κ, θ, α )=
α, q=0
(1−α)·g (q, κ, θ ) , q >0 (1) whereαis the probability of zero flows, i.e., the number of zero flow days divided by the total number of days within the record, andg (q, κ, θ )is the probability density function of the gamma distribution, defined as
g (q, κ, θ )= 1 |θ|0 (κ)
q
θ
κ−1
exp−q
θ
(2) whereκ andθ are the shape and scale parameters, respec-tively. To estimate the flow given a probability of exceedance,
p, we use the following formulation:
q (p, κ, θ, α )=
(
G−11− p 1−α, κ, θ
,0≤p≤1−α
0, 1−α < p≤1 (3)
whereG−1is the inverse of the CCDF of the mixed gamma distribution (Eq. 1).
According to Eq. (3), the parameterαcontrols the zero-flow portion of the duration curve while both the κ andθ
parameters control the shape of the non-zero part of the flow duration curve. The scale parameterθlargely affects the ver-tical shift of the FDCs. The larger the mean observed stream-flow is, the higher theθ-value. On the other hand, the shape parameter κ essentially controls the slope of FDCs, and a smallerκ-value implies a steeper slope of the FDC. The pa-rameterαis estimated directly from the observations, as the fraction of days in the data record with zero flows, i.e., the number of days with zero flows divided by the total number of days in the flow record. The parametersκ andθ of the gamma function are estimated by the method of moments based on their relationship with mean (µ) and variance (v) of the gamma distribution.
µ=κ·θ (4)
v=κ·θ2 (5)
Here,µandvare estimated from theq >0 time series (the non-zero portion of the FDC).
R2=
n
P
i=1
qobs,i−qobs
qsim,i−qsim
s
n
P
i=1
qobs,i−qobs
2 s
n
P
i=1
qsim,i−qsim
2
2
(6)
Ens=1−
n
P
i=1
qsim,i−qobs,i2
n
P
i=1
qobs,i−qobs2
(7)
whereqsim,i is predicted value using Eq. (3); qobs,i is the
observed value;ivaries from 1 ton, wherenis the length of the flow record in days (n equals the number of days contained within 54 yr when constructing long-term duration curves, whereasnequals the number of days within one year when constructing annual duration curves);qobsandqsimare the mean of the observed and predicted values respectively. In essence, the more the R2 and Ens approach unity, the closer is the predicted duration curve to the observed dura-tion curve.
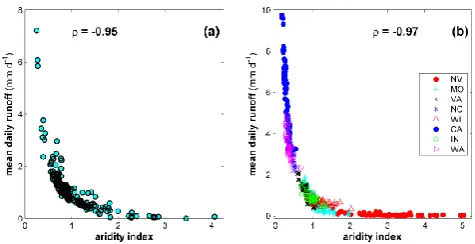
[image:5.595.309.547.60.182.2]In this study, mean daily total flow, mean daily fast flow and mean daily slow flow are used to normalize the total flow, fast flow and slow flow series, respectively. Additionally, the normalized times series (i.e., daily streamflow divided by the long-term mean daily streamflow) are used to construct em-pirical duration curves and to estimate the parameters of the mixed gamma distribution, since the mean daily streamflow is strongly related to the aridity index, as shown in Fig. 2. The competition between water and energy availability, as reflected in the aridity index, is a first-order control on an-nual catchment water balance (Cheng et al., 2011; Harman et al., 2011; Sivapalan et al., 2011). Hence, as suggested by Fig. 2, one can expect that the tendency of parameters of the FDC to change with AI will be significantly reduced or elim-inated by normalizing the streamflows by mean daily flows, thus allowing for the identification of the secondary physical controls on the shapes of the FDCs.
3 Results: performance of the mixed gamma distribution
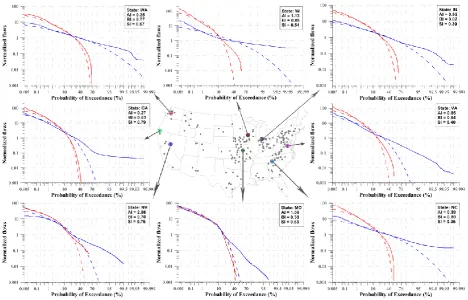
Normalized series are used to construct the PDC, TFDC, FFDC and SFDC for each of the 197 catchments, and in the case of the inter-annual variability, separately for each of the 54 yr of record. The mixed gamma distribution is fitted to each of these duration curves based on the respective nor-malized series, and the model parametersκ andθare deter-mined using the method of moments. The resulting estimates of the three statistical parameters, i.e.,α,κ andθ, in each catchment are used to predict the flow duration curves us-ing Eq. (3), i.e., to reconstruct the PDC, TFDC, FFDC and SFDC. As an illustration, Fig. 3 presents the empirical FDCs
Fig. 2. Nature of the relationship between mean daily streamflow and aridity index (AI) (a) across 197 catchments (between catch-ment variability), and (b) across many years (inter-annual variabil-ity) for 8 selected catchments. The Spearman’s rank correlation co-efficients (i.e., Spearman’sρ) are−0.95 and−0.97, respectively.
and the mixed gamma distribution fits for 8 of the 197 catch-ments selected across a climate gradient (N. B., these are the same catchments chosen for evaluating inter-year variability of FDCs). Note that only the TFDCs and FFDCs are plotted in Fig. 3 since the PDCs are reflective of the FFDC and the SFDC is closely related to the TFDC.
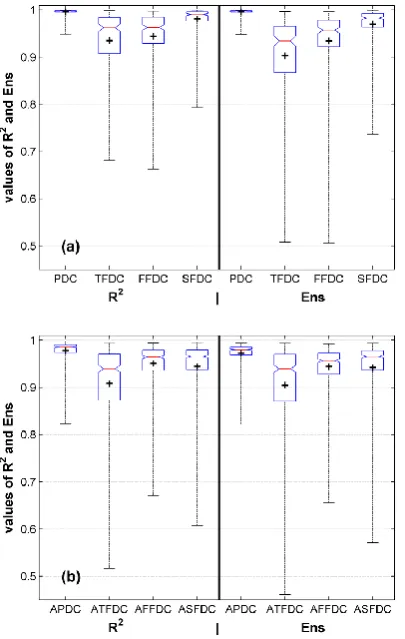
The results presented in Fig. 3 show that the mixed gamma distribution provides an adequate visual fit to the shapes of the FFDCs and TFDCs with the horizontal axis in normal probabilistic scale, except for the lower tail (low flow seg-ment of the FDCs), although the logarithmic scale employed for the vertical axis tends to exaggerate the poor fits of the low tail. The mixed gamma distribution also slightly under-estimates the upper tail (high flow segment) of the FDCs for most of the 197 catchments. The ability of the mixed gamma distribution to mimic the flow duration curves is assessed using the Nash-Sutcliffe coefficient of efficiency (Ens) and the goodness of fit (R2)estimated for the non-zero flow seg-ment of the normalized duration curves. Summary statistics for both Ens andR2for the 197 catchments, for each of the duration curves, are presented in Fig. 4.
From Fig. 4, we can see that, in spite of the visual dis-crepancies found in Fig. 3, the mixed gamma distribution is found to perform well in fitting the empirical duration curves: PDC, TFDC, FFDC and SFDC. As can be seen in Fig. 4a, the mean values of both Ens andR2for the TFDCs, FFDCs, and SFDCs are all larger than 0.9 in the 197 catchments. Simi-larly, as shown in Fig. 4b, the same is true in the case of inter-year variability of annual FDCs in the 8 selected catchments. In all cases, 75 % of the estimates of Ens andR2exceed 0.86. These results provide support to the use of the mixed gamma distribution to capture the shape of the FDCs, at least to first order. From the distribution of estimates of the Ens andR2
[image:5.595.45.278.76.201.2]Fig. 3. Normalized empirical FDCs (solid lines) and gamma distribution fits (dash lines) for 8 catchments: TFDC (blue lines) and FFDC (red lines).
different from the typical shape of the FDCs, which is diffi-cult to characterize by the simple mixed gamma distribution. On the other hand, the fits of the long-term and annual PDCs and SFDCs are better than those of the TFDCs and FFDCs. This may be due to the nature of variability represented in these different duration curves. The PDCs and SFDCs embed within them the system input and most stable components, respectively, and therefore it is easier for the mixed gamma distribution to capture their shapes. The TFDCs and FFDCs, on the other hand, include more complex runoff processes, which explain the difficulty of the mixed gamma distribution to capture them accurately.
4 Regional patterns in spatial variation of FDCs
Regional patterns in the estimated parameters α and κ of Eq. (3) for the PDC, TFDC, FFDC and SFDC, across the continental United States, are presented in Figs. 5 and 6. The estimates ofθ(not shown) are found to be approximately in-versely related to the estimates ofκowing to the fact that, for normalized flows, the scale parameterθof the mixed gamma distribution has an inverse relationship with the shape param-eterκ, i.e.,κ·θ=1/(1−α). Therefore, from now on, only the spatial patterns ofαandκ are presented and discussed.
From Figs. 5 and 6, we can see that the estimates ofαandκ
for the different duration curves exhibit interesting regional patterns of variability.
As can be seen by comparing Fig. 5 to Fig. 1, the higher
α-values for the PDC and FFDC appear in arid climate re-gions, whereas smaller values are found in humid regions. In the case of the TFDCs and SFDCs, non-zero values ofαare also found in the arid regions, with the largest values seen in the most arid catchments, such as those in southern Cal-ifornia, Texas, Kansas, and the Dakotas. Furthermore, con-firming the predictions by computer simulations of Yokoo and Sivapalan (2011), the spatial distributions ofαof PDCs and FFDCs share similar regional patterns, and those of the TFDCs and SFDCs also share similar regional patterns. Ad-ditionally, while their spatial patterns are similar, the α of FFDCs is generally larger than that of PDCs. Even then, sig-nificant differences can also be seen within the same climate zones, which might be caused by differences in geomorpho-logic or landscape features. Overall, the regional patterns of
αover the 197 catchments presented in Fig. 5 suggest that they are primarily governed by differences in climate, with secondary effects caused by differences in local landscape or geomorphologic features.
Fig. 4. Values ofR2and Ens of the mixed gamma distribution fitting to (a) normalized duration curves of 197 catchments and (b) 54 annual duration curves of 8 catchments. The plus signs (+) are the mean of all the fitted duration curves; the upper and lower whiskers represent the maximum and minimum values; the upper and lower lines of the box represent the third and first quartiles, and the line within the box indicates the median value.
[image:7.595.310.545.65.220.2]values are found in relatively more humid regions. This spa-tial pattern is likely caused by shorter duration of the dif-ferent curves in arid regions. Basically, the value of κ of fast flow duration curves is smaller than that of other du-ration curves. Theκ of slow flow duration curves is rela-tively larger among the four duration curves. This is due to fast flow having shorter duration and slow flow having longer duration among the different duration curves; steeper slopes and shorter spreads of the duration curves are associated with smaller values ofκ. Comparatively, the spatial distributions ofκof PDCs and FFDCs share similar regional patterns, and those of the TFDCs and SFDCs also share similar regional patterns. However, theκ-value of PDCs is generally larger than that of FFDCs and theκ of SFDCs is generally larger than that of TFDCs. Interestingly, the ranges of theκ-value of PDCs and FFDCs are much narrower than those of TFDCs and SFDCs. Furthermore, although the mixed gamma dis-tribution is fitted to the normalized FDCs and the tendency of mean daily flows to be determined by climate (namely,
Fig. 5. Regional patterns of variation ofαfor the different duration curves.
Fig. 6. Regional patterns of variation of parameterκfor the different duration curves.
aridity index) is already removed, the spatial patterns relating to climate zones and the discrepancies within the same cli-mate zones are also significant. This may suggest that other secondary climatic and physiographic features (i.e., other than aridity index) are possibly responsible for the differ-ences in the shapes of the FDCs. Likely candidates are cli-mate seasonality, within-storm variability of rainfall, ground-water contributions, vegetation, slope and shape of the catch-ments. The following analysis aims to identify which of these controls is perhaps dominant.
5 Discussion: similarity of FDCs and underlying physical controls
5.1 Similarity among different duration curves.
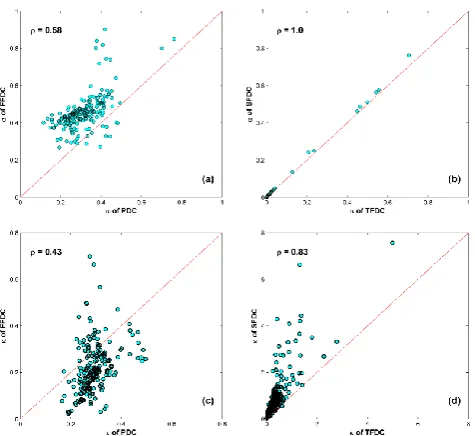
[image:7.595.311.546.265.423.2]linearly correlated but with much larger deviations than the TFDC and SFDC, as shown in Fig. 7a and b. That is to say, the fraction of zero flow days (α) of FFDCs can be trans-formed from that of PDC at the daily time scale but it is potentially a non-linear relationship, as indicated by Yokoo and Sivapalan (2011). The shape parametersκrelating to the PDC and FFDC are related to each other, and a similar re-lationship can also be found between the TFDC and SFDC, as shown in Fig. 7c and d. Spearman’s rank correlation coef-ficients (i.e., Spearman’sρ) are 0.43 and 0.83 for these two correlations, respectively. The parameterθis correlated with the mean values of the time series and the parameterκ. Anal-ogously, strong correlations of the parameterθbetween the PDC and FFDC and between the TFDC and SFDC are also found (not shown here for brevity).
[image:8.595.310.548.59.277.2]Regarding similarity between PDC and FFDC, a much higher degree of similarity can be found in the upper tail of the PDC and FFDC than in the lower tail (Fig. 3). Ba-sically, the parameterα of the FFDC is strongly related to the absence of precipitation, i.e.,αparameter of the precip-itation duration curve. However, fast flow occurs only after precipitation satisfies the initial losses, field capacity of soil, and/or exceeds the infiltration capacity of the surface soil layer. Moreover, the slope, shape, stream network, and other catchment characteristics can exert additional influences af-ter fast flow is generated. Therefore, correlation can be found between the parameters of the PDC and FFDC, but with some expected dispersion. This correlation allows us to reconstruct the FFDC from rainfall data. The dispersion between the re-lationship betweenαparameter of PDC and FFDC implies that some other factors likely also play an important role on the FFDC with PDC, including topographic influences. The response of the fast flow to precipitation is controlled by sev-eral “threshold” catchment characteristics, including vegeta-tion cover, topographic slope, and soil properties. Small pre-cipitation events would therefore not yield fast flow. Hence, the similarity of the lower tail between the PDC and FFDC is weak, the FFDC is steeper, and theκ-value of the FFDC is smaller than that of the PDC. Regarding the similarity be-tween the TFDC and SFDC, theκ parameter of the SFDC is larger than that of the TFDC, since higher flows are sepa-rated out during fast flow. As a result, the SFDC is flatter and itsκ is larger. The difference in shape between the TFDC and SFDC appears in the upper tail of the duration curves. Comparatively, the similarity in shape between the TFDC and SFDC is more pronounced than the similarity between the PDC and FFDC. Finally, both of these similarities de-crease asκ increases, as shown in Fig. 7. These empirical correlations arising from the similarities in the spatial pat-terns of shape parameters of different duration curves may not be good enough for practical application as yet, but can help advance the research on developing more process-based understanding of the physical basis of the FDCs for use in regionalization studies.
Fig. 7. Cross-correlation of parametersκandαof the mixed gamma distribution between PDC and FFDC (a and c), and between TFDC and SFDC (b and d).
5.2 Correlating parameterκwith catchment physical characteristics
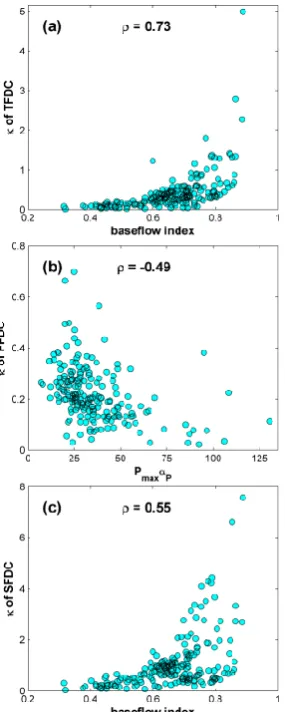
To assist towards the reconstruction of the FDCs, the shape parametersκ of the TFDC, FFDC and SFDC are regressed against several climatic and physiographic features. We find that both the between-catchment (Fig. 8) and between-year (Fig. 9) variability of theκparameter of the TFDC and SFDC are closely correlated to the baseflow index (Figs. 8a, c, 9a, and c), while theκ-values of the FFDC are closely correlated to the product of the maximum daily precipitation (Pmax) andαP (Figs. 8b and 9b). Since precipitation is the prereq-uisite for fast flow, for a specific catchment, the maximum fast flow generally appears at the maximum daily precipi-tation, and the maximum probability of exceedance of the FFDC is determined by the occurrences of the precipita-tion. Therefore, the product of Pmax·αP is selected as the climate control on the shape of the FFDC. Between catch-ments, Spearman’s rank correlation coefficients (ρ)are 0.73, −0.49 and 0.55 for correlations between theκ-values of the TFDC and BI, betweenκ-values of the FFDC andPmax·αP, and between theκ-values of the SFDC and BI, respectively, as shown in Fig. 8. Between years, for the 8 chosen catch-ments, Spearman’s rank correlation coefficients (ρ)are 0.87, −0.37 and 0.79 for correlations between theκ-values of the annual TFDCs and BI, theκ-values of the annual FFDC and
Pmax·αP, and between theκ-values of the annual SFDC and BI, respectively, as seen in Fig. 9.
Fig. 8. Correlation of parameter κ of TFDC, FFDC and SFDC of 197 catchments (between catchment variability) with catchment physical characteristics.
and climate. As can be seen from Fig. 8a and c, between-catchment variability of the shapes of both the TFDCs and SFDCs of the 197 catchments increases monotonically with BI. This implies that the spatial variations of both TFDCs and SFDCs are governed by those climate factors and catchment characteristics that impact the partitioning of runoff into fast and slow components. The catchments with larger BI should have larger proportions of slow flow, and the TFDC or SFDC will therefore be flatter. Thus, the BI can be used to esti-mate theκ-value of the TFDC and SFDC. Meanwhile, the between-year variability of the shape of the TFDC and SFDC is also governed by the same climate and landscape charac-teristics, as suggested by Fig. 9a and c. Further investiga-tions showed that both the catchment and between-year variability ofκ-values of the TFDC and SFDC show noticeable correlation with the seasonality index, SI, but not as strongly as with respect to BI.
[image:9.595.98.241.61.418.2]In the case of the FFDC, the between-catchment and between-year variability of the shape parameter κ display
Fig. 9. Correlation of parameterκof annual TFDC (ATFDC), an-nual FFDC (AFFDC) and anan-nual SFDC (ASFDC) of 8 selected catchments (inter-annual variability) with catchment physical char-acteristics.
a strong correlation with Pmax·αP. From Fig. 8b, we can see that between-year variability of the shape parameter κ
of the FFDC decreases with Pmax·αP. One can then infer that the spatial variation of the shape of the FFDC is sig-nificantly influenced by daily precipitation patterns, as is the between-year variability, as shown in Fig. 9b. Basically,Pmax can represent the maximum intensity of daily precipitation and it can possibly generate the maximum fast flow, which is at the high end of the FFDC. Conversely,αP is the com-plementary possibility of the occurrence of precipitation, re-lated to the spreading out of the FFDC, because the presence of intense precipitation is a pre-requisite for fast flow. Con-sequently, the productPmax·αPresult can be used to predict both the between-catchment and between-year variability of the FFDC.
(AI and SI) and a geologic (BI) gradient. In this case the pa-rameter estimates and catchment characteristics for each of 54 yr, and the results from all 8 catchments are presented in the same plot, using different colors to distinguish between the catchments. The results show evidence of considerable space-time symmetry, with the nature of the relationship be-tween the statistical parameters of the FDCs and the catch-ment physical characteristics exhibiting similar relationships, i.e., between 54 yr (for 8 catchments) and between 197 catch-ments (as shown in Fig. 8). This is somewhat tempered by the fact that the relationships in Figs. 8 and 9 include con-siderable scatter, especially in the case of Fig. 8b. Indeed, the relationships are stronger in the case of the between-year variability than in the case of between-catchment variability. This suggests that other factors may be controlling as well (Lane et al., 2005; Zheng et al., 2007; Zhao et al., 2012). For the TFDC and SFDC, the baseflow index, BI, can be con-sidered as the primary (but not sole) control on the shapes of normalized FDCs. For the FFDC, the product Pmax·αP does not fully capture the filtering of precipitation variability at event scale to fast flow duration curves, and other factors must be explored to explain the lack of fits of the lower tail (i.e., low flow segments) of the PDC and SFDC, as discussed in previous sections. These physical controls on the differ-ent duration curves as shown in Figs. 8 and 9 can benefit future work aimed at reconstructing and/or regionalizing du-ration curves in ungauged basins, although the correlations may not be good enough to be applied directly to construct the duration curve for a specific catchment or for one specific year. With respect to the practical application in predicting in ungauged basins (i.e., PUB), daily rainfall data and the base-flow index data are not available. Convolution of the fast and slow FDCs to reconstruct FDCs also cannot be easily carried out. However, while overcoming these prediction challenges is beyond the scope of this study, the results presented here can provide a basis for further research into this problem.
6 Conclusions
Guided by the conceptual framework proposed by Yokoo and Sivapalan (2011), this study has explored the physical con-trols on the variability of FDCs both between catchments (for 197 catchments within the continental United States) and between years (using 8 selected catchments with 54 yr of continuous flow data). The mixed gamma distribution is employed to capture the shape of the total flow duration curves, as well as its two components, i.e., fast flow duration curves and slow flow duration curves, and to decipher the re-lationship between the parameters of the mixed gamma dis-tribution and climate properties and catchment physiograph-ical characteristics. We found that the three-parameter mixed gamma distribution can capture the shapes of the different FDCs very well. The mean Nash-Sutcliffe efficiency andR2
of fits of the FDCs predicted by the fitted parameters to the
empirical FDCs are all larger than 0.9. The spatial varia-tions of the three model parameters exhibit coherent regional patterns. Further investigation of the relationships between the statistical model parameters and climatic and landscape properties showed that the baseflow index (ratio of slow flow to total flow over the study period) is the dominant control on the shape of the both normalized total flow duration curves and slow flow duration curves, and Pmax·αP (the product of maximum daily precipitation and non-precipitation prob-ability) was shown to be closely related to the shape of fast flow duration curves. However, based on the scatter in these relationships, it is apparent that there are other factors that may be involved in governing the shapes of the FDCs, which requires further research, perhaps through refinement of the conceptual framework of Yokoo and Sivapalan (2011).
The work presented in this paper is a significant first step towards understanding the physical controls of the FDCs, as a prelude to predictions in ungauged catchments. The results of this study provided some confirmation for the conceptual framework proposed by Yokoo and Sivapalan (2011), involv-ing the separation of total runoff into fast and slow flow com-ponents. It also confirmed their supposition that the FDCs of the fast flow component strongly reflect the duration curves of precipitation, whereas the FDCs of the slow flow compo-nent show a considerable departure from precipitation due to the strong filtering by the catchment’s subsurface flow path-ways. This is also confirmed by the strong climatic control of the fast flow duration curves (i.e., product of maximum pre-cipitation intensity and fraction of days of zero prepre-cipitation) and the combined effects of climate and landscape control of the slow flow duration curve (i.e., baseflow index).
flows and slow flows, including especially the processes that contribute to the lower tail of the FDCs. Additional insights into the process controls of the FDCs, especially the slow flow duration curves, are presented in the companion papers by Ye et al. (2012) and Coopersmith et al. (2012). A syn-thesis of these empirical and process studies towards devel-oping deeper insights into the physical controls on the ob-served regional patterns of the FDCs is presented in Yaeger et al. (2012).
Supplementary material related to this article is
available online at: http://www.hydrol-earth-syst-sci.net/ 16/4435/2012/hess-16-4435-2012-supplement.pdf.
Acknowledgements. The work presented in this paper was carried out as part of the NSF-funded project “Water Cycle Dynamics in a Changing Environment: Advancing Hydrologic Science through Synthesis” (NSF grant EAR-0636043, M. Sivapalan, PI), also the NSF project “Understanding the Hydrologic Implications of Land-scape Structure and Climate – Toward a Unifying Framework of Watershed Similarity” (NSF Grant EAR-0635998, T. Wagener, PI). Special thanks are owed to Matej Durcik of SAHRA (University of Arizona) for providing the version of the MOPEX dataset used in this study. We also wish to thank our referees for their constructive criticism and insights which have helped us improve this work.
Edited by: R. Woods
References
Booker, D. J. and Snelder, T. H.: Comparing methods for estimating flow duration curves at ungauged sites, J. Hydrol., 434–435, 78– 94, doi:10.1016/j.jhydrol.2012.02.031, 2012.
Botter, G.: Stochastic recession rates and the probabilistic struc-ture of stream flows, Water Resour. Res., 46, W12527, doi:10.1029/2010WR009217, 2010.
Botter, G., Porporato, A., Rodriguez-Iturbe, I., and Rinaldo, A.: Basin-scale soil moisture dynamics and the probabilistic char-acterization of carrier hydrologic flows: Slow, leaching-prone components of the hydrologic response, Water Resour. Res., 43, W02417, doi:10.1029/2006WR005043, 2007a.
Botter, G., Peratoner, F., Porporato, A., Rodriguez-Iturbe, I., and Rinaldo, A.: Signatures of large-scale soil moisture dynamics on streamflow statistics across U.S. climate regimes, Water Resour. Res., 43, W11413, doi:10.1029/2007WR006162, 2007b. Botter, G., Zanardo, S., Porporato, A., Rodriguez-Iturbe, I.,
and Rinaldo, A.: Ecohydrological model of flow duration curves and annual minima, Water Resour. Res., 44, W08418, doi:10.1029/2008WR006814, 2008.
Botter, G., Porporato, A., Rodriguez-Iturbe, I., and Rinaldo, A.: Nonlinear storage-discharge relations and catchment streamflow regimes, Water Resour. Res., 45, W10427, doi:10.1029/2008WR007658, 2009.
Brooks, P. D., Troch, P. A., Durcik, M., Gallo, E., and Schlegel, M.: Quantifying regional scale ecosystem response to changes in precipitation: Not all rain is created equal, Water Resour. Res., 47, W00J08, doi:10.1029/2010WR009762, 2011.
Castellarin, A., Vogel, R. M., and Brath, A.: A stochastic index flow model of flow duration curves, Water Resour. Res., 40, W03104, doi:10.1029/2003WR002524, 2004a.
Castellarin, A., Galeati, G., Brandimarte, L., Montanari, A., and Brath, A.: Regional flow-duration curves: reliability for ungauged basins, Adv. Water Resour., 27, 953–965, doi:10.1016/j.advwatres.2004.08.005, 2004b.
Castellarin, A., Camorani, G., and Brath, A.: Predicting annual and long-term flow-duration curves in ungauged basins, Adv. Wa-ter Resour., 30, 937–953, doi:10.1016/j.advwatres.2006.08.006, 2007.
Cheng, L., Xu, Z., Wang, D., and Cai, X.: Assessing interannual variability of evapotranspiration at the catchment scale using satellite-based evapotranspiration data sets, Water Resour. Res., 47, W09509, doi:10.1029/2011WR010636, 2011.
Ceola, S., Botter, G., Bertuzzo, E., Porporato, A., Rodriguez-Iturbe, I., and Rinaldo, A.: Comparative study of ecohydrolog-ical streamflow probability distributions, Water Resour. Res., 46, W09502, doi:10.1029/2010WR009102, 2010.
Coopersmith, E., Yaeger, M. A., Ye, S., Cheng, L., and Sivapalan, M.: Exploring the physical controls of regional patterns of flow duration curves – Part 3: A catchment classification system based on regime curve indicators, Hydrol. Earth Syst. Sci., 16, 4467– 4482, doi:10.5194/hess-16-4467-2012, 2012.
Duan, Q., Schaake, J., Andr´eassian, V., Franks, S., Goteti, G., Gupta, H. V., Gusev, Y. M., Habets, F., Hall, A., Hay, L., Hogue, T., Huang, M., Leavesley, G., Liang, X., Nasonova, O. N., Noilhan, J., Oudin, L., Sorooshian, S., Wagener, T., and Wood, E. F.: Model Parameter Estimation Experiment (MOPEX): An overview of science strategy and major results from the second and third workshops, J. Hydrol., 320, 3–17, doi:10.1016/j.jhydrol.2005.07.031, 2006.
Ganora, D., Claps, P., Laio, F., and Viglione, A.: An approach to estimate nonparametric flow duration curves in ungauged basins, Water Resour. Res., 45, W10418, doi:10.1029/2008WR007472, 2009.
Harman, C. J., Sivapalan, M., and Kumar, P.: Power law catchment-scale recessions arising from heterogeneous lin-ear small-scale dynamics, Water Resour. Res., 45, W09404, doi:10.1029/2008WR007392, 2009.
Harman, C. J., Troch, P. A., and Sivapalan, M.: Functional model of water balance variability at the catchment scale: 2. Elasticity of fast and slow runoff components to precipitation change in the continental United States, Water Resour. Res., 47, W02523, doi:10.1029/2010WR009656, 2011.
Iacobellis, V.: Probabilistic model for the estimation of T year flow duration curves, Water Resour. Res., 44, W02413, doi:10.1029/2006WR005400, 2008.
Kirchner, J. W.: Catchments as simple dynamical systems: Catchment characterization, rainfall-runoff modeling, and do-ing hydrology backward, Water Resour. Res., 45, W02429, doi:10.1029/2008WR006912, 2009.
Lane, P. N. J., Best, A. E., Hickel, K., and Zhang, L.: The response of flow duration curves to afforestation, J. Hydrol., 310, 253–265, 2005.
LeBoutillier, D. W. and Waylen, P. R.: A stochastic model of flow duration curves, Water Resour. Res., 29, 3535–3541, doi:10.1029/93WR01409, 1993.
Li, M., Shao, Q., Zhang, L., and Chiew, F. H. S.: A new re-gionalization approach and its application to predict flow du-ration curve in ungauged basins, J. Hydrol., 389, 137–145, doi:10.1016/j.jhydrol.2010.05.039, 2010.
Lyne, V. and Hollick, M.: Stochastic time-variable rainfall-runoff modelling, in Proceedings, Institute of Engineers Australia Na-tional Conference, Inst. Engrs., Canberra, Australia, ACT. Publ. 79/10, 89–93, 1979.
Mimikou, M. and Kaemaki, S.: Regionalization of flow dura-tion characteristics, J. Hydrol., 82, 77–91, doi:10.1016/0022-1694(85)90048-4, 1985.
Mohamoud, Y. M.: Prediction of daily flow duration curves and streamflow for ungauged catchments using regional flow duration curves, Hydrolog. Sci. J., 53, 706–724, doi:10.1623/hysj.53.4.706, 2008.
Muneepeerakul, R., Azaele, S., Botter, G., Rinaldo, A., and Rodriguez-Iturbe, I.: Daily streamflow analysis based on a two-scaled gamma pulse model, Water Resour. Res., 46, W11546, doi:10.1029/2010WR009286, 2010.
Nash, J. E. and Sutcliffe, J. V.: River flow forecasting through con-ceptual models part I — A discussion of principles, J. Hydrol., 10, 282–290, doi:10.1016/0022-1694(70)90255-6, 1970. Searcy, J. K.: Flow-Duration Curves, US Geological Survey Water
Supply Paper 1542-A, 33 pp., 1959.
Singh, K. P.: Model Flow Duration and Streamflow Variability, Wa-ter Resour. Res., 7, 1031–1036, doi:10.1029/WR007i004p01031, 1971.
Sivapalan, M., Takeuchi, K., Franks, S. W., Gupta, V. K., Karam-biri, H., Lakshmi, V., Liang, X., McDonnell, J. J., Mendiondo, E. M., O Connell, P. E., Oki, T., Pomeroy, J. W., Schertzer, D., Uhlenbrook, S., and Zehe, E.: IAHS decade on predictions in ungauged basins (PUB), 2003–2012: Shaping an exciting future for the hydrological sciences, Hydrolog. Sci. J., 48, 857–880, doi:10.1623/hysj.48.6.857.51421, 2003a.
Sivapalan, M., Bl¨oschl, G., Zhang, L., and Vertessy, R.: Downward approach to hydrological prediction, Hydrol. Process., 17, 2099, doi:10.1002/hyp.1426, 2003b.
Sivapalan, M., Yaeger, M. A., Harman, C. J., Xu, X., and Troch, P. A.: Functional model of water balance variability at the catchment scale: 1. Evidence of hydrologic similarity and space-time symmetry, Water Resour. Res., 47, W02522, doi:10.1029/2010WR009568, 2011.
Smakhtin, V. U.: Low flow hydrology: a review, J. Hydrol., 240, 147–186, doi:10.1016/S0022-1694(00)00340-1, 2001.
Smakhtin, V. Y., Hughes, D. A., and Creuse-Naudin, E.: Re-gionalization of daily flow characteristics in part of the East-ern Cape, South Africa, Hydrolog. Sci. J., 42, 919–936, doi:10.1080/02626669709492088, 1997.
Tharme, R. E.: A global perspective on environmental flow assess-ment: emerging trends in the development and application of en-vironmental flow methodologies for rivers, River Res. Appl., 19, 397–441, doi:10.1002/rra.736, 2003.
Vogel, R. M. and Fennessey, N. M.: Flow-duration curves. I: New interpretation and confidence intervals, J. Water Resour. Pl.-ASCE, 120, 485–504, doi:10.1061/(ASCE)0733-9496(1994)120:4(485), 1994.
Vogel, R. M. and Fennessey, N. M.: Flow duration curve II: a review of applications in water resources planning, J. Am. Water Resour. As., 31, 1029–1039, doi:10.1111/j.1752-1688.1995.tb03419.x, 1995.
Walsh, P. D. and Lawler, D. M.: Rainfall seasonality: description, spatial patterns and change through time, Weather, 36, 201–208, doi:10.1002/j.1477-8696.1981.tb05400.x, 1981.
Ward, R. C. and Robinson, M.: Principles of Hydrology, 3rd Edn., McGraw-Hill, Berkshire, England, 1990.
Westerberg, I. K., Guerrero, J.-L., Younger, P. M., Beven, K. J., Seibert, J., Halldin, S., Freer, J. E., and Xu, C.-Y.: Calibra-tion of hydrological models using flow-duraCalibra-tion curves, Hy-drol. Earth Syst. Sci., 15, 2205–2227, doi:10.5194/hess-15-2205-2011, 2011.
Yaeger, M., Coopersmith, E., Ye, S., Cheng, L., Viglione, A., and Sivapalan, M.: Exploring the physical controls of regional pat-terns of flow duration curves – Part 4: A synthesis of empiri-cal analysis, process modeling and catchment classification, Hy-drol. Earth Syst. Sci., 16, 4483–4498, doi:10.5194/hess-16-4483-2012, 2012.
Ye, S., Yaeger, M., Coopersmith, E., Cheng, L., and Sivapalan, M.: Exploring the physical controls of regional patterns of flow du-ration curves – Part 2: Role of seasonality, the regime curve, and associated process controls, Hydrol. Earth Syst. Sci., 16, 4447– 4465, doi:10.5194/hess-16-4447-2012, 2012.
Yilmaz, K. K., Gupta, H. V., and Wagener, T.: A process-based di-agnostic approach to model evaluation: Application to the NWS distributed hydrologic model, Water Resour. Res., 44, W09417, doi:10.1029/2007WR006716, 2008.
Yokoo, Y. and Sivapalan, M.: Towards reconstruction of the flow duration curve: development of a conceptual framework with a physical basis, Hydrol. Earth Syst. Sci., 15, 2805–2819, doi:10.5194/hess-15-2805-2011, 2011.
Zhang, L., Potter, N., Hickel, K., Zhang, Y., and Shao, Q.: Water balance modeling over variable time scales based on the Budyko framework – Model development and testing, J. Hydrol., 360, 117–131, doi:10.1016/j.jhydrol.2008.07.021, 2008.
Zhao, F., Xu, Z., and Zhang, L.: Changes in streamflow regime fol-lowing vegetation changes from paired catchments, Hydrol. Pro-cess., 26, 1561–1573, doi:10.1002/hyp.8266, 2012.