Framework Implementation for Smart Water
Management
Lian Guey Ler
1and Philippe Gourbesville
11 Université Côte d’Azur, Polytech Lab, Polytech Nice Sophia
[email protected], [email protected]
Abstract
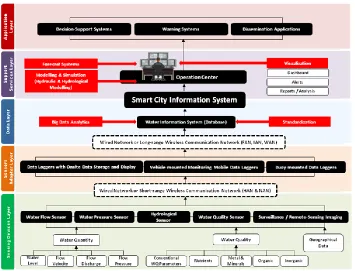
The objective of smart water management is to achieve water security at all levels (building, city and regional) in a sustainability and self- sufficiency manner, through the use of information technology, monitoring and control technology and the implementation of holistic system of all the processes in water cycle. It also provides the water utilties economic benefits through the reduction of non-revenue water losses through the detection of illegal connections and water theft. According to the characteristics of smart water, we proposed the following overall framework for a smart water city. In the proposed framework, there are seven main components which can be categorized into three main compartments. First is Hardware (Sensors and Sensors Adapters) which deals data acquisition, monitoring, conversion and transmission. The second component is Water Information System (Big Water Data Management and Analysis) which deals with data processing and storage. The third one is Software (Support Services and Applications), which deals with modelling and analytics, real-time monitoring and control system, decision support system and visualization and dissemination of information to stakeholders.
Keywords: ICT, Implementation Framework, Smart Water Management
1
Introduction
Water resource management involved many different parties that include water utilities, water authorities and regulators and the end-users. Although many planning, monitoring and optimization tools have been developed and implemented, like hydrologic and hydraulic models, real-time monitoring system and controlling systems for water treatment and distribution, decision support systems for reservoir and hydraulic infrastructure operations, these systems usually does not communicate with each other and thus raises a need to have a framework that integrate all these applications together (Anzaldi, 2014). The lack of water ICT standards prevents an effective interoperability and increases the cost and maintenance of such applications (Robles, et al., 2015).
Volume 3, 2018, Pages 1139–1146
The objective of smart water management is to achieve water security at all levels (building, city and regional) in a sustainability and self- sufficiency manner, through the use of information technology, monitoring and control technology and the implementation of holistic system of all the processes in water cycle. Some of the primary features of water management include pressure management, smarter leakage techniques for water networks, smart network operations and maintenance of the water cycle, smart water meter technology, and smart water quality monitoring. Countries around the globe are becoming increasingly aware of the critical nature of the water situation. According to analysts at Technavio, the global smart water management market stood at approximately $7 billion in 2015, and is expected to reach $16.73 billion by 2020*.
2
Proposed Smart Water Management (SWM) Framework
According to the characteristics of smart water, we proposed the following overall framework for a smart water city shown in Figure 1. There are seven main components which can be categorized into three main compartments. They are as follows:
1. Hardware (Sensors and Sensors Adapters) a. Data acquisition and monitoring b. Data conversion and transmission
2. Water Information System (Big Water Data Management and Analysis) a. Data processing and Storage
3. Software (Support Services and Applications) a. Modelling and analytics
b. Real-Time Monitoring and Control System c. Decision Support System and Visualization d. Dissemination of information to stakeholders
• Sensing Devices Layer: This is responsible for the recording of measurements using the sensing devices. The communication between the sensors and their data loggers are usually in the area size of HANs and NANs. This allows the use of short range wireless communication network (Wi-Fi or Zigbee) or wired network (PLC). It should be noted that in remote areas, long-range wireless communication network will be more applicable than short-range or wired communication network. However, this will bring about the issue of sensors’ battery where constant power supply is often not available in such remote places, especially when dealing with measurement of water quality in water bodies.
• Sensing Adapters Layer: This is responsible for transmitting the recorded data from the sensors to the central system. The communications between the data loggers and the information system are usually in the area size of FANs, IANs and WANs. This requires mid to long range communication network, although short range communication networks can be used with the implementation of repeaters. It should be noted that Data Aggregation Points (DAPs) not only help to reduce the long range communication distance requirements, but it also help in reducing the data transfer
volume by aggregating the recorded data from the various sensors and eliminating data redundancy.
• Data Layer: This is responsible for storing and managing the large volume of data collected from the sensors. In addition, it serves as the standardization point where the data collected will be processed such that data will be standardized with other smart city sectors’ data domains. Currently, such cross sectors standards have been deployed by oneM2M . Some of the benefits from the cross sectors standardization include:
- Reduced deployment & operation costs through the sharing and reuse of infrastructure and field devices, cost-effective products due to shared R&D efforts and easier and cheaper integration and application development
- Sustainable investments as there is no vendor lock-in and the utilities will benefit from further evolution of the standards in the long run
• Service Support Layer: This is responsible for providing the functions of operation support, application security management, workflow management, data exchange and sharing, the RFID middleware, the GIS support platform, modelling and simulations of the water system as well as the visualization of the results and analysis reporting.
• Application Layer: This is responsible for the decision-support systems where optimization decisions and management steps are taken from the analysis of the work done in the Service Support Layer. Examples includes intelligent regulation and optimization of water quality and quantity, efficiency dispatching of work service required and early warning of potential water shortages or overflow.
3
Hardware: Sensors and Connectivity
This layer of the architecture is the “eyes” for SWM, responsible for collecting and transmitting information regarding the water cycle, environment and water system. For the collection of the information, sensors are installed at the area of interests to observe and record the information at the desired time intervals. In SWM, water metering is of the great interest to the water utilities.
Sensors can be implemented on three different scales: single fixture (e.g., on faucet-level), block level (e.g., household, building, hydraulic infrastructure like dam) and district level (e.g., water distribution network). At the one side of the spectrum, approaches are focused on extracting information from a single sensing point through data disaggregation (centralized systems). On the other side, a (possible large) number of additional sensors at individual fixtures are used (distributed sensing), with the solution resembling a networked system of sensors that are able to communicate.
Type of Sensor Flow Rate Flow Turbidity Applications
High High
Conventional Meters
Displacement Metes Low Low Water Supply
Velocity Meters Low Low Water Supply
Turbine Meters High Low Water Supply
Compound Meters Low / High Low Water Supply
Electromagnetic Meters Low / High High Wastewater, Sewer
Ultrasonic Meters
Doppler Meters Low / High High Wastewater, Sewer Time Transit Meters Low / High Low Water Supply Table 1: Characteristics of Water Meters Sensors
Table 1 shows the capability of the water meters of measuring the water flow for flow rate and flow turbidity. Meters that are only able to measure low flow rate are suitable for residential while meters that are capable of handling both high and low are suitable to industrial (eg. water treatment plants and waste water treatment plants). In addition, meters that can handle low flow turbidity require attention to the flow quality. For conventional meters, attention should be given for the maintenance of physical measuring elements to ensure there is no clogging. For time transit meters, it is not suitable for measuring high turbidity flow like wastewater or sewer water, which Doppler meters are suitable for. Electromagnetic meters are also ideal for wastewater and sewer applications. In recent times, noise water meters and pressure water meters have been deployed in the water networks to measure water flow by sensing the pipe vibrations induced and pressure changes in the pipe respectively. For example, Visenti has developed LeakViewTM system which is able to detect water main breaks on pipes with diameter less than 600mm with an average accuracy of +/-5m by indentifying acoustic noise related to such breaks.
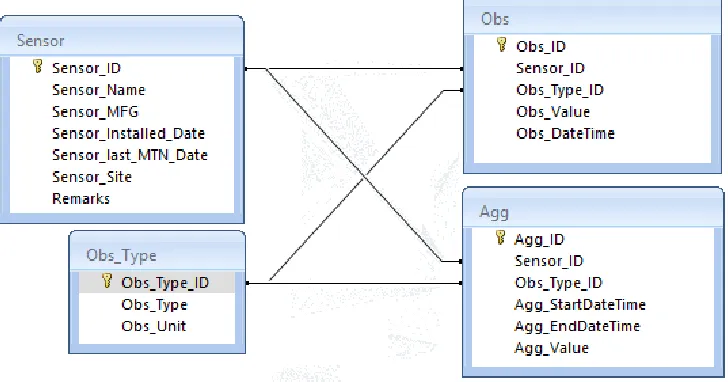
It is important to ensure that the sensor data from different sources are properly defined and integrated. Figure 2 shows the relationship of the sensors data fields from a typical sensor reading. By storing the information into four distinct tables, it is possible to have an aggregation of the data of different types of measurements in a standardized single table.
different types of data to be stored in the same ‘Obs’ table. Finally, the ‘Agg’ table stores the processed data where measured data from the sensors are summed up for a larger time scale.
For the Hydrological information, there has exists many different standards and tools available for collecting, processing and managing them. They include Archydro, WaterML2.0, Australian Water Data Transfer Format, Water Quality Exchange (WQX), XHydro, KISTERS, EA Time Series Data Exchange Format (UK-EA-TS), The French National Service for Water Data and Common Repositories Management (SANDRE), The Open Modelling Interface (OpenMI), DelftFEWS, Climate Science Modelling Language (CSML), CUAHSI Hydrologic Information System (CUAHSI-HIS).
Once the data is collected, filtered and standardized, it has to be stored or transmitted. Data loggers are used to collect and store the data which in turn will transmit the data to the central system via direct or remote access. There are two technologies available, which are Automatic meter reading (AMR) and Advanced Metering Infrastructure (AMI).
As the sensors are employed at different scales: single fixture (e.g., on faucet-level), block level (e.g., household, building, hydraulic infrastructure like dam) and district level (e.g., water distribution network), different types of connectivity solutions will be more applicable and ideal for the sensors employed at different scales. The various communication technologies and their technical specifications are shown in Table 2. (Gungor, et al., 2011) (Ho, Gao, Rajalingham, & Le-Ngoc, 2014) (Parikh, Kanabar, & Sidhu, 2010)
Technology Spectrum Data Rate Coverage Standards Protocols
3G Cellular 1.6-2.5 GHz Up to 2 Mbps 1-10 km UMTS, CDMA2000, EV-DO, EDGE
4G Cellular 2.0-8.0 GHz Up to 1
Gbps 1-10 km LTE
5G Cellular 3.3-86.0 GHz >1Gbps 1-10 km -
Bluetooth 2.4 Ghz 721 Kbps 1 – 100m IEEE 802.15.1
GPRS 900 - 1800 MHz 14.4 Kpbs 1-10 km IP, PPP, X.25
LoRa 150Mhz -1 Ghz 0.3–50 Kb/s <30 Km LoRaWAN R1.0
PLC 1.8-86.0 MHz 2-3 Mbps 1-3 km Universal powerline
bus, X10, LonTalk
WiMAX
2.3 GHz, 2.5 GHz, 3.3 GHz, 3.5 GHz, 5.8 GHz
75 Mbps 1-50km IEEE 802.16
Wireless Local Area Network (WLAN)
2,4 GHz 1-54 Mbps 100 m IEEE 802.11b/g/n
ZigBee 868 - 915 MHz, 2.4
Ghz 250 Kbps
10-100 m
EEE 802.15.4, ZigBee Alliance
Table 2: Characteristics of Water Meters Sensors
4
Water Information System
There are many models of the utilities business are available on the market, with most of them coming from software vendors, whose objective is selling their software package solutions and not on creating or ensuring interoperability of the system with others. Therefore, there is a need for an overall consistent approach made of an integrated model of the water business processes where the ideal Information System (IS) is based on Business Process (BP) model [6]. This consistent IS can be reach by a real integration and by gateways or interfaces. Targeting an IS, helps to establish a single definition and way of managing each data item. In other words, this consistent IS, together with standardised ontologies, is the key to real interoperability. The processes of generating or capturing data need to be managed and monitored and reference data and how they are shared within the information system has to be defined. But, above all, the target system should be fully aligned with the water business processes. The approach has been already promoted for example within the Smart Water Management Initiative taken by K-water. (Choi, Chong, Kim, & Ryu, 2016)
5
Smart City Connections
It is important to consider the smart city connections when implementing the smart water management. Typically, when one think of the different systems in a Smart City, they envisioned the individual systems are compartmentalized and are connected to a central system via the information system. However, this is not the most efficient way of managing the Smart City as a whole. Instead all the systems should be integrated together from the bottom (Communication Network layer) all the way to the top (IoT Information System layer).
Security & Governance component as they implement sensing devices which are usually in the same area of interest (location, data frequency) as the smart water management.
In addition, having the integration from the sensing devices layer among the different components will improve the ease of achieving interoperability of the smart city information system and reduce the data redundancy and occurrence of data conflict or missing data. Some of the connections between the different domains of a smart city are shown in the Figure 3. In the sensors layer, [Healthcare], [Security] and [Transportation] all contribute to the smart sensing of the water system.
[Security] provides video surveillance of water infrastructures through the vast network of traffic cameras and security cameras installed throughout the city. In addition, the cameras can offer power and communication network connections to the sensors as the cameras are often connected to the power grid.
[Transportation] provides visual reports and confirmations from the roads before, during and after an event of flooding. [Healthcare] on the other hand provide warning and alerts when contamination is detected. This enables the water system to issue commands to the relevant sensors to have a closer monitoring of the water quality.
Similarly, the data collected from the sensors also contribute to the above-mentioned domains. Water quality data from the sensors can inform [Healthcare] whether the water source is contaminated or not where it can issue investigations or warnings to the public. One example is the operation of restaurants: In the event where the water supply is contaminated, [Healthcare] can issue warning to the restaurants that their water source contaminated, so that the restaurants can take precautions and ensure the safety of their food. Also, the public can be notified of the situation which will prevent potential food poisoning.
[Transportation] will be able to divert their travel routes in the event of flooding from the monitoring data from the sensors. Roads that are flooded can be indentified in real-time so that [Transportation] can efficiently close down the flood roads and plan alternative routes for the ongoing traffic. This is especially important during evacuation of the city.
[Security] can receive information if the location is about to be inundated. This allows pro-reactions to protect the security systems from damage when the flood occurs.
Another domain of a smart city that is closely related to the smart water management is the [Energy] domain. As the sensors requires constant power supply to provide real-time constant monitoring, aligning the planning of sensors of the smart water management with the [Energy] infrastructure facilitates the operation of the sensors and help to eliminate the problem of power issues of the sensors. Similarly, the smart water sensors can share the same communication network system.
6
Future Directions
It has been seen that Edge Computing and Blockchain technology will be the next wave of technology in the implementation of SWM.
backhaul traffic to the central repository (data center or cloud). An example is the monitoring of a dam. Most of the data collected is data that confirms the systems are working properly. Such data does not require it to be send over the network urgently. Edge computing allows this data to be compiled where daily reports are sent to the data center or cloud, thus reducing the transfer load by only sending important data over the network. Edge computing also help to reduce latency because data does not have to traverse over a network to a data center or cloud for processing. This is especially true for water sensors where water data are recorded at small time intervals continuously 24/7.
Blockchain on the other hand can be used to track the water usage from the consumer which is essential the water balance in the city water system. It creates a database that works like Goggle Docs where it is constantly updated and available to all involved parties at all time in real time. This enables all involved parties to have access and knowledge to when and how much water is consumed where then water trading can be made and finalised in real time in a virtual marketplace. This concept will also work for trading between two different domains like energy and water where in the scenario of excess on-site energy generation, the excess energy can be “traded” to the water treatment systems instead of waiting until night when the energy is more expensive.
With the combination of Blockchain technology to proved security and transparency and edge computing reducing backhaul traffic to the central repository, water utilities will be able to implement smart water sensors that are more efficient and accurate for their water systems.
References
Anzaldi, G. (2014). A Holistic ICT Solution to Improve Matching between Supply and Demand over the Water Supply Distribution Chain. J. sustain. dev. energy water environ. syst , 2 (4), 362-375.
Carlisle, D. (2010, April). graphicx: Enhanced support for graphics. Retrieved from http://www.ctan.org/tex-archive/ help/Catalogue/entries/graphicx.html
Choi, G. W., Chong, K. Y., Kim, S. J., & Ryu, T. S. (2016). SWMI: new paradigm of water resources management for SDGs. Smart Water (1:3).
Gourbesville, P. (2011). ICT for Water Efficiency. Intech , 411-426.
Gungor, V. C., Sahin, D., Kocak, T., Ergüt, S., Buccella, C., Cecati, C., et al. (2011). Smart grid technologies: Communication Technologies and Standards. IEEE transactions on Industrial informatics , 7 (4), 529-539.
Ho, Q.-D., Gao, Y., Rajalingham, G., & Le-Ngoc, T. (2014). Wireless Communications Networks for the Smart Grid. Springer.
Parikh, P. P., Kanabar, M. G., & Sidhu, T. S. (2010). Opportunities and Challenges of Wireless Communication Technologies for Smart Grid Applications. IEEE Power and Energy Society General Meeting , pp. 1-7.