Extracting value from complex high-frequency
multivariate water quality data:
exploring routinely collected operational data
Josie Ashe
1, Emilie Grand-Clement
2,3, David Smith
3, Richard E. Brazier
2,
Dragan A. Savic
11 Centre for Water Systems, College of Engineering, Mathematics and Physical Sciences, Harrison
Building, University of Exeter, EX4 4QF, United Kingdom
2 Geography, College of Life and Environmental Sciences, Amory Building, Rennes Drive, University
of Exeter, EX4 4RJ, United Kingdom
3 South West Water, Rydon Lane, Exeter, Devon, EX2 7HR, United Kingdom
Abstract
Drinking water treatment works are increasingly placed under external stressors including climatic variability, land use and management, and pollution incidents. Routine high-frequency water quality monitoring is an integral part of operational control and is used to inform the treatment process and support the identification of risks. However, in order to improve decision making using the complex, time-series of water quality data that are generated (and typically archived), there must be distinction between basic sensor errors, artefacts of system design and management, and process driven patterns. This paper explores these complex data in order to support synthesis of uncleaned (or raw), high-frequency data; extracting information value from routine catchment wide monitoring. The data are presented in a form that enhances the capability and capacity to utilise existing complex data; improves understanding of complex surface water systems; and helps facilitate data driven models to investigate and forecast the dynamics between water quality determinands during hard-to-treat spate (or rainfall-runoff) events.
Keywords: water quality; high-frequency monitoring; information value; multivariate.
1
Introduction
The problems of a ‘data rich, information poor’ approach to water quality monitoring are well established [1–3]. Despite increasing investment in remote and in-line water quality monitoring in catchments and for the protection and operation of drinking water treatment works (WTW), and despite
Engineering Volume 3, 2018, Pages 103–110
the objectives of reducing cost, reducing risk and increasing resilience, the potential value contained within routinely collected high-frequency water quality data is rarely realised. However, in order to extract valuable information from these complex data and build understanding from the knowledge gained through catchment wide monitoring, the data must first be thoroughly explored and audited. This approach raises questions on monitoring design, the impacts of operation priorities on data, the use of metadata, data presentation and visualisation, and interdisciplinary integration. Furthermore, with the advent of big data in a contemporary sense (routine monitoring generating volumes of data beyond the human processing capacity), and with the challenge of reconciling the communication of these complex data with the needs of decision makers [4], it is suggested in this paper and subsequent research that these questions should also recognise that we are currently ‘knowledge rich, but understanding poor’.
Through a case study in the UK, this paper presents an approach to data exploration and visualisation to support the utilisation of existing and routinely collected high-frequency water quality data. This work facilitates further research in data-mining of existing water quality data; informs data-driven water quality modelling; and enhances the capability and capacity to utilise existing data to inform operational and strategic decisions, both in the short- and long-term.
1.2 Case study: water quality dynamics in river spate at treatment works
In the UK changes in land management, climatic conditions, acid deposition and emerging pollutants all contribute towards increasing occurrences of rainfall-runoff events where the chemical and physical response of the river in spate leads to increased pollution, but also to hard-to-treat ‘events’ at WTW’s. One such trend observed in areas of the UK supplied by upland catchments with organic-rich peat soils is the increasing concentration [5] and the changing nature and treatability [6,7] of dissolved organic carbon (DOC). When present during treatment, DOC can affect the coagulation process and thereby coagulant demand [8] and, where disinfection by chlorination is used, chlorine demand and subsequently the production of disinfection by-products [9,10]. Water companies must ensure the cost-efficient provision of clean and wholesome drinking water (while minimising disinfection by-products [11]), therefore, if the concentration of DOC (and the related trihalomethane formation potential) in source water is elevated, this must be reduced through the drinking water treatment process [12].
When WTWs are placed under additional stressors such as population increase or extreme weather events, there is an escalation in the levels of treatment used in order to protect supply. While this escalation mitigates the risk of regulatory exceedance, it almost invariably increases the cost of treatment, and increases the risk of demand not being met (due to works shutdown). This highlights the need to understand changes in the dynamics of the relationships between water quality determinands in raw source water both during and following elevated flow conditions.
2
Material and methods
2.1
Data sources
The data sources investigated throughout the development of this approach cover calendar years 2014 through to 2016 and were selected to represent a range of available routine monitoring data for an anonymised drinking water treatment works, including: water company operational and regulatory monitoring regimes, UK Environment Agency flood-risk monitoring, and ongoing partnership monitoring of a range of catchment interventions related to upstream water storage and quality. Throughout this paper data are differentiated as: (1) ‘spot samples’, representing selected weekly or monthly manual water quality grab samples of raw water at the water treatment works, taken under normal operating conditions; (2) Intake Protection Monitoring in the river (‘IPM’), and (3) raw river water entering the works (‘raw water’), comprising records at 5 minute intervals of continuous signal from in-line sensors monitored for operational purposes; (4) flow (m3 s-1) from the UK Environment
Agency (EA) flood-risk monitoring (calculated by the EA from 15 min stage records); and (5) sub-hourly rainfall (mm) in a headwater sub-catchment.
2.2
Data audit
In order to extract meaningful and valuable information from these data there must be a distinction between basic sensor errors, system design, signal artefacts within data, and process driven patterns. Due to the complexity of the sensor, signal and system design influences on these data, extensive manual and automated data audits are required to establish the prevalence of factors such as: timestamp anomalies, missing data, zero values, data under detection limits, data flat lines, data beyond the physically limited minimum and maximum boundaries, outliers, sensor drift (e.g. though biofouling), and other unexpected data variance. In addition to the use of basic statistical tests and manual checks, these data were explored using multivariate analysis and data visualisation. The data audit process utilises bolt on ‘modules’ of script in R to facilitate proof-of-concept and rolling development at different phases of data audit complexity. For example, in the data presented in this paper local outliers were identified using a simple 3σ edit rule on a moving 2 hour window. A randomly generated selection of automatically identified flags were manually checked.
2.3
Exploratory analysis: determinands, time series and events
The analytical approaches explored though this case study include:
Characterising data: exploring signal complexity and artefacts, ensuring data are ‘statistically fit for purpose’. Principal Components Analysis (PCA) was undertaken on normalised data (z transformation) for colour, conductivity, pH and turbidity at the IPM; data outside sensor or physical limitations, local outliers, and missing data were omitted (listwise deletion) from the analysis.
Event identification and extraction: automated event classification using base flow separation [13] and threshold values for rainfall and runoff [14].
3
Results and discussion
3.1
Summary of data characterisation
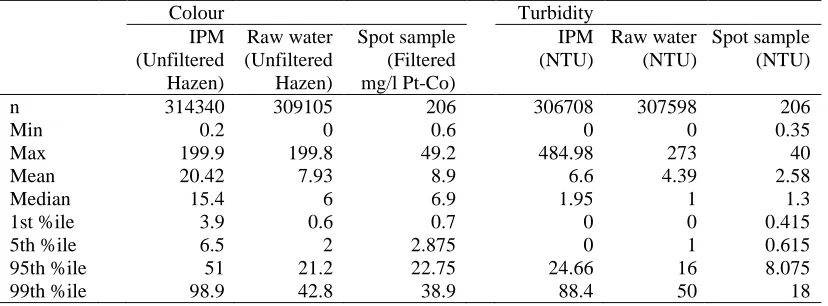
Summary statistics for the three time-series of water quality parameters (IPM, raw water and spot samples) following simple manual and statistical cleaning are provided in Table 1.
The dynamic responses for each water quality determinand in relation to high flow events are displayed in Fig. 1. Under high flow conditions river water at the intake and raw water at the works increases in acidity, concentrations of colour and turbidity are elevated, and conductivity decreases. Although an investigation into the processes resulting in the changes to colour and turbidity recorded (e.g. process driven change in composition of suspended solids and dissolved organic matter) does not fall within the scope of this paper, the recorded values are consistent with: flushing of upper soil horizons, in particular across the shallow organic rich peaty soils of the headwater catchments [7,16–18]; contamination of surface runoff as a result of cultivation /tillage [19]; and point and diffuse sources of organic waste (primarily agricultural) [19]. These are all considered potential sources of contamination with respect to known land use/management in the catchment, and ongoing upstream catchment investigations and interventions.
Different representations of the water quality dynamics through the two signal sources and the manual sampling across the full sequence of dates are identifiable; in the time series plots (Fig. 1), the simple data exploration visualisation including concentration duration curves for colour and turbidity, and the Q-Q plots exploding the degree of normality (Fig. 2) of these data.
Using water quality parameters for the IPM, the first principal component (PC1) accounts for 58.9% of the variance in the data, with an extracted Eigenvalue of 2.32 and factor loading for colour (0.563), turbidity (0.549), pH ( 0.420) and conductivity ( 0.542). Inclusion of the second principal component (PC2) accounts for 82.4% overall variation in these data. The effect of PC2 is considered as the Eigenvalue lies between 0.9 and 1, and it falls at the inflection point of the scree plot [20]. From the time series plots, concentration duration curves, boxplots and PCA, the four water quality determinands were divided into two groups based on their response to high flow events: colour and turbidity; and conductivity and pH. Of these, one group (colour and turbidity), are examined further here.
Table 1. Summary statistics (following basic phase in the data audit)
Colour Turbidity
IPM Raw water Spot sample IPM Raw water Spot sample (Unfiltered
Hazen)
(Unfiltered Hazen)
(Filtered mg/l Pt-Co)
(NTU) (NTU) (NTU)
n 314340 309105 206 306708 307598 206
Min 0.2 0 0.6 0 0 0.35
Max 199.9 199.8 49.2 484.98 273 40
Mean 20.42 7.93 8.9 6.6 4.39 2.58
Median 15.4 6 6.9 1.95 1 1.3
1st %ile 3.9 0.6 0.7 0 0 0.415
5th %ile 6.5 2 2.875 0 1 0.615
95th %ile 51 21.2 22.75 24.66 16 8.075
Figure 1 Timeseries plotting 5 minute signal for intake protection monitoring in the river (IPM) and 5 minute for signal raw water at the water treatment works, along with selected manual spot samples of raw water. Demonstrating dynamics for a range of streamflow conditions captured for different sampling/monitoring routines and variability in signal across parameters (colour, conductivity, pH and turbidity) following a basic data
audit.
There is a notable difference in the distributions for colour covered by the IPM and the raw water at the works (both for high resolution signal and manual spot samples). Visual inspection supports the identification of irregular signal artefacts in the IPM signal recorded, which are attributed to signal drift and biofouling, with corrections applied (cleaning and recalibration) at an operationally determined value (<50 Hazens).
Figure 2 Q-Q plots exploration of degree of normality for (a) 5 minute signal data from the intake protection monitoring of river water; (b) 5 minute signal data raw water going into the water treatment works; and (c) for selected manual spot samples of raw water going into the water treatment works (sampling frequency varies from
daily to fortnightly).
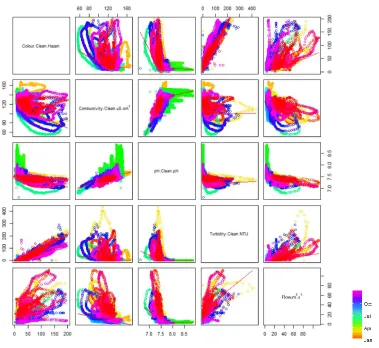
Exploration of seasonal variation in parameter correlation and hysteresis in relationships during high flow events using scaling by timestamp on simple pairwise plots (fig. 3) illustrate how, through simple visualisation, the dynamics of the parameter relationships on seasonal and event scales can be identified in the structure despite the sensor drift artefacts identified.
3.2
Event detection and separation
Event separation [14] applied to the hydrometric time series (fig. 4) for the three year period (calendar years 2014 - 2016) extracted 165 events.
3.3
Investigation of data structures across events
Figure 3. Pairwise plots for water quality parameters 5 minute signal data from the intake protection monitoring of river water, and 15 minute reported flow.
Figure 5. Despite the differences in sensors and monitoring location, detailed hysteresis structure information is captured within both IPM and raw water signal (a) time series for flow, colour and turbidity for an event on 15
January 2015 (b) hysteresis loop for this event (raw water at works)
the turbidity signal peak (with a lag ranging from 15 minutes to 9 hours 30 minutes); 24 events record the peaks occurring in the same 15 minute interval; and 29 events record the turbidity signal peak lagging behind the colour signal peak. The dynamics of relationships between parameters during spate and in the 48 hours following peak flow is demonstrated by parameter hysteresis for the events identified (fig. 5).
4
Conclusions
Despite the prevalence of signal errors and unexpected structure in the existing high-frequency data, it is possible using simple auditing to extract information on potentially contributing factors to hard-to-treat events. Demonstrating that this information is captured, and that it can be extracted, is the first step towards assessing the value of these complex data. Ongoing research into data-mining, and the identification and analysis of patterns in existing and routinely water quality time-series, will deliver improved understanding of how changing system dynamics affect drinking water treatment efficiency
and effectiveness (i.e. resulting in higher process costs, or in operational or regulatory exceedances at works, through distribution systems, or at the end user). This has the potential to enhance the capability and capacity of the water industry to utilise existing data and knowledge, improving understanding in order to protect supply.
Acknowledgements.
This research is funded by the Water Informatics Sciences and Engineering (WISE) CDT EPSRC grant reference EP/L016214/1. The authors would also like to thank South West Water for data, site access and discussions.References
[1] R.C. Ward, J.C. Loftis, G.B. McBride, The “data-rich but information-poor” syndrome in water quality monitoring, Environ. Manage. 10 (1986) 291–297. doi:10.1007/BF01867251.
[2] J.G. Timmerman, E. Beinat, K. Termeer, W. Cofino, Analyzing the data-rich-but-information-poor syndrome in dutch water management in historical perspective, Environ. Manage. 45 (2010) 1231–1242. doi:10.1007/s00267-010-9459-5. [3] N.B. Harmancioglu, N. Alpaslan, Water quality monitoring network design: a problem of multi-objective decision
making, J. Am. Water Resour. Assoc. 28 (1992) 179–192. doi:10.1111/j.1752-1688.1992.tb03163.x.
[4] E.C. McNie, Reconciling the supply of scientific information with user demands: an analysis of the problem and review of the literature, Environ. Sci. Policy. 10 (2007) 17–38. doi:10.1016/j.envsci.2006.10.004.
[5] F. Worrall, T. Burt, Time series analysis of long-term river dissolved organic carbon records, Hydrol. Process. 18 (2004) 893–911. doi:10.1002/hyp.1321.
[6] J.P. Ritson, N.J.D. Graham, M.R. Templeton, J.M. Clark, R. Gough, C. Freeman, The impact of climate change on the treatability of dissolved organic matter (DOM) in upland water supplies: a UK perspective., Sci. Total Environ. 473–474 (2014) 714–30. doi:10.1016/j.scitotenv.2013.12.095.
[7] J.P. Ritson, M. Bell, N.J.D. Graham, M.R. Templeton, R.E. Brazier, A. Verhoef, C. Freeman, J.M. Clark, Simulated climate change impact on summer dissolved organic carbon release from peat and surface vegetation: Implications for drinking water treatment, Water Res. 67 (2014) 66–76. doi:10.1016/j.watres.2014.09.015.
[8] J.K. Edzwald, Coagulation in Drinking Water Treatment: Particles, Organics and Coagulants, Water Sci. Technol. 27 (1993).
[9] S.E. Hrudey, Chlorination disinfection by-products, public health risk tradeoffs and me, Water Res. 43 (2009) 2057– 2092. doi:10.1016/J.WATRES.2009.02.011.
[10] P.C. Singer, Control of Disinfection By‐Products in Drinking Water, J. Environ. Eng. 120 (1994) 727–744. doi:10.1061/(ASCE)0733-9372(1994)120:4(727).
[11] The Water Supply (Water Quality) Regulations SI 2016 No. 614, 2016.
http://www.legislation.gov.uk/uksi/2016/614/pdfs/uksi_20160614_en.pdf (accessed October 27, 2017).
[12] DWI, DWI PR14 Guidance - Disinfection By-Products, 2010 (2012) 2–4. http://dwi.defra.gov.uk/stakeholders/price-review-process/PR14-guidance-dpb.pdf (accessed October 27, 2017).
[13] R.J. Nathan, T.A. McMahon, Evaluation of automated techniques for base flow and recession analyses, Water Resour. Res. 26 (1990) 1465–1473. doi:10.1029/WR026i007p01465.
[14] D. Luscombe, Understanding the ecohydrology of shallow, drained and marginal blanket peatlands, PhD Thesis, University of Exeter, 2014.
[15] C.E.M. Lloyd, J.E. Freer, A.L. Collins, P.J. Johnes, J.I. Jones, Methods for detecting change in hydrochemical time series in response to targeted pollutant mitigation in river catchments, J. Hydrol. 514 (2014) 297–312.
doi:10.1016/j.jhydrol.2014.04.036.
[16] F. Worrall, T.P. Burt, R.Y. Jaeban, J. Warburton, R. Shedden, Release of dissolved organic carbon from upland peat, Hydrol. Process. 16 (2002) 3487–3504. doi:10.1002/hyp.1111.
[17] E. Grand-Clement, D.J. Luscombe, K. Anderson, N. Gatis, P. Benaud, R.E. Brazier, Antecedent conditions control carbon loss and downstream water quality from shallow, damaged peatlands, Sci. Total Environ. 493 (2014) 961–973. doi:10.1016/j.scitotenv.2014.06.091.
[18] F. Worrall, H.S. Gibson, T.P. Burt, Production vs. solubility in controlling runoff of DOC from peat soils – The use of an event analysis, J. Hydrol. 358 (2008) 84–95. doi:10.1016/j.jhydrol.2008.05.037.
[19] H. Zia, N.R. Harris, G. V. Merrett, M. Rivers, N. Coles, The impact of agricultural activities on water quality: A case for collaborative catchment-scale management using integrated wireless sensor networks, Comput. Electron. Agric. 96 (2013) 126–138. doi:10.1016/j.compag.2013.05.001.