Development of a system
dynamics computer
model for the simulation of the effects of an
alternate water source development project on the
water supply systems management and customer
satisfaction
Suwan Park1* and Jae-Hong Ha1
1Dept. of Civil Eng., Pusan National University, Republic of Korea
[email protected], [email protected]
Abstract
In this paper, a System Dynamics (SD) computer simulation model was developed to assess the effects of developing and providing an alternate water source on the management of a water supply system and customer satisfaction. A water supply service satisfaction index was also developed to estimate the level of overall customer satisfaction on water supply service. Data from the Busan water supply authority and the Korea Development Institute regarding the Nakdong riverbank filtration development were utilized for the construction of the model. Major managerial indicators of the system under study were analyzed by the simulations of the model that incorporates the development of the alternate water source for Busan. The developed SD model and the water service index may be further utilized as a tool that can assess the extent and timing of an additional service improvement project.
1
Introduction
The development of alternative water sources in the water supply system refers to the development of new water sources to supplement or replace the existing water
Volume 3, 2018, Pages 1608–1615
HIC 2018. 13th International Conference on Hydroinformatics
sources for the purpose of solving water quality or quantity problems of the existing water source and improving the water consumption satisfaction of the water consumers. Considering the cost of development of alternative water source and its effect on waterworks management and consumers, it is necessary to quantitatively evaluate the effects of an alternative water resource development project and to predict the satisfaction of the water consumers on the water supply service utilizing the new water source.
In this study, the effects of alternative water source development are evaluated by supplementing and expanding the System Dynamics (SD) computer simulation model developed for the simulation of the waterworks business by Park(2010). The data in KDI(2012) regarding the Nakdong riverbank filtration project feasibility study were used for the SD model developed in this study. Using the model long-term operational condition of Busan metropolitan city waterworks in South Korea was predicted in case Nakdong riverbank filtered water is supplied to Busan Metropolitan City. In addition, an index to quantify the overall satisfaction of the water supply service was developed and included in the SD modelling of this study.
2
The Method
The System Dynamics Methodology developed by Forrester (1961) is a simulation methodology based on systems theory. It deals with the interpretation of the dynamic nature of systems in which information and material feedbacks are present. The methodology can facilitate understanding of a system by extracting structures essential to its working mechanisms, and, based on an analysis of feedback structures inherent to the system, lead to development of efficient management strategies.
Computer simulation models that are developed based on a system dynamics methodology are composed of four basic components: stocks, flows, converters, and interrelations among them, which are graphically represented as arrows and mathematically modelled as the finite difference equations. The value of each component is calculated at each delta time (DT) for a specified simulation time period defined in a model, starting at the initial values of the stocks, and based on the functional relations among components. Computer simulation experiments using a system dynamics methodology are realized using object-oriented modelling software such as Vensim, Powersim Studio, AnyLogic, STELLA, etc.
* Corresponding author
3 Description of the SD model
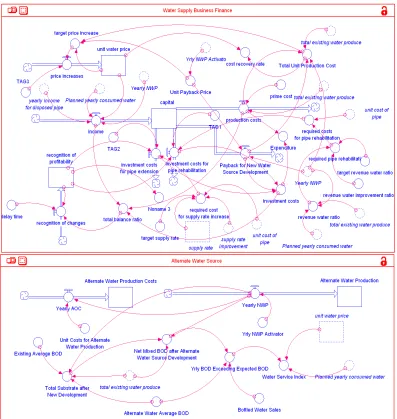
In this study, an SD computer simulation model that is consisted of Water Supply, Pipe Maintenance, Water Supply Business Finance, and Alternate Water Source sub-model was developed by modifying, supplementing, and expanding the SD sub-model of Park(2010). Figure 2 shows the Water Supply Business Finance and Alternate Water Source sub-models developed in this study in the form of stock/flow diagram (storage and flow variable diagram) using a SD modelling software STELLA.
The assumptions for modelling are as follows. First, the beginning year of the simulation is 1999 and the modelling period is 60 years. Second, assuming that the water production of the entire project is kept constant, the water production of the existing water treatment plant is reduced by the amount of water production from the alternative water source. Third, the increase rate of water production cost in the alternative water source is equal to the increase rate of existing water production unit price. Fourth, water quality of alternative water source is assumed to be the first grade,
which is 1,000 mg/m3. Fifth, the amount of water supplied from the new water source,
which is Nakdong riverbank filtered water, to Busan will be 226,300,000 m3/yr
according to KDI(2012). The development period of riverside filtration is from 2011 to 2017, and the supply of riverside filtration water will be initiated in 2018.
The input data required to run the SD model are the initial values of the stock variables and the values or the time trend line of the external variables (exogenous variables). The initial values of the SD model of this study was obtained from Busan Water Supply Authority (2000).
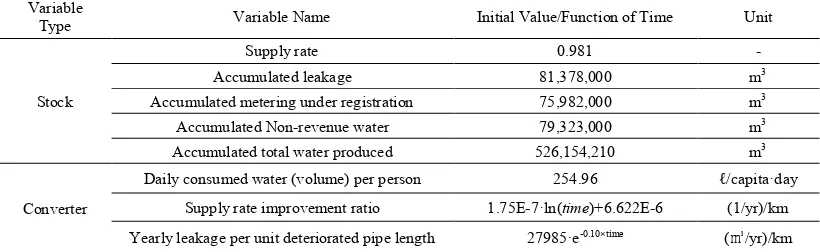
An external variable is a variable that operates independently from outside the system regardless of the operating mechanism of the system outside the system. Time trend lines or average values obtained from the historical data were used for the external variables of the model. When necessary they were estimated by trial and error during the model verification processes. As an example Table 1 shows the stock and exogenous variables in the Alternate Water Source Sector of the developed SD model. Eq. (1) represents the water service satisfaction index (WSSI), which is an index that quantitatively estimates the perception and satisfaction of the consumers on supplied water, developed in this study.
(1)
In Eq. (1) Yearly BEED represents ‘Yearly BOD Exceeding Expected BOD’ which
was calculated using Eq. (2).
(2)
In Eq. (2) BWS represents ‘Bottled Water Sales’ and FGWQ ‘First Grade Water
/yr) (m )
($/m
(mg/yr)
(mg/$) 3 3
med Water arly Consu Planned Ye Price Unit Water B Yearly BEE WSSI × = )) (mg/m ) (mg/m ( /yr) (m
(mg/yr) BWS 3 Net Mixed BOD 3 FGWQ 3
B
Yearly BEE = ×
Quality’ for which 1,000 mg/m3 was used.
Figure 1: A causal diagram and the corresponding stock-and-flow model using STELLA
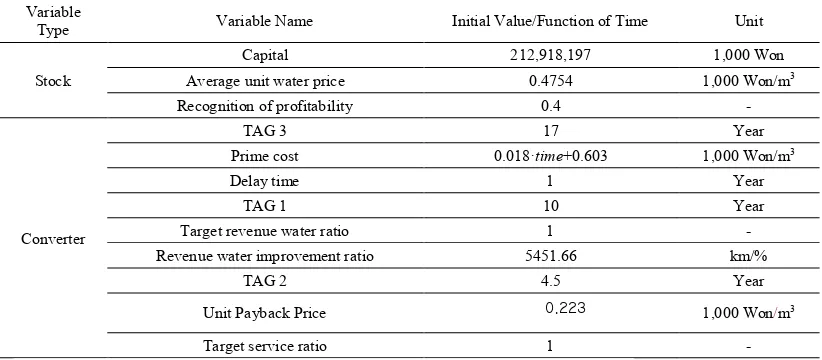
Table 1 ~ Table 4 show the initial values of the stock variables and the values or
trend equations of the exogenous variables used for the developed Water Supply, Pipe Maintenance, Alternate Water Source and Water Supply Business Finance Sector SD model. The initial values were obtained from [4] and the values or trend equations of the exogenous variables were established based on the statistics reported in [4].
Variable
Type Variable Name Initial Value/Function of Time Unit
Stock
Supply rate 0.981 -
Accumulated leakage 81,378,000 m3
Accumulated metering under registration 75,982,000 m3
Accumulated Non-revenue water 79,323,000 m3
Accumulated total water produced 526,154,210 m3
Converter
Daily consumed water (volume) per person 254.96 ℓ/capita·day Supply rate improvement ratio 1.75E-7·ln(time)+6.622E-6 (1/yr)/km
Yearly leakage per unit deteriorated pipe length 27985·e-0.10×time (㎥/yr)/km Table 1: Stock and exogenous variables of the Water Supply Sector
Variable
Type Variable Name Initial Value/Function of Time Unit
Stock
Non-deteriorated lengths 5504.2 km
Deteriorated lengths 2963.8 km
Accumulated disposed pipe 84.68 km
Converter
Unit cost of pipe rehabilitation 53548·time0.524 1,000
Won/km Deterioration rate of non-deteriorated pipe If time≤ 5 then 0.075 else 0.03 1/year
Unit cost of service expansion 8176.47·ln(time)+113965.34 Won/km 1,000
Disposal rate of non-deteriorated pipe If time≤then 0.010 else 0.004 5 then 0.07 else if time > 13 1/year
Disposal rate of deteriorated pipe If time≤ 5 then 0.03 else 0.01 1/year
Income per unit disposed pipe 200 Won/km 1,000
Table 2: Stock and exogenous variables of the Pipe Maintenance Sector
Variable
Type Variable Name Initial Value/Function of Time Unit
Stock Alternate Water Production Costs 0 1,000 Won
Alternate Water Production 0 m3
Converter
Existing Average BOD -256.20·ln(time)+2635.62 mg/m3
Unit Costs for Alternate Water Production 0.0491 1,000 Won/m3
Alternate Water Average BOD 1000 mg/m3
Bottled Water Sales
if time≤ 5 then -6077.2·time2 +
53225·time + 54555 else 101425·ln(time) - 5971
m3/yr
Table 3: Stock and exogenous variables of the Alternate Water Source Sector
Variable
Type Variable Name Initial Value/Function of Time Unit
Stock
Capital 212,918,197 1,000 Won
Average unit water price 0.4754 1,000 Won/m3
Recognition of profitability 0.4 -
Converter
TAG 3 17 Year
Prime cost 0.018·time+0.603 1,000 Won/m3
Delay time 1 Year
TAG 1 10 Year
Target revenue water ratio 1 -
Revenue water improvement ratio 5451.66 km/%
TAG 2 4.5 Year
Unit Payback Price 0.223 1,000 Won/m3
Target service ratio 1 -
Table 4: Stock and exogenous variables of the Water Supply Business Finance Sector
4
Results of the Model Simulations
The results of the simulation were compared to the case of ‘No Alternate Water Source Development’. These model simulations results are shown in Figure 2 and Figure 3. Figure 2 shows the results of the various simulation scenarios regarding the water rate in Busan. The curve number ‘1’ represents the expected changes in the water rate for the case of ‘No Alternate Water Source Development’, 2’ the case of ‘Alternate Water Source Development’ with the reduction of water production in the existing water treatment facility in Busan as much as the volume of the developed alternate water source production, ‘3’ the case of ‘Alternate Water Source Development’ with the reduction of water production in the existing water treatment facility in Busan as much as 50% of the volume of the developed alternate water source production, ‘4’ the case of ‘Alternate Water Source Development’ without any reduction of water production in the existing water treatment facility in Busan, respectively.
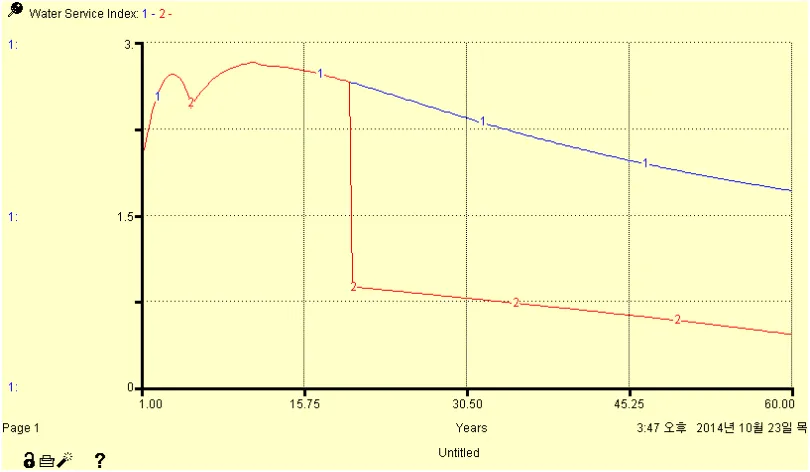
Figure 3 shows the results of the simulation scenarios regarding the water service satisfaction index(WSSI) in Busan. For ‘Alternate Water Source Development’ case, which is the curve number ‘2’, is due to the supply of cleaner water and the reduction of ‘Yearly BOD Exceeding Expected BOD’. The WSSI is improved continuously after the ‘Alternate Water Source Development’ due to the prediction of gradual fall of the population in Busan.
Figure 2: Simulation results of the unit water price.
Figure 3: Simulation results of the water service index
5
Conclusions
In this paper, a system dynamics computer simulation model was developed to simulate the long - term effects of alternative water source development on the water supply business. The developed model was applied to the Nakdong riverbank filtration development project planned to be supplied to Busan Metropolitan City in South Korea. The model predicted that the water service satisfaction index will be greatly improved immediately after the supply of the alternative water source and will gradually improve even after the immediate improvement. In addition, it was predicted that if water supply of alternative water source is supplied, water production cost will be decreased enabling more investment for replacing the deteriorated pipes. The developed model is expected to provide the managers of waterworks with a useful tool by which the status of the water supply system and the customer satisfaction can be estimated and predicted. The developed SD model and the water service index may be further utilized as a tool that can assess the extent and timing of an additional service improvement project.
References
Park, S., Kim, K., Kim, B. J., Lim, K. (2010). Development of a System Dynamics Model to Support the Decision Making Process in the Operation and Management of Water Supply Systems, J. Korea Water Resour. Assoc., 43 (pp. 609-623).
Korea Development Institute (KDI) (2012). Feasibility Re-investigation Report for Nak-Dong Riverbank Storage Water Development Project, Public and Private Infrastructure Investment Management Center, Korea Development Institute, Seoul,.
J. W. Forrester (1961). Industrial dynamics, Pegasus Communications, Waltham,
MA,.
Busan Water Supply Authority (2000). 1999 Statistics on Water Supply Services. Busan, Republic of Korea.