R E S E A R C H A R T I C L E
Open Access
Mixed-strain housing for female C57BL/6,
DBA/2, and BALB/c mice: validating a
split-plot design that promotes refinement
and reduction
Michael Walker
1, Carole Fureix
1, Rupert Palme
2, Jonathan A. Newman
3, Jamie Ahloy Dallaire
1and Georgia Mason
1*Abstract
Background:Inefficient experimental designs are common in animal-based biomedical research, wasting resources
and potentially leading to unreplicable results. Here we illustrate the intrinsic statistical power of split-plot designs, wherein three or more sub-units (e.g. individual subjects) differing in a variable of interest (e.g. genotype) share an experimental unit (e.g. a cage or litter) to which a treatment is applied (e.g. a drug, diet, or cage manipulation). We also empirically validate one example of such a design, mixing different mouse strains–C57BL/6, DBA/2, and BALB/c–within cages varying in degree of enrichment. As well as boosting statistical power, no other manipulations are needed for individual identification if co-housed strains are differentially pigmented, so also sparing mice from stressful marking procedures.
Methods:The validation involved housing 240 females from weaning to 5 months of age in single- or
mixed-strain trios, in cages allocated to enriched or standard treatments. Mice were screened for a range of 26 commonly-measured behavioural, physiological and haematological variables.
Results:Living in mixed-strain trios did not compromise mouse welfare (assessed via corticosterone metabolite output, stereotypic behaviour, signs of aggression, and other variables). It also did not alter the direction or magnitude of any strain- or enrichment-typical difference across the 26 measured variables, or increase variance in the data: indeed variance was significantly decreased by mixed- strain housing. Furthermore, using Monte Carlo simulations to quantify the statistical power benefits of this approach over a conventional design
demonstrated that for our effect sizes, the split- plot design would require significantly fewer mice (under half in most cases) to achieve a power of 80 %.
Conclusions:Mixed-strain housing allows several strains to be tested at once, and potentially refines traditional marking practices for research mice. Furthermore, it dramatically illustrates the enhanced statistical power of split-plot designs, allowing many fewer animals to be used. More powerful designs can also increase the chances of replicable findings, and increase the ability of small-scale studies to yield significant results. Using mixed-strain housing for female C57BL/6, DBA/2 and BALB/c mice is therefore an effective, efficient way to promote both refinement and the reduction of animal-use in research.
Keywords:Mice, Refinement, Reduction, Animal Welfare, Experimental Design, Split-Plot
* Correspondence:[email protected]
1Animal Biosciences, University of Guelph, Guelph, ON N1G 2 W1, Canada Full list of author information is available at the end of the article
Background
The 3Rs of refinement, reduction and replacement [1] are widely recommended guidelines for laboratory animal research, which biologists worldwide have to comply with for ethical review purposes (e.g. [2, 3]). Refinements, methods that minimize animal distress, are developed and applied to reduce welfare costs to individual ani-mals (e.g. [4]). Reductions in animal numbers can be achieved by using replacement technologies (e.g. [5]), or, instead, by using more efficient experimental de-signs (e.g. [6]). Despite this fact, a recent survey found that over 33 % of animal-based studies use inefficient ex-perimental designs [6]. Split-plot designs exemplify how statistical power and efficiency could be increased, so po-tentially permitting the use of fewer subjects [7, 8]. Here, individual subjects (‘sub-units’) differing in a variable of interest (e.g. in genotype, health status, or individual-level treatment) share an experimental unit (e.g. a cage, mother or litter) to which a treatment is applied (e.g. a drug, diet, or environmental enrichment). How such designs in-crease the inherent statistical power gained from a given number of animals is detailed below. Such designs are as yet in little used biomedical research, despite their benefits.
We chose to empirically investigate the potential value of split-plot designs by housing mice of varied genotypes (strains) together within enriched or non-enriched cages. Using multiple mouse strains is useful for increasing a
study’s external validity: how well results generalize to
other environmental contexts, populations or species [9]. High external validity is essential for efficient, useful re-search, especially given the translational nature of many ro-dent studies. Working with multiple strains is one way to achieve this [10], because strains show well-documented differences in numerous behavioural and physiological phenotypes (e.g. [11–13]): variation ideal for testing the robustness and generalizability of phenomena under study [14]. Using different strains may also reveal valu-able insights into how any treatment effects interact with genotype (e.g. [15]). Conventionally, researchers using mul-tiple strains to reap these benefits would house them all in single-strain cages, like genotypes with like. The different strains would then be either tested sequentially in separate studies, or better, studied in parallel in a factorial design.
Mixed-strain housing, in contrast, in which individuals from different strains are instead caged together, yields all the advantages of testing multiple strains, but in a more statistically efficient way (as long as three or more strains are used). In a mixed-strain housing design, the physical cage is a ‘plot’ that is ‘split’ by including mice from different genotypes (sub-plots) within it (the same way one field [plot] could be ‘split’ by planting different crops within it [sub-plots], e.g. [16]). Why this spilt-plot design is more statistically powerful can be summarized
as follows. One factor affecting an experiment’s power–
its ability to detect effects –is the number of replicates
per treatment group. Due to the lack of independence between mice in a cage, the cage is the independent unit of replication; and if several strains are to be studied, when only one strain is housed per cage (the conventional design), the total number of cages (replicates) must be di-vided between these strains. In contrast, if these strains are mixed within each cage, then each cage provides repli-cation for every strain. This is what yields the split-plot design’s greater statistical power.
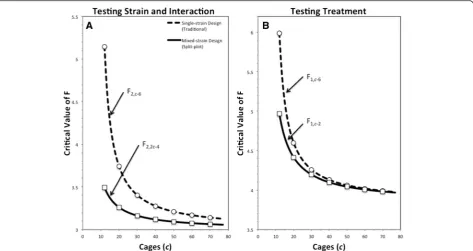
A simple way to more formally compare the inherent relative power of these two types of design, all else being equal, is to compare the size of the critical F- value needed to reject the null hypothesis, as shown in Fig. 1 (with lower critical values obviously representing greater power, because they mean that smaller effects can yield statistical significance). As can be seen in the figure, the mixed-strain design has greater power (lower critical values for F), especially when relatively few cages are used, and particularly for strain and strain*treatment interaction ef-fects. More specifically, the differences between the two competing designs arise from the degrees of freedom asso-ciated with the mean square used to form eachF-ratio’s de-nominator. The single-strain case is a full factorial design [17], where the denominator mean square is the same for allF-ratios: the mean square for cages nested in treatment and strain. Thus when two treatments and three strains are used in a conventional design (as in our case), the de-nominator degrees of freedom is the total number of cages (c) minus six (see Additional file 1 for details). The mixed-strain, split-plot design, in contrast, uses two denominator mean squares: one for testing the treatment effect (some-times called the‘whole- plot error’), one for testing the ef-fects of strain and the strain by treatment interaction (sometimes called the ‘sub-plot error’) [17]. For testing treatment effects, the mean square for the cages nested in treatment term is used as the denominator, and its degrees of freedom would be the number of cages minus two. For testing the effect of strain or the strain by treatment inter-action, the appropriate denominator is the sub-plot error with degrees of freedom equal to two times the number of cages minus four (see Additional file 1 for details). There-fore, all else being equal, the advantage of the split-plot design is that the power to detect effects of the sub-plot (in this case strain) and its interaction with the whole- plot (e.g. enrichment) is greatly increased (particu-larly at smaller sample sizes). The power to detect whole plot effects is also slightly increased (see Fig. 1; see also Additional file 1: Figures S3 & S4).
likely that researchers’results will be statistically signifi-cant (because smaller F-ratios are needed and so smaller effects can be detected: see Additional 1: Figure S3). This can therefore be an excellent way to make the most of small-scale pilot studies, for example. Second, re-searchers can instead choose to use fewer animals, while retaining the same chance of achieving significance for any given effect size (see Additional file 1: Figure S4). This then allows the principle of reduction to be met (as may be especially advisable when treatments or genotypes have adverse effects on animal welfare): our main interest here.
Furthermore, as well as these statistical benefits, if mixed-strain housing involves mice differing in visual appearance (e.g. coat colour; see Additional file 1: Figure S1), this can confer additional advantages. Individual iden-tification is important for providing a link between each subject and the data they generate. However, all common techniques used for this (e.g. ear notching) negatively impact animal welfare, even if only by causing brief pain [18, 19], and some methods can even lead to confounds in some behavioural research (e.g. [20]). Housing differentially pigmented mice together within cages avoids these prob-lems by allowing them to be easily identified without further manipulation [18]. This also facilitates ease of identification in the home cage [18], potentially making cage-side checks faster and more reliable.
Mixed-strain housing thus potentially has many advan-tages over traditional, single-strain housing. Previously, we
performed a successful ‘proof-of-principle’ using two
inbred strains of mice housed together in conventional cages: C57BL/6 (black) and DBA/2 (brown) [18]. Here, we expand upon this by including a third strain, BALB/c (white), as well as an enriched housing condition as a treatment: a common manipulation used in neuroscience and welfare studies. We investigated whether mixed-strain housing modifies the strain-typical phenotypes of the mice, and/or interacts with the effects of enrichment, since this would be problematic. We also assessed whether mixed-strain housing increases the variance in data obtained from the subjects, since this would potentially compromise any statistical power gained through the use of the split-plot design. In addition, we evaluated mouse well-being, to check that co-housing strains created no new welfare concerns. To do this, we housed the three strains in either mixed- or single-strain trios, evenly split across standard or enriched cages (see Additional file 1: Figure S2). 240 female mice were housed in same-strain (60 cages; 20 of each strain) or mixed-strain (20 cages) trios, half of which were enriched,
from 3–5 weeks of age until approximately 5 months of
age. A total of 26 behavioural, physiological, morphological, and haematological variables were measured, chosen to comprehensively assess strain-typical phenotypes, en-richment effects and also animal welfare.
Methods
Animals and housing
240 unrelated female mice were purchased from Charles River Labs at three to five weeks of age. Building upon our previous work co-housing C57BL/6 and DBA/2 fe-males [18], we used 80 mice from each of three strains, C57BL/6, DBA/2, and BALB/c. We chose these for their coat colours and because they are all widely used, com-parable in body weight [21], and similarly sociable [22]. We used females because they are commonly group housed [23], necessitating individual identification, and because females make up a large proportion (approximately 70 %) of the inbred mice sold by Charles River Labs [18].
Upon arrival, mice were randomly divided into either
same-strain (n= 60 total, 20 of each strain) or
mixed-strain (n= 20) trios. Mixed-strain trios consisted of one
mouse of each strain. Mice were also split between two housing treatments: standard and enriched. Standard
housing (SH) consisted of ‘shoebox’cages (12H × 27L ×
16Wcm; Allentown Inc.) furnished with: corncob bedding, Shepherd Enviro-dri© nesting material, a standard size
paper coffee cup, and ad lib. food and water (Harlan®
Teklad Global Diet [14 % protein]). Enriched housing (EH) consisted of typical rat cages (21Hcmx47Lcmx25Wcm) furnished with all the same items as standard housing
plus two running wheels (one stainless steel mesh 5”
upright wheel, Ware Manufacturing Inc.; one plastic mouse igloo &‘fast-trac’wheel combo; Bio Serv®), a black polyvinyl chloride tunnel (10 cm long, 4 cm diameter), a small paper cup, a Nestlet, tissues, a cloth hammock (a roughly 12x12cm piece of a sock attached to the cage lid via cable ties), and a steel mesh elevated platform (5H × 40L × 4Wcm long) to access the water. The cages were arranged on shelves in a randomized complete block design (i.e. each block had 8 cages in a random order: 1 cage of each strain and 1 mixed - strain cage, times two for standard and enriched housing), and were completely cleaned once a week. The room was kept at 21 °C and 48 % relative humidity and was on a 12-h re-verse light schedule (lights out at 10 am). Three days after arrival every mouse was given an injection of Car-profen (5 mg/kg) and 30 min later [24], two mice per trio were ear notched (one left ear, one right ear), while the third mouse underwent a sham notching procedure. Mixed-strain mice were also notched to ensure ear notch-ing was not confounded with Cage Type treatment. Only two mice were notched per group for welfare reasons and in previous work we found no effect of ear notching [18]. For all procedures listed below, mice were handled using either a tunnel if EH or paper cup if SH, from their home cage, in order to minimize the effect of handling [4]. Due to a few instances of malocclusion, severe barbering, and accidental death, our final sample size was 216 mice ar-ranged in the following groups: 8 SH and 9 EH C57BL/6
trios; 9 SH and 9 EH DBA/2 trios; 10 SH and 10 EH BALB/c trios; 9 SH and 8 EH mixed-strain trios.
Home cage time budgets during the active (dark) phase
Home cage observations began when the mice were ap-proximately 3 months old and were conducted in two four-hour blocks per day (12 pm-4 pm; 5 pm-9 pm) during the dark period for 12 days over a two-week period (no observations were done on cage cleaning days). The si-lent observer recorded behaviours once per hour using a mixture of focal (used only for determining whether a behaviour was stereotypic or not) and scan sampling [25], and following a previously determined, well-validated ethogram [26]. For analysis, behaviours were pooled into three categories: normal activity (e.g. locomotion, groom-ing, eating/drinking), inactivity (e.g. standing still, sleeping), and stereotypic behaviour (e.g. route tracing, patterned climbing). Wheel running behaviour was included in the normal activity category. All these behavioural variables were selected to allow comparison with published strain-typical values [11] and for their use in assessing mouse welfare [27].
Novel object test
Long latencies to make contact with a novel object are typically interpreted as reflecting higher levels of anxiety or neophobia [28]. To assess this, we modified a previ-ously determined protocol [18, 29]. Mice were placed in-dividually into a novel arena and allowed to habituate for one minute. Next, a novel object (a plastic golf ball) was placed into the centre of the arena and the latency of each mouse to make contact with their nose or paw was recorded. This procedure was performed in tripli-cate; all mice from one cage were tested at the same time, but in a different arena, and watched by a different observer. Arenas were counterbalanced by observer so that each observer was not always scoring mice in the same arena nor scoring the same strain repeatedly in the mixed-strain cages. Objects and arenas were cleaned be-tween every trial to remove any odour cues. The max-imum allowed duration was 5 min; any mouse making no contact was given the maximum score (300 s). The test was run over two days, and there was no effect of day on the outcome (F1,70= 0.10,p= 0.75).
Startle response test
and then were played a sharp auditory tone (115 dB for 40 ms). The force generated by each mouse immediately prior to the tone was recorded (to account for body weight), as was the force generated by the mouse over the duration of the tone. The startle response was calculated as the maximum force minus the initial force. This test was conducted over three days, again with no effect of day on the outcome (F2,69= 0.52,p= 0.60).
Forced swim test
This test exploits the fact that rodents in an inescapable situation eventually adopt a characteristic immobile pos-ture, which is amplified by stressors, alleviated by antide-pressants, and so interpreted as depression-like behaviour [31, 32]. All procedures were similar to those commonly reported in the literature [33, 34]. The testing room and water temperature ranges were chosen in order to limit the risk of mice developing hypothermia under testing. Tests were conducted from 10:30 am to 7:00 pm over four consecutive days. Cages were brought one at a time to a testing room adjacent to the colony room (white light on, ambient temperature maintained at 29 °C). Mice were allowed to habituate to the testing room in their home cage for 5 min and then were placed individually in three side-by-side transparent glass cylinders (height 23 cm, diameter 19 cm), visually separated by opaque screens and filled with 18 cm of water (water temperature: 25.38 °C ± 0.29). Mice were individually videotaped for 6 min (2 min of habituation and 4 min of testing [32]). They were then placed back in their home cage, allowed to recover and dry fully for 20 min and brought to the colony room. Cylinders were cleaned, rinsed with water, and filled again with clean water between each test. Treatments were counter-balanced between days of testing, hour of testing and the three cylinder locations. Two ob-servers (one experimenter [CF] and one assistant blind to
the treatments and hypothesis) scored each mouse’s
la-tency to immobility and total duration of immobility out of the 4 min of test. A mouse was judged to be im-mobile when it remained floating for at least 2 s with at least 3 legs totally motionless [32]. Inter-observer reliability was assessed using a correlation, and was
good for both measures (Latency: F1,208= 1110.2, p<
0.0001; Duration: F1,154= 1145.0, p< 0.0001); data were
therefore averaged between observers for each animal for further analysis.
Baseline faecal corticosterone metabolite assessment
Again, we followed an established protocol for faecal collection and analysis [18]. Faeces were collected from each mouse during the startle response test and during the novel object test. The two samples were pooled and
then frozen at −20 °C until processed. The assay has
been validated for mice [35], and all details regarding
the procedure have been published [36]. Eleven mice did not produce enough faeces for a complete assay, so were excluded from the analysis.
Body weight
Mice were weighed immediately upon arrival and again just prior to death. We used these values to calculate the growth of the mice over the duration of the experiment (final weight minus initial weight), correcting for initial body weight. Body weight at death was also used as a co-variate in the model for spleen weight [18].
Post mortem measures
Mice were killed via cervical dislocation at approximately 5 months of age by a trained technician. Similar to previ-ous work [18], a blood sample was taken via cardiac punc-ture immediately after death. A small portion of this sample was used to determine blood glucose, using a Contour® blood glucose meter; the rest of the sample was stored in a heparinized tube. After this, the mouse was dissected and the spleen was removed and weighed. Spleen mass is likely to reflect immune status in mammals (larger spleens suggest better immune function) [37], and also likely differs between our three strains of mice [38]. Blood samples were sent to the University of Guelph Animal Health Laboratory for a Complete Blood Count Analysis. Unfortunately, up to 39 samples (depending on the variable) were lost due to the presence of clots in the sample and therefore could not be analysed.
Statistical analyses
All analyses were conducted in JMP® 10. Mixed models were used to test all hypotheses and to run the behav-ioural consistency checks mentioned in the Methods. The model used for each dependent variable was similar:
y¼Cage Strainð ;Cage Type;EnrichmentÞ þStrain
þCage TypeþEnrichmentþStrainCage Type
þStrainEnrichmentþCage TypeEnrichment
þStrainCage TypeEnrichment
necessary to meet the assumptions of mixed models. If mixed-strain housing alters the phenotypes of the mice, Cage Type would have significant effects; and if mixed-strain housing altered the magnitude of mixed-strain differences (arguably a more important concern), Cage Type*Strain would be significant. Similarly, if mixed-strain housing al-tered the effects of enrichment, Cage Type*Enrichment would be significant. For these specific analyses, 26 models (one for each dependent variable; see Additional file 1: Table S1) were run, generating 182 p-values, all to test the hypothesis that mixed-strain housing affects mouse phenotype. Because multiple comparisons increase the risk of Type 1 errors, and because these were all from
the same ‘family’ of analyses (each individual p-value
representing a single test of one statistical hypothesis [42]), we performed a correction for the false discovery rate: the step-down multiple hypothesis testing procedure [43]. As a result of this procedure, the threshold for sig-nificance for this group of analyses was reduced from 0.05 to 0.0003. Tukey’s tests were then used to investigate any significant differences within categorical variables.
To analyse the impact of mixed-strain housing on the variability of the measures, we ran two additional tests on the standard deviations (SD) of the dependent vari-ables [16]. Firstly, we ran a simple sign test to make pair-wise comparisons for every dependent variable between single- and mixed-strain housed mice of each strain and housing treatment (156 comparisons). Secondly, we used the following mixed model to see if mixed-strain hous-ing predicted a difference in standard deviations and whether any differences were due to all or just some of the dependent variables:
SD¼Cage TypeþVariableþStrainþEnrichement
þCage TypeVariableþCage TypeStrain
þCage TypeEnrichementþEnrichement
VariableþEnrichmentStrainþCage Type
EnrichmentStrain
Here, a significant Cage Type effect would indicate that mixed-strain housing impacted the standard devia-tions of the dependent variables, and a significant Cage Type * Variable interaction would indicate that the standard deviations of some of the dependent variables are affected differently than others by mixed-strain housing. The other factors in the model are included as blocking factors.
Power and relative efficiency simulations
Because our effects were tested for using a mixed model, statistical power had to be estimated using a simulation approach [44, 45]. We used a custom-written program for
the statistical software R [46] with the “nlme” package
[47]. The code is archived in the University of Guelph
Research Data Repository: http://hdl.handle.net/10864/ 10939. For these analyses, single- and mixed-strain de-signs are being considered separately, and then compared to each other. We used the following procedure to esti-mate power for each combination of dependent variable and experiment. First, we analyzed data using a similar model as used in JMP above:
y¼Cage Strainð ;EnrichmentÞ þStrainþEnrichment
þStrainEnrichment
We extracted the following sample parameters: coeffi-cients for each strain and housing type; coefficoeffi-cients for each strain-by-housing combination; standard deviation among cages; and standard deviation of residuals. These respectively represent main effects, interaction effects, between-cage error, and between-individual error. Second, we used these parameters to run Monte Carlo simulations: for each combination of dependent variable and experi-mental design, we randomly generated a series of simu-lated study samples drawn from a hypothetical population with average characteristics (coefficients and standard deviations) identical to those we observed empirically. In these simulated samples, each animal's value for a dependent variable is the sum of its particular Strain, Enrichment, and Strain*Enrichment coefficients, and random coefficients for cage and individual (the latter two randomly generated from a normal distribution, centred at zero, with the appropriate empirically-observed standard deviation). Third, using the same statistical model as above to analyze each of 100,000 simulated study samples for each dependent variable in each ex-periment, we calculated power as the fraction of these that produced p-values less than or equal to alpha = 0.05.
To compare post hoc power, we estimated power for
the sample sizes used in our actual experiments. For those dependent variables that were not obtained from all subjects, we reduced the size of the simulated study populations accordingly. For each type of effect (Strain, Enrichment, Strain*Enrichment), we compared statistical power, estimated by Monte Carlo simulations, across all dependent variables using t-tests. For data from these sim-ulations, we also made sure of the reliability of our esti-mates by testing for a correlation between power calculated from simulation rounds 1 through 50,000 and power calculated from rounds 50,001 through 100,000. These simulations were consistent (F1,124= 1995227, p <
0.0001; r2= 0.999), and not affected by type of effect –
Strain, Enrichment, and Strain*Enrichment – (F5,124=
0.67, p = 0.64) or by Variable (F25,124= 0.98,p= 0.49).
between single- and mixed-strain designs. We only tested sample sizes that were runnable as a balanced model in the single- strain design (i.e. multiples of 6, with a minimum of 12). Even though the mixed-strain model could be balanced in multiples of 2, this would not lead to an even compari-son between the two designs. For each combination of Cage Type (single or mixed), effect type (Strain, Enrich-ment, Strain*Enrichment), and dependent variable, we ran 100,000 simulations to estimate power at a variety of sam-ple sizes, until we identified the lowest samsam-ple size yielding at least 80 % power. Because this is a very computation-heavy, time-consuming process, we did not estimate the actual N required in cases where it was above a ceiling of 600 cages. We then calculated the median (and inter-quartile range) number of cages needed to achieve 80 %
power across all 26 dependent variables. Mann–Whitney U
tests (non-parametric) were used to compare single- and mixed- strain designs (Table 1). Any variable that required greater than 600 cages to achieve 80 % power was given the maximum value of 600 for these analyses. Finally, we calculated partial eta squared (ηp2) values as a measure of effect size for every dependent variable, split by effect (Enrichment, Strain, Strain*Enrichment) and by single- or mixed-strain (Additional file 1: Tables S2–S4) [48].
Estimated power to detect significant Cage Type effects
The aim of this analysis was to determine if we had suf-ficient power to detect any effects of Cage Type that
might have existed. Because post hocpower tests are
in-herently circular [49], we wanted to instead estimate the effect size we could have detected with 80 % power. To be conservative, and to stay consistent with our correc-tion for multiple testing, we set the threshold for signifi-cance at p = 0.0003 for these simulations. To begin, we calculated the empirical standardized effect sizes (Cohen’s
d, one for each dependent variable) observed in our
ex-periment using least squared means and the standard de-viations associated with these means (i.e. corrected for other factors in the model). Next, we used a binary search algorithm to calculate the effect size required to give us 80 % power to detect Cage Type effects at an alpha of 0.0003. For each outcome variable, we selected the first ef-fect size tested by the binary search for which estimated power (based on 25,000 simulations) was not significantly
different from 80 % in a binomial test using a conservative threshold of alpha = 0.2 (in practice we obtained power estimates between 79.73-80.31 %).
Results
Characterizing strain phenotypes
Table 2 shows all significant and trend effects of mixed-strain housing on mixed-strain differences, enrichment effects, and their interactions. Note that multiple comparison corrections, designed to reduce the Type I errors intro-duced by multiple testing (182 p-values were generated), reduced the significance threshold for the family of ana-lyses top= 0.0003 (see Additional file 1: Table S1 for all results for all 26 dependent variables).
Enrichment had only a few significant main effects, while several strain differences were evident, all in ex-pected directions. Importantly, no significant results in-volved Cage Type (single- or mixed-strain): there were thus no significant Cage Type effects, Cage Type*Strain interactions, or Cage Type*Enrichment interactions. The only possible Cage Type effects were trend main effects for two of the 26 variables (see Table 2); one trend for an interaction with strain for a third; and two weak trend interactions between Cage Type and the presence or absence of enrichment for two other variables. Overall, however, mixed-strain housing generally did not markedly or consistently alter animals’phenotypes or affect the mag-nitudes of strain differences; and enrichment effects on all variables were also similar, regardless of whether or not mice were housed in mixed-strain trios.
Behavioural compatibility and welfare
That mixed-strain housing did not compromise welfare was suggested by the lack of significant Cage Type effects on variables related to stress and well-being: stereotypic behaviour, novel object exploration, startle responses, la-tencies to begin floating, or faecal corticosterone metabo-lites (see Table 2). There were just two non-significant trends, and in opposing directions with respect to their potential welfare implications: mixed-strain mice tended to show longer forced swim test durations of floating, but conversely, mixed-strain mice tended to grow faster. In addition, as reported above, enrichment had similarly beneficial effects in all mice, regardless of whether housed
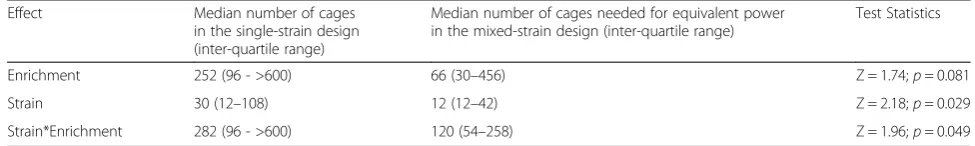
Table 1Relative efficiency of single- and mixed-strain designs for each type of effect. The numbers of cages are the median required amounts to achieve 80 % power in the mixed- and single-strain designs. Test statistics are based on a Mann Whitney test (n= 52). See Additional file 1: Tables S2–S4 for details
Effect Median number of cages
in the single-strain design (inter-quartile range)
Median number of cages needed for equivalent power in the mixed-strain design (inter-quartile range)
Test Statistics
Enrichment 252 (96 - >600) 66 (30–456) Z = 1.74;p= 0.081
Strain 30 (12–108) 12 (12–42) Z = 2.18;p= 0.029
in mixed- or single-strain trios. Furthermore, over the four months of the experiment, only three cases of barbering were observed, all taking place in single-strain, C57BL/6 cages (two in non-enriched cages, one in enriched); neither technicians nor researchers witnessed any occurrences of severe aggression; and when examinations were performed after death, no evidence of wounds was found on any mouse.
Power to detect possible Cage Type effects
The fact that we did not find significant effects of Cage Type for any of our dependent variables raises the ques-tion: did we have the power to detect any differences
that might have existed? Simplepost hocpower analyses
are inherently circular [49], so as an alternative way of
addressing the issue we ran simulations (for each dependent variable) based on our empirical data that estimated how much larger the differences in means between single- and mixed-strain housing would have to have been for us to detect them at 80 % power and using p = 0.0003 as the threshold for significance. Our empirical effect sizes were‘small’[50] for all 26 dependent variables (see Table 3). The estimated required effect sizes necessary for us to have been able to likely detect an effect are all‘large’(see Table 3).
Data variation within mixed- vs. Single-strain cages
The standard deviations (SD) of the measured variables, were used to measure variation within our experiment. We performed two different analyses to investigate the
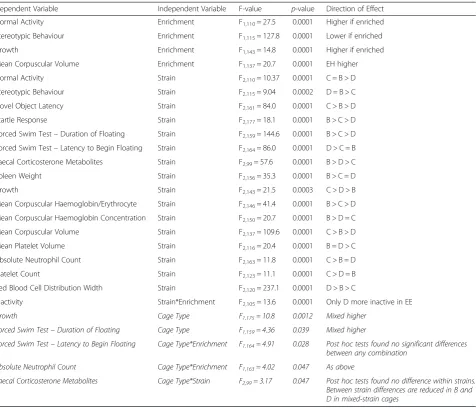
Table 2Significant effects (after correction for multiple comparison) for all 26 dependent variables in C57BL/6 (C), BALB/c (B), and DBA/2(D) females. All trend effects of Cage Type, i.e. whether housed in single- or mixed-strain trios, are shown in italics even though not significant after the correction. For interactions, effect directions are based on Tukey’s tests for each dependent*independent variable. Denominator degrees of freedom vary as a result of the REML procedure and some sample loss
Dependent Variable Independent Variable F-value p-value Direction of Effect
Normal Activity Enrichment F1,110= 27.5 0.0001 Higher if enriched
Stereotypic Behaviour Enrichment F1,115= 127.8 0.0001 Lower if enriched
Growth Enrichment F1,143= 14.8 0.0001 Higher if enriched
Mean Corpuscular Volume Enrichment F1,137= 20.7 0.0001 EH higher
Normal Activity Strain F2,110= 10.37 0.0001 C = B > D
Stereotypic Behaviour Strain F2,115= 9.04 0.0002 D = B > C
Novel Object Latency Strain F2,161= 84.0 0.0001 C > B > D
Startle Response Strain F2,177= 18.1 0.0001 B > C > D
Forced Swim Test–Duration of Floating Strain F2,159= 144.6 0.0001 B > C > D Forced Swim Test–Latency to Begin Floating Strain F2,164= 86.0 0.0001 D > C = B Faecal Corticosterone Metabolites Strain F2,99= 57.6 0.0001 B > D > C
Spleen Weight Strain F2,156= 35.3 0.0001 B > C = D
Growth Strain F2,143= 21.5 0.0003 C > D > B
Mean Corpuscular Haemoglobin/Erythrocyte Strain F2,146= 41.4 0.0001 B > C > D Mean Corpuscular Haemoglobin Concentration Strain F2,150= 20.7 0.0001 B > D = C
Mean Corpuscular Volume Strain F2,137= 109.6 0.0001 C > B > D
Mean Platelet Volume Strain F2,116= 20.4 0.0001 B = D > C
Absolute Neutrophil Count Strain F2,163= 11.8 0.0001 C > B = D
Platelet Count Strain F2,123= 11.1 0.0001 C > D = B
Red Blood Cell Distribution Width Strain F2,120= 237.1 0.0001 D > B > C
Inactivity Strain*Enrichment F2,105= 13.6 0.0001 Only D more inactive in EE
Growth Cage Type F1,175= 10.8 0.0012 Mixed higher
Forced Swim Test–Duration of Floating Cage Type F1,159= 4.36 0.039 Mixed higher
Forced Swim Test–Latency to Begin Floating Cage Type*Enrichment F1,164= 4.91 0.028 Post hoc tests found no significant differences
between any combination
Absolute Neutrophil Count Cage Type*Enrichment F1,163= 4.02 0.047 As above
Faecal Corticosterone Metabolites Cage Type*Strain F2,99= 3.17 0.047 Post hoc tests found no difference within strains.
effects of mixing strains on the SDs of measured vari-ables. The first was a simple sign test (one comparison for each Strain(3)*Enrichment(2)*Variable(26) combin-ation; 156 total), which revealed significantly more cases where the SD was lower in the mixed-strain design than
the single-strain design (100/156; p= 0.0006). As an
aside, enrichment did not affect SD (80/156;p= 0.81) in
this sign test. The second analysis was a mixed model to investigate whether mixed-strain housing predicted dif-ferences in SD, and whether any difdif-ferences were due to some or all of the dependent variables. Mixed-strain
housing again predicted significantly lower SDs (F1,224=
17.1, p< 0.0001). This was consistent across all 26
dependent variables: there was no Cage Type*Variable interaction (F25,224= 6.1,p= 0.093). Once again, a
subsid-iary finding was no effect of enrichment on SD (F1,224=
01.5, p= 0.22), yet there was an Enrichment*Variable
interaction (F25,224= 2.42, p= 0.0003). A Tukey’s post hoc
analysis shows that this result reflects enrichment redu-cing variation in stereotypic behaviour.
Power and relative efficiency simulations
We conducted two sets of tests to compare the statistical power to detect the Strain, Enrichment and Strain*Enrich-ment effects offered by single- vs. mixed-strain
experi-mental designs. The first was a pairedt-test to compare
post hoc power, calculated for the actual sample sizes used and the standardized effect sizes (the difference be-tween group means divided by the pooled standard devi-ation [51]) observed in each experiment. This thus tested whether the various levels of observed power dif-fered between our relatively small mixed-strain sample (17 cages by the end of the study) and the larger same-strain sample (55 cages by the end of the study). Even though the split-plot design used under a third the num-ber of cages of the full factorial design, the levels of power achieved were not significantly different for detecting
Enrichment (t50= 0.15, p= 0.88; see Additional file 1:
Figure S5), Strain (t50=−0.10, p= 0.92; see Additional
file 1: Figure S6), or Strain*Enrichment effects (t50=
0.89,p= 0.38; Additional file 1: Figure S7).
Our second approach was to use Monte Carlo simula-tions to estimate relative efficiency, identifying the sample
sizes required to obtain 80 % power – widely
recom-mended as a desirably high level of power–in each type
of experiment. Recognizing that experimental design may have an impact on true effect sizes, we used separate (observed) effect sizes for each experimental design (single-strain/full factorial vs. mixed-strain/split- plot) when estimating power at different sample sizes (Additional file 1: Tables S2–S4). This revealed that fewer cages were required to obtain 80 % power in the mixed-strain, split-plot design (see Table 1).
Discussion
To validate mixed-strain housing for female laboratory mice as a potential way to reduce animal numbers with-out sacrificing research quality, first, we tested the hy-pothesis that it alters mouse phenotypes, recognizing that many researchers may be concerned that changing prac-tice could alter well-established strain typical phenotypes
and –worse– affect the magnitude or even direction of
differences between strains. As in our previous study co-housing DBA/2 and C57BL/6 mice [18], results were re-assuring: observed strain differences were harmonious with the literature, and their directions and magnitudes were unaffected by mixed-strain housing. Thus, DBA/2
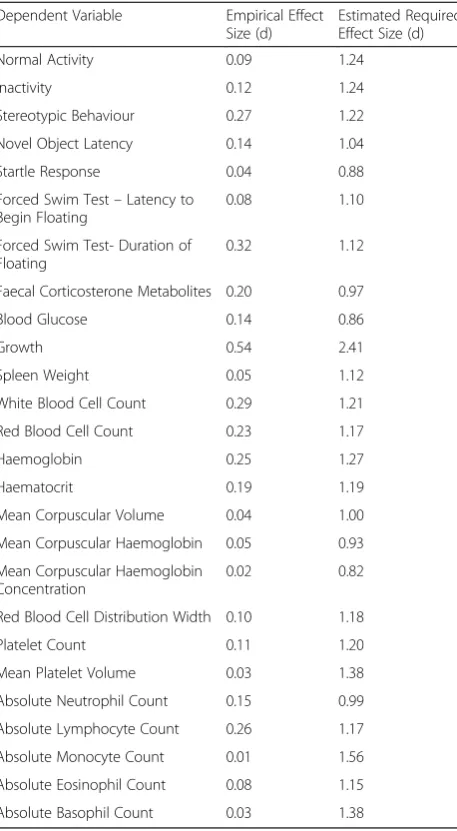
Table 3Estimated Cage Type standardized effect sizes (Cohen’s d) that would be required to detect a significant effect with 80 % power (β) and a significance threshold ofp= 0.0003 (α). Effect size calculations are based on the least squared means from the original models (i.e. they are based on transformed values that have been corrected for other factors in the model)
Dependent Variable Empirical Effect Size (d)
Estimated Required Effect Size (d)
Normal Activity 0.09 1.24
Inactivity 0.12 1.24
Stereotypic Behaviour 0.27 1.22
Novel Object Latency 0.14 1.04
Startle Response 0.04 0.88
Forced Swim Test–Latency to Begin Floating
0.08 1.10
Forced Swim Test- Duration of Floating
0.32 1.12
Faecal Corticosterone Metabolites 0.20 0.97
Blood Glucose 0.14 0.86
Growth 0.54 2.41
Spleen Weight 0.05 1.12
White Blood Cell Count 0.29 1.21
Red Blood Cell Count 0.23 1.17
Haemoglobin 0.25 1.27
Haematocrit 0.19 1.19
Mean Corpuscular Volume 0.04 1.00
Mean Corpuscular Haemoglobin 0.05 0.93 Mean Corpuscular Haemoglobin
Concentration
0.02 0.82
Red Blood Cell Distribution Width 0.10 1.18
Platelet Count 0.11 1.20
Mean Platelet Volume 0.03 1.38
Absolute Neutrophil Count 0.15 0.99
Absolute Lymphocyte Count 0.26 1.17
Absolute Monocyte Count 0.01 1.56
Absolute Eosinophil Count 0.08 1.15
and BALB/c mice were consistently more stereotypic than C57BL/6 mice [11, 18]; BALB/c and C57BL/6 were con-sistently most anxious, in behavioural tests of anxiety, followed by DBA/2 s [18, 52]; DBA/2 mice showed con-sistently lower durations of immobility in the forced swim test than the other two strains [52] (a variable for which there was a non-significant trend main effect of Cage Type, but not one that modified these strong strain effects); differences in growth were as expected [21] (the second variable for which there was a trend main effect of Cage Type, but again not one that modified these strong, expected strain effects); and our significant haematological results for corpuscular haemoglobin met-rics, corpuscular volume, and platelet counts were largely consistent with the JAX Mouse Phenome Database, again regardless of Cage Type [53]. Faecal corticosterone metab-olite outputs were also highest in BALB/c mice and lowest in C57BL/6, as previously reported [13]. This was the only one of our 26 variables for which there was even a hint of an interaction between Strain and Cage Type. However, this was again only a weak non-significant trend, and too subtle to alter the strong, highly significant, expected strain differences detected. For all other 25 variables, there was not even a trend interaction between Strain and Cage Type. Strain similarities and differences were thus well conserved in the novel housing paradigm. This means that when these strains are mixed, their phenotypes are not altered (e.g. not homogenized within cages), so that re-searchers can still expect to find strain typical results. This in turn also means that the value of using diverse strains is preserved, so that external validity remains high.
The second aspect of our validation investigated whether effects of a widely-used treatment, environmental enrich-ment, would be modified by co-housing strains. Enriched housing had several benefits expected from previous studies: enriched mice grew faster and were less stereo-typic (e.g. [54]). However, for 24 of our 26 variables, mixed-strain housing did not modify, i.e. interact with, the impact of environmental enrichment. For the two others (neutrophil count and latencies to float in the forced swim test), there were weak trend interactions between Enrichment and Cage Type but these were so
subtle (post hoctests found no differences), and also so
isolated (i.e. not accompanied by effects in biologically related variables) that we suspect they are Type I errors. Overall, mixed-strain housing thus essentially had no impacts on the effectiveness of environmental enrichment.
Our validation’s third component focused on variables
related to welfare, to assess whether mixed-strain hous-ing would compromise mouse well-behous-ing. As outlined above, for measures relating to physical health, stress, anxiety, or depression, there was no strong evidence that mixed-strain housing affected mouse welfare. The trend
for mixed-strain mice to exhibit higher levels of depression-like behaviour under test is potentially worrying, but was arguably offset by the trend for improved growth, and also tenuous enough that replication is now needed to see whether it was a Type I error. Furthermore, there was no serious aggression or wounding, and minimal levels of barbering, suggesting good behavioural compatibility between all cagemates, regardless of whether housed in mixed- or single-strain trios. Facility technicians also
reported that thanks to cagemates’ different colouring,
cage-side inspections for mixed-strain cages were easier, faster, and more reliable (even under red light). Conse-quently, overall, being in a mixed-strain trio did not com-promise welfare.
The fourth part of our validation was assessing the ef-fect sizes generated by mixed-strain housing in order to ensure that our study did not fail to find obvious effects due to low power. Our empirical effect sizes were small for all 26 dependent variables suggesting that mixed-strain housing has only a small effect on phenotype overall. Therefore, the non-significant Cage Type results of the current experiment are not likely to be Type II errors; if there was a large effect of mixed-strain housing we probably could have detected it. We come to this con-clusion while recognizing that what is considered a
‘meaningful difference’ is subjective and depends on
various factors such as the biological significance of the measure or the accepted norms within a discipline [50]. The final aspect of our validation involved assessing variation within measured variables, to determine if mixed-strain housing increased it. Any increased variation could reduce or negate the intrinsic statistical advantages of our design, and even indicate that more animals would be needed to detect significant effects: at odds with our aim of promoting reduction. Surprisingly, we found the opposite: mixed-strain housing lowered variation, an effect seem-ingly consistent across our diverse variables. Our first explanation was that in mixed-strain cages, each strain perhaps occupies a set social rank, making mice within the same strain more uniform than in the single-strain design. However, the lack of Cage Type effects on strain-typical phenotypes or variables relevant to welfare makes this unlikely, and so for now, the mechanism is unknown. Regardless, this effect meant that, in addition to the inher-ent power benefits of this experiminher-ental design, mixed-strain housing further increased power by reducing vari-ance in diverse types of data [55]. As a supplementary finding, just as others have recently found [56], enrich-ment here had no effect on variation in the data.
significantly different from the power for 55 single-strain cages. This broadly indicates that the same results can be obtained from many fewer cages, and so many fewer mice (in this case less than a third) when a mixed-strain, split-plot design is used. Our second analysis took this a step further, using simulations based on our own data to determine the median numbers of mixed- vs. single-strain cages needed to achieve comparable levels of high power (80 %) for each dependent-independent variable combin-ation. The number of mixed-strain cages needed was sig-nificantly lower for Strain and Strain*Enrichment effects, and tended to be lower for Enrichment effects. On average (using medians), to achieve this specified power, the split-plot design reduced the number of animals required by three quarters in analyses of Enrichment effects, and by more than half for detecting Strain and Strain*Enrichment effects. Note that both of these approaches reflect and rely on the effect sizes yielded in our particular study, and so their results should not be taken as precise guides for those planning new experiments (furthermore, for some variables, effect sizes were tiny and arguably biologically irrelevant, inflating the numbers required in those instances). However, they do demonstrate the potential of mixed- strain housing to dramatically reduce the numbers of animals used.
Such differences in required sample sizes have great ethical and economic implications. Furthermore, the in-trinsic statistical benefits of this type of split-plot design are not unique to mixed-strain housing: they may apply to any case where animals of different characteristics (genotypes, phenotypes or treatment groups) live in a group to which experimental manipulations can be made (e.g. within a single cage or litter). Thus, whenever pos-sible, this approach should be considered (after careful validation) due to its potential to reduce animal use. Around 30 million mice are used in experiments each year [57]. If using more efficient designs in this way re-duced this value by just 10 % (a very conservative esti-mate), the numbers of mice used each year would fall by 3 million with no loss of research quality, and the cost of research would also fall. Increasing the inherent power of designs has other benefits too: it can increase the ability of small-scale studies (e.g. pilots) to generate significant results (the power benefits being most marked when sam-ple sizes are small: see Fig. 1), and it can increase the chances of all studies generating more reliable, replicable results [58].
We do, however, acknowledge some instances in which this approach would not be beneficial or appropriate. For example, the males of our strains, or females from other strains, may not mix as well as our subjects did (e.g. [59]). Males can be difficult to socially-house because they tend to be aggressive towards their cagemates. It is currently unknown how mixing strains would affect inter-male
aggression and would likely depend upon the strains in question as they differ in baseline levels of aggression [11]. Mixing strains may also significantly influence other variables other than those we measured, such as strain-specific gut microbiota [60], which could cross-contaminate and so confound some research (e.g. gastro-enterological studies). Researchers not interested in female C57BL/6, DBA/2, and BALB/c mice, or the 26 variables we screened, should therefore attempt to validate mixed-strain housing (or other types of split-plot designs) for themselves, focussing on their own phenotypes and vari-ables of interest. Furthermore, the statistical advantages of this design rely on treating cage as the unit of replication, but in some rare instances Cage may not need to be in-cluded in the model if the variables studied are known to never be affected by social factors, the physical environ-ment, or stress (as perhaps is the case when mice serve only as donors of certain tissues for subsequent in vitro work). The statistical advantages also rely on a change in the denominator degrees of freedom substantially af-fecting the threshold value of F: something only manifest when there are more than two sub-units, and having diminishing returns when sample sizes are large (see Fig. 1). Finally, co-housing mice of different coat colours would not eliminate the need for marking in any project needing unique colony level identification for each individual.
Conclusions
Using fewer laboratory animals is a clear aim of the 3Rs [1]; it also saves researchers money. Our evidence shows that mixed-strain housing can be a case where a split-plot experimental design does just that, without compromising the quality of research. At least for female C57BL/6, DBA/ 2, and BALB/c mice, they can be studied and housed to-gether, so increasing external validity of the experiment, without negative implications for welfare or data variabil-ity, and while still replicating typical strain and enrichment effects. The mixed-strain housing studied here was dem-onstrably much more powerful than housing mice con-ventionally, potentially able to reduce animal numbers by half or more. Using differentially pigmented subjects, as we did, further allowed researchers and technicians to eas-ily identify individuals in the home cage, even under red light, so obviating the use of invasive marking techniques
and meeting another of the 3Rs–refinement. Although in
some cases this practice may not be appropriate, in gen-eral mixing strains in this way, or co-housing individuals of other characteristics, has great potential for reducing animal numbers by allowing the use of intrinsically power-ful split- plot experimental designs.
Ethical review
CCAC. The Animal Use Protocol Number was 12R021/ 1398.
Availability of supporting data
The data sets supporting the results of this article are available in the University of Guelph Research Data Repository: http://hdl.handle.net/10864/10939.
Additional file
Additional file 1:Comprehensive list of results and addtitional information detailing the statistical benefits of a split-plot design.
(DOCX 11238 kb)
Abbreviations
SD:Standard deviation; SH: Standard housing; EH: Enriched housing.
Competing interests
The authors declare no competing interests.
Authors’contributions
MW led the experiment, analysed the data, created all tables and figures save for Fig. 1, and wrote the manuscript. CF ran some of the behavioural tests. RP analysed faecal samples for corticosteroid analyses. JAN provided statistical advice, the background statistical information in the text, and created Fig. 1. JAD ran the Monte Carlo simulations and power analyses in R. GM (corresponding author) conceived of and funded the study, edited several drafts of the manuscript and finalized the submission. All authors read, commented on, and approved the final submission.
Acknowledgements
Thank you to our animal care technicians Maka Natsvlishvili and Michelle Cieplak and to our summer research assistant Amanda Saldivia-Woo.
Funding
This work was funded by the Natural Sciences and Engineering Research Council of Canada (NSERC) and by the Universities Federation for Animal Welfare (UFAW).
Author details
1Animal Biosciences, University of Guelph, Guelph, ON N1G 2 W1, Canada. 2Department of Biomedical Sciences/Biochemistry, University of Veterinary Medicine, Veterinärplatz 1, Vienna A-1210, Austria.3College of Biological Science, University of Guelph, Guelph, ON N1G 2 W1, Canada.
Received: 2 July 2015 Accepted: 19 January 2016
References
1. Russell WMS, Burch RLJA. The Principles of Humane Experimental Technique. London, UK; Methuen Publishing Ltd (C1959); 1959. 2. EU Directive 2010/63/EU of the European Parliament and of the Council of
22 September 2010 on the Protection of Animals Used for Scientific Purposes. http://eur-lex.europa.eu/legal-content/EN/TXT/HTML/?uri=CELEX: 32010L0063&from=EN
3. National Research Council of the National Academies.Guide for the Care and Use of Laboratory Animals. 8thEd. 2011. http://grants.nih.gov/grants/ olaw/Guide-for-the-Care-and-Use-of-Laboratory-Animals.pdf
4. Hurst JL, West RS. Taming anxiety in laboratory mice. Nat Methods. 2010;7(10):825–U1516.
5. Marx U, Walles H, Hoffmann S, Lindner G, Horland R, Sonntag F, et al. ‘Human-on-a-chip’developments: A translational cutting-edge alternative to systemic safety assessment and efficiency evaluation of substances in laboratory animals and man? Altern Lab Anim. 2012;40(5):235–57. 6. Kilkenny C, Parsons N, Kadyszewski E, Festing MFW, Cuthill IC, Fry D, et al.
Survey of the quality of experimental design, statistical analysis and reporting of research using animals. Plos One. 2009;4(11):11.
7. Altman N, Krzywinski M. Points of significance: Split plot design. Nat Methods. 2015;12(3):165–6.
8. Festing M. 3Rs- Reduction; Factorial Experiments. http://www.3rs-reduction. co.uk/html/10__factorial_experiments.html. Accessed May 19, 2015. 9. Lehner PN. Handbook of Ethological Methods. 2nd ed. New York:
Cambridge University Press; 1996.
10. Wurbel H. Behaviour and the standardization fallacy. Nat Genet. 2000;26(3):263. 11. Nevison CM, Hurst JL, Barnard CJ. Strain-specific effects of cage enrichment
in male laboratory mice (Mus musculus). Anim Welf. 1999;8(4):361–79. 12. Singer P, Feldon J, Yee BK. Are DBA/2 mice associated with
schizophrenia-like endophenotypes? A behavioural contrast with C57BL/6 mice. Psychopharmacology. 2009;206(4):677–98.
13. Harizi H, Homo-Delarche F, Amirani A, Coulaud J, Mormede P. Marked genetic differences in the regulation of blood glucose under immune and restraint stress in mice reveals a wide range of corticosensitivity. J Neuroimmunol. 2007;189(1–2):59–68.
14. Richter SH, Garner JP, Zipser B, Lewejohann L, Sachser N, Touma C, et al. Effect of population heterogenization on the reproducibility of mouse behavior: A multi-laboratory study. Plos One. 2011;6(1):14.
15. Tucci V, Lad HV, Parker A, Polley S, Brown SDM, Nolan PM. Gene-environment interactions differentially affect mouse strain behavioral parameters. Mamm Genome. 2006;17(11):1113–20.
16. Bowley S. A Hitchhiker's Guide to Statistics in Plant Biology. 2ndEd. Guelph, Ont.: Any Old Subject Books; 2008.
17. Festing MFW. 3Rs- Reduction; Statistical Analysis. http://www.3rs-reduction. co.uk/html/12__statisticanalysis.html. Accessed May 19, 2015.
18. Walker M, Fureix C, Palme R, Mason G. Co-housing rodents with different coat colours as a simple, non-invasive means of individual identification: Validating mixed-strain housing for C57BL/6 and DBA/2 mice. Plos One. 2013;8(10):e77541.
19. Dahlborn K, Bugnon P, Nevalainen T, Raspa M, Verbost P, Spangenberg E. Report of the federation of european laboratory animal science associations working group on animal identification. Lab Anim. 2013;47(1):2–11. 20. Burn CC, Deacon RMJ, Mason GJ. Marked for life? Effects of early cage-cleaning
frequency, delivery batch, and identification tail-marking on rat anxiety profiles. Dev Psychobiol. 2008;50(3):266–77.
21. The Jackson Laboratory. Growth curve analysis of 7 inbred strains of mice. MPD:Jaxpheno5. Mouse Phenome Database web site, The Jackson Laboratory, Bar Harbor, Maine USA. http://phenome.jax.org; 2006.
22. Moy SS, Nadler JJ, Young NB, Perez A, Holloway LP, Barbaro RP, et al. Mouse behavioral tasks relevant to autism: Phenotypes of 10 inbred strains. Behav Brain Res. 2007;176(1):4–20.
23. Olsson IAS, Westlund K. More than numbers matter: The effect of social factors on behaviour and welfare of laboratory rodents and non-human primates. Appl Anim Behav Sci. 2007;103(3–4):229–54.
24. Cannon CZ, Kissling GE, Goulding DR, King-Herbert AP, Blankenship-Paris T. Analgesic effects of tramadol, carprofen or multimodal analgesia in rats undergoing ventral laparotomy. Lab Animal. 2011;40(3):85–93. 25. Martin P, Bateson P. Measuring Behaviour: An Introductory Guide. 2ndEd.
Cambridge University Press; 1994:i-xvi, 1–222.
26. Tilly SLC, Dallaire J, Mason GJ. Middle-aged mice with enrichment-resistant stereotypic behaviour show reduced motivation for enrichment. Anim Behav. 2010;80(3):363–73.
27. Mason GJ, Latham NR. Can’t stop, won’t stop: Is stereotypy a reliable animal welfare indicator? Anim Welf. 2004;13:S57–69.
28. Ennaceur A, Michalikova S, Bradford A, Ahmed S. Detailed analysis of the behavior of Lister and Wistar rats in anxiety, object recognition and object location tasks. Behav Brain Res. 2005;159(2):247–66.
29. Walker MD, Mason G. Female C57BL/6 mice show consistent individual differences in spontaneous interaction with environmental enrichment that are predicted by neophobia. Behav Brain Res. 2011;224(1):207–12. 30. Adamec R, Head D, Blundell J, Burton P, Berton O. Lasting anxiogenic
effects of feline predator stress in mice: Sex differences in vulnerability to stress and predicting severity of anxiogenic response from the stress experience. Physiol Behav. 2006;88(1–2):12–29.
31. Matthews K, Christmas D, Swan J, Sorrell E. Animal models of depression: Navigating through the clinical fog. Neurosci Biobehav Rev. 2005;29(4–5):503–13. 32. Porsolt RD, Bertin A, Jalfre M. Behavioral despair in mice–Primary screening
34. Arai I, Tsuyuki Y, Shiomoto H, Satoh M, Otomo S. Decreased body temperature dependent appearance of behavioral despair in the forced swimming test in mice. Pharmacol Res. 2000;42(2):171–6.
35. Touma C, Palme R, Sachser N. Analyzing corticosterone metabolites in fecal samples of mice: A noninvasive technique to monitor stress hormones. Horm Behav. 2004;45(1):10–22.
36. Touma C, Sachser N, Mostl E, Palme R. Effects of sex and time of day on metabolism and excretion of corticosterone in urine and feces of mice. Gen Comp Endocrinol. 2003;130(3):267–78.
37. Roitt IM, Brostoff J, Male DK. Immunology. 5th ed. London: C.V. Mosby; 1998. 38. Kelley SP, Grota LJ, Felten SY, Madden KS, Felten DL. Norepinephrine in
mouse spleen shows minor strain differences and no diurnal variation. Pharmacol Biochem Behav. 1996;53(1):141–6.
39. Lazic SE. The problem of pseudoreplication in neuroscientific studies: Is it affecting your analysis? BMC Neurosci. 2010;11:5.
40. Hurlbert SH. Pseudoreplication and the design of ecological field experiments. Ecol Monogr. 1984;54(2):187–211.
41. Newman JA, Bergelson J, Grafen A. Blocking factors and hypothesis tests in ecology: Is your statistics text wrong? Ecology. 1997;78(5):1312–20. 42. Benjamini Y, Drai D, Elmer G, Kafkafi N, Golani I. Controlling the false discovery
rate in behavior genetics research. Behav Brain Res. 2001;125(1–2):279–84. 43. Benjamini Y, Liu W. A step-down multiple hypotheses testing procedure
that controls the false discovery rate under independence. J Stat Plan Inference. 1999;82(1–2):163–70.
44. SanchezMeca J, MarinMartinez F. Homogeneity tests in meta-analysis: A Monte Carlo comparison of statistical power and type I error. Qual Quant. 1997;31(4):385–99.
45. Mumby PJ. Statistical power of non-parametric tests: A quick guide for designing sampling strategies. Mar Pollut Bull. 2002;44(1):85–7. 46. R Core Team. A Language and Environment for Statistical Computing. R
Foundation for Statistical Computing; 2014. www.R-project.org. 47. Pinheiro J, Bates D, DebRoy S, Sarkar D, R Core Team. Linear and nonlinear
mixed effects models; 2014. http://CRAN.R-project.org/package=nlme 48. Lakens D. Calculating and reporting effect sizes to facilitate cumulative
science: a practical primer for t-tests and ANOVAs. Front Psychol. 2013;4:863. 49. Hoenig JM, Heisey DM. The abuse of power: The pervasive fallacy of power
calculations for data analysis. Am Stat. 2001;55(1):19–24.
50. Cohen J. Statistical power analysis for the behavioral sciences. 2nd ed. N.J. L. Hillsdale: Erlbaum Associates; 1988.
51. Festing MFW. Extending the statistical analysis and graphical presentation of toxicity test results using standardized effect sizes. Toxicol Pathol. 2014;42(8):1238–49.
52. Ducottet C, Belzung C. Correlations between behaviours in the elevated plus-maze and sensitivity to unpredictable subchronic mild stress: evidence from inbred strains of mice. Behav Brain Res. 2005;156(1):153–62. 53. The Jackson Laboratory.: Hematological survey of 11 inbred strains of mice.
MPD:22969. Mouse Phenome Database web site, The Jackson Laboratory, Bar Harbor, Maine USA. http://phenome.jax.org; 2007.
54. Gross AN, Richter SH, Engel AKJ, Wurbel H. Cage-induced stereotypies, perseveration and the effects of environmental enrichment in laboratory mice. Behav Brain Res. 2012;234(1):61–8.
55. Grafen A, Hails R. Modern Statistics for the Life Sciences: Learn how to Analyse your Experiments. Oxford University Press 2002:i-xv, 1–351. 56. Wolfer DP, Litvin O, Morf S, Nitsch RM, Lipp HP, Wurbel H. Cage enrichment
and-mouse behaviour - Test responses by laboratory mice are unperturbed by more entertaining housing. Nature. 2004;432(7019):821–2.
57. Taylor K, Gordon N, Langley G, Higgins W. Estimates for worldwide laboratory animal use in 2005. Altern Lab Anim. 2008;36(3):327–42.
58. Ioannidis JPA. Why most published research findings are false. Plos Medicine. 2005;2(8):696–701.
59. Curley JP, Rock V, Moynihan AM, Bateson P, Keverne EB, Champagne FA. Developmental shifts in the behavioral phenotypes of inbred mice: The role of postnatal and juvenile social experiences. Behav Genet. 2010;40(2):220–32. 60. Vaahtovuo J, Toivanen P, Eerola E. Bacterial composition of murine fecal
microflora is indigenous and genetically guided. FEMS Microbiol Ecol. 2003;44(1):131–6.
• We accept pre-submission inquiries
• Our selector tool helps you to find the most relevant journal • We provide round the clock customer support
• Convenient online submission • Thorough peer review
• Inclusion in PubMed and all major indexing services • Maximum visibility for your research
Submit your manuscript at www.biomedcentral.com/submit