VOLUME NO. 1 (2011), ISSUE NO. 5 (OCTOBER) ISSN 2231-5756
I
I
I
N
N
N
T
T
T
E
E
E
R
R
R
N
N
N
A
A
A
T
T
T
I
I
I
O
O
O
N
N
N
A
A
A
L
L
L
J
J
J
O
O
O
U
U
U
R
R
R
N
N
N
A
A
A
L
L
L
O
O
O
F
F
F
R
R
R
E
E
E
S
S
S
E
E
E
A
A
A
R
R
R
C
C
C
H
H
H
I
I
I
N
N
N
C
C
C
O
O
O
M
M
M
M
M
M
E
E
E
R
R
R
C
C
C
E
E
E
,
,
,
I
I
I
T
T
T
A
A
A
N
N
N
D
D
D
M
M
M
A
A
A
N
N
N
A
A
A
G
G
G
E
E
E
M
M
M
E
E
E
N
N
N
T
T
T
A Monthly Double-Blind Peer Reviewed Refereed Open Access International e-Journal - Included in the International Serial Directories
Indexed & Listed at: Ulrich's Periodicals Directory ©, ProQuest, U.S.A., Open J-Gage, India as well as in Cabell’s Directories of Publishing Opportunities, U.S.A.
C
C
C
CONTENTS
ONTENTS
ONTENTS
ONTENTS
Sr.
No.
TITLE & NAME OF THE AUTHOR (S)
Page No.
1
.
FORCASTING OF FINANCIAL MARKETS - APPLICATION OF FUZZY ASSOCIATION RULESBHAGIRATHI NAYAK, DR. C. NAHAK & DR. ARUN KR. MISRA
1
2
.
PERCEIVED QUALITY OF SERVICES RENDERED BY UNIVERSITY LIBRARY: A CASE STUDY OF PANJAB UNIVERSITY MAIN LIBRARY, CHANDIGARH, INDIADR. TESFATSION SAHLU DESTA
9
3
.
DYNAMIC COMPENSATION SYSTEM FOR PAKISTANRABIA MUSHTAQ
20
4
.
DESIGN AND IMPLEMENTATION OF EXAMPLE BASED ENGLISH-HINDI MACHINE TRANSLATION SYSTEMVIVEK DUBEY & DR. H. R. SHARMA
26
5
.
INDIAN TELECOMMUNICATION SECTOR: A PARADIGM SHIFTDR. HARSH DWIVEDI & KAVYA SAINI
29
6
.
A STUDY ON CONSTRUCTION OF EQUITY PORTFOLIO (OIL, IT, STEEL AND BANKING STOCKS) WITH REFERENCE TO THE SHARPE INDEX MODELP.VARADHARAJAN & DR. P VIKKRAMAN
38
7
.
A STUDY ON ECONOMIC EMPOWERMENT OF WOMEN THROUGH SELF HELP GROUPS IN MAHABUBNAGAR DISTRICT OF ANDHRA PRADESHM V S MAHENDRA, S ANANDA REDDY & M S BHAT
44
8
.
A STUDY ON THE RELATIONSHIP BETWEEN GOLD, SILVER AND NIFTYR.KARTHIKEYAN & DR. M. G. SARAVANARAJ
50
9
.
TV VIEWING PRACTICES OF INDIAN CHILDRENDR. PAVLEEN KAUR & DR. RAGHBIR SINGH
66
10
.
TOURISM POTENTIAL IN VELLORE REGION - AN EMPIRICAL STUDYDR. D. ASHOK
71
11
.
A STUDY ON STEPS TAKEN TO INPROVE CREDIT AND SAVINGS IN RURAL INDIADR. P. UMA RANI
73
12
.
HEALTHCARE SERVICES IN INDIA: A STRATEGIC PERSPECTIVEDR. PRESHTH BHARDWAJ & DR. JAYRAJ D. JADEJA
78
13
.
INCREASING WOMEN EMPLOYMENT IN IT INDUSTRY: AN ANALYSIS OF REASONSS. ANNAPOORNA & S. T. BAGALKOTI
87
14
.
IMPACT OF ORGANIZATIONAL CLIMATE, ROLE AMBIGUITY AND ROLE CONFLICT ON ORGANIZATIONAL COMMITMENT AMONG THE FACULTY IN ENGINEERING COLLEGESDR. T. G. VIJAYA & R. HEMAMALINI
90
15
.
PERFORMANCE APPRAISAL SYSTEM IN INCOME TAX DEPARTMENT: A CASE STUDYDR. TEJ SINGH & DR. RAJIV RATAN
95
16
.
ROBUST AWARENESS ON INDIAN INSURANCE INDUSTRY IN TIER THREE CITIESDR. T.V. MALICK, DR. V. SELVAM & N. ABDUL NAZAR
101
17
.
AWARENESS AND PERCEPTIONS OF E-BANKING CUSTOMERS IN CHHATTISGARH (INDIA)A. K. CHANDRA & D. K. GANGESHWAR
105
18
.
COMPARATIVE STUDY OF PARAMETRIC AND NON-PERAMETRIC VALUE AT RISK (VaR) METHODSVIKRANT VIKRAM SINGH, ANOOP MOHANTY & SUMIT GOYAL
109
19
.
A STUDY TO DETERMINE THE EFFECTIVENESS OF THE TRAINING PROGRAMMES AT ONE OF THE NAVRATNA COMPANY IN ELECTRONIC INDUSTRYDR. R. PADMAJA
118
20
.
IMPLEMENTATION OF CRM WITH INFORMATION TECHNOLOGY IN HIGHER EDUCATIONDR. NARINDER TANWAR
125
21
.
PERFORMANCE ANALYSIS OF SOFTWARE INDUSTRIES THROUGH VALUE ADDED APPROACH - AN EMPIRICAL STUDY ON INFOSYS LTD.DR. R. KRISHNAKUMAR
129
22
.
TECHNOLOGICAL SERVICES IN RURAL BANKING: A STUDY WITH REFERENCE TO BANK BRANCHES IN TIRUNELVELI DISTRICTD. DEVANDHIRAN & SREEHARI .R
133
23
.
VICKS VAPORUB - MOTHER’S TOUCH THERAPY: A CASE STUDYRAJNI KAMBOJ
141
24
.
THE RELATIONSHIP BETWEEN LOCUS OF CONTROL AND ROLE STRESS AMONG ENGINEERS AND PERSONNELR. SUBASREE
144
25
.
THE LEGAL LACUNAS OF AN INDIAN CORPORATION’S CRIMINAL LIABILITYDR. SHRUTI BEDI
149
VOLUME NO. 1 (2011), ISSUE NO. 5 (OCTOBER) ISSN 2231-5756
INTERNATIONAL JOURNAL OF RESEARCH IN COMMERCE, IT & MANAGEMENT
CHIEF PATRON
CHIEF PATRON
CHIEF PATRON
CHIEF PATRON
PROF. K. K. AGGARWAL
Chancellor, Lingaya’s University, Delhi
Founder Vice-Chancellor, Guru Gobind Singh Indraprastha University, Delhi
Ex. Pro Vice-Chancellor, Guru Jambheshwar University, Hisar
PATRON
PATRON
PATRON
PATRON
SH. RAM BHAJAN AGGARWAL
Ex. State Minister for Home & Tourism, Government of Haryana
Vice-President, Dadri Education Society, Charkhi Dadri
President, Chinar Syntex Ltd. (Textile Mills), Bhiwani
CO
CO
CO
CO----ORDINATOR
ORDINATOR
ORDINATOR
ORDINATOR
AMITA
Faculty, E.C.C., Safidon, Jind
ADVISORS
ADVISORS
ADVISORS
ADVISORS
PROF. M. S. SENAM RAJU
Director A. C. D., School of Management Studies, I.G.N.O.U., New Delhi
PROF. M. N. SHARMA
Chairman, M.B.A., Haryana College of Technology & Management, Kaithal
PROF. S. L. MAHANDRU
Principal (Retd.), Maharaja Agrasen College, Jagadhri
EDITOR
EDITOR
EDITOR
EDITOR
PROF. R. K. SHARMA
Dean (Academics), Tecnia Institute of Advanced Studies, Delhi
CO
CO
CO
CO----EDITOR
EDITOR
EDITOR
EDITOR
DR. BHAVET
Faculty, M. M. Institute of Management, Maharishi Markandeshwar University, Mullana, Ambala, Haryana
EDITORIAL ADVISORY BOARD
EDITORIAL ADVISORY BOARD
EDITORIAL ADVISORY BOARD
EDITORIAL ADVISORY BOARD
DR. AMBIKA ZUTSHI
Faculty, School of Management & Marketing, Deakin University, Australia
DR. VIVEK NATRAJAN
Faculty, Lomar University, U.S.A.
DR. RAJESH MODI
Faculty, Yanbu Industrial College, Kingdom of Saudi Arabia
PROF. SANJIV MITTAL
University School of Management Studies, Guru Gobind Singh I. P. University, Delhi
PROF. ANIL K. SAINI
Chairperson (CRC), Guru Gobind Singh I. P. University, Delhi
DR. KULBHUSHAN CHANDEL
Reader, Himachal Pradesh University, Shimla
DR. TEJINDER SHARMA
VOLUME NO. 1 (2011), ISSUE NO. 5 (OCTOBER) ISSN 2231-5756
INTERNATIONAL JOURNAL OF RESEARCH IN COMMERCE, IT & MANAGEMENT
DR. SAMBHAVNA
Faculty, I.I.T.M., Delhi
DR. MOHENDER KUMAR GUPTA
Associate Professor, P. J. L. N. Government College, Faridabad
DR. SHIVAKUMAR DEENE
Asst. Professor, Government F. G. College Chitguppa, Bidar, Karnataka
MOHITA
Faculty, Yamuna Institute of Engineering & Technology, Village Gadholi, P. O. Gadhola, Yamunanagar
ASSOCIATE EDITORS
ASSOCIATE EDITORS
ASSOCIATE EDITORS
ASSOCIATE EDITORS
PROF. NAWAB ALI KHAN
Department of Commerce, Aligarh Muslim University, Aligarh, U.P.
PROF. ABHAY BANSAL
Head, Department of Information Technology, Amity School of Engineering & Technology, Amity University, Noida
PROF. A. SURYANARAYANA
Department of Business Management, Osmania University, Hyderabad
DR. ASHOK KUMAR
Head, Department of Electronics, D. A. V. College (Lahore), Ambala City
DR. JATINDERKUMAR R. SAINI
Head, Department of Computer Science, S. P. College of Engineering, Visnagar, Mehsana, Gujrat
DR. V. SELVAM
Divisional Leader – Commerce SSL, VIT University, Vellore
DR. PARDEEP AHLAWAT
Reader, Institute of Management Studies & Research, Maharshi Dayanand University, Rohtak
S. TABASSUM SULTANA
Asst. Professor, Department of Business Management, Matrusri Institute of P.G. Studies, Hyderabad
TECHNICAL ADVISOR
TECHNICAL ADVISOR
TECHNICAL ADVISOR
TECHNICAL ADVISOR
AMITA
Faculty, E.C.C., Safidon, Jind
MOHITA
Faculty, Yamuna Institute of Engineering & Technology, Village Gadholi, P. O. Gadhola, Yamunanagar
FINANCIAL ADVISORS
FINANCIAL ADVISORS
FINANCIAL ADVISORS
FINANCIAL ADVISORS
DICKIN GOYAL
Advocate & Tax Adviser, Panchkula
NEENA
Investment Consultant, Chambaghat, Solan, Himachal Pradesh
LEGAL ADVISORS
LEGAL ADVISORS
LEGAL ADVISORS
LEGAL ADVISORS
JITENDER S. CHAHAL
Advocate, Punjab & Haryana High Court, Chandigarh U.T.
CHANDER BHUSHAN SHARMA
Advocate & Consultant, District Courts, Yamunanagar at Jagadhri
SUPERINTENDEN
SUPERINTENDEN
SUPERINTENDEN
SUPERINTENDENT
T
T
T
VOLUME NO. 1 (2011), ISSUE NO. 5 (OCTOBER) ISSN 2231-5756
INTERNATIONAL JOURNAL OF RESEARCH IN COMMERCE, IT & MANAGEMENT
CALL FOR MANUSCRIPTS
CALL FOR MANUSCRIPTS
CALL FOR MANUSCRIPTS
CALL FOR MANUSCRIPTS
We
invite unpublished novel, original, empirical and high quality research work pertaining to recent developments & practices in
the area of Computer, Business, Finance, Marketing, Human Resource Management, General Management, Banking, Insurance,
Corporate Governance and emerging paradigms in allied subjects like Accounting Education; Accounting Information Systems;
Accounting Theory & Practice; Auditing; Behavioral Accounting; Behavioral Economics; Corporate Finance; Cost Accounting;
Econometrics; Economic Development; Economic History; Financial Institutions & Markets; Financial Services; Fiscal Policy;
Government & Non Profit Accounting; Industrial Organization; International Economics & Trade; International Finance; Macro
Economics; Micro Economics; Monetary Policy; Portfolio & Security Analysis; Public Policy Economics; Real Estate; Regional
Economics; Tax Accounting; Advertising & Promotion Management; Business Education; Business Information Systems (MIS);
Business Law, Public Responsibility & Ethics; Communication; Direct Marketing; E-Commerce; Global Business; Health Care
Administration; Labor Relations & Human Resource Management; Marketing Research; Marketing Theory & Applications;
Non-Profit Organizations; Office Administration/Management; Operations Research/Statistics; Organizational Behavior & Theory;
Organizational Development; Production/Operations; Public Administration; Purchasing/Materials Management; Retailing;
Sales/Selling; Services; Small Business Entrepreneurship; Strategic Management Policy; Technology/Innovation; Tourism,
Hospitality & Leisure; Transportation/Physical Distribution; Algorithms; Artificial Intelligence; Compilers & Translation; Computer
Aided Design (CAD); Computer Aided Manufacturing; Computer Graphics; Computer Organization & Architecture; Database
Structures & Systems; Digital Logic; Discrete Structures; Internet; Management Information Systems; Modeling & Simulation;
Multimedia; Neural Systems/Neural Networks; Numerical Analysis/Scientific Computing; Object Oriented Programming;
Operating Systems; Programming Languages; Robotics; Symbolic & Formal Logic; Web Design. The above mentioned tracks are
only indicative, and not exhaustive.
Anybody can submit the soft copy of his/her manuscript
anytime
in M.S. Word format after preparing the same as per our
submission guidelines duly available on our website under the heading guidelines for submission, at the email addresses,
or
.
GUIDELINES FOR SUBMISSION OF MANUSCRIPT
GUIDELINES FOR SUBMISSION OF MANUSCRIPT
GUIDELINES FOR SUBMISSION OF MANUSCRIPT
GUIDELINES FOR SUBMISSION OF MANUSCRIPT
1. COVERING LETTER FOR SUBMISSION:
DATED: _____________
THE EDITOR
IJRCM
Subject:
SUBMISSION OF MANUSCRIPT IN THE AREA OF .
(e.g. Computer/IT/Finance/Marketing/HRM/General Management/other, please specify)
.
DEAR SIR/MADAM
Please find my submission of manuscript titled ‘___________________________________________’ for possible publication in your journal. I hereby affirm that the contents of this manuscript are original. Furthermore it has neither been published elsewhere in any language fully or partly, nor is it under review for publication anywhere.
I affirm that all author (s) have seen and agreed to the submitted version of the manuscript and their inclusion of name (s) as co-author (s).
Also, if our/my manuscript is accepted, I/We agree to comply with the formalities as given on the website of journal & you are free to publish our contribution to any of your journals.
NAME OF CORRESPONDING AUTHOR: Designation:
VOLUME NO. 1 (2011), ISSUE NO. 5 (OCTOBER) ISSN 2231-5756
INTERNATIONAL JOURNAL OF RESEARCH IN COMMERCE, IT & MANAGEMENT
Residential address with Pin Code: Mobile Number (s):
Landline Number (s): E-mail Address: Alternate E-mail Address:
2. INTRODUCTION: Manuscript must be in British English prepared on a standard A4 size paper setting. It must be prepared on a single space and single column with 1” margin set for top, bottom, left and right. It should be typed in 8 point Calibri Font with page numbers at the bottom and centre of the every page.
3. MANUSCRIPT TITLE: The title of the paper should be in a 12 point Calibri Font. It should be bold typed, centered and fully capitalised.
4. AUTHOR NAME(S) & AFFILIATIONS: The author (s) full name, designation, affiliation (s), address, mobile/landline numbers, and email/alternate email address should be in italic & 11-point Calibri Font. It must be centered underneath the title.
5. ABSTRACT: Abstract should be in fully italicized text, not exceeding 250 words. The abstract must be informative and explain the background, aims, methods, results & conclusion in a single para.
6. KEYWORDS: Abstract must be followed by list of keywords, subject to the maximum of five. These should be arranged in alphabetic order separated by commas and full stops at the end.
7. HEADINGS: All the headings should be in a 10 point Calibri Font. These must be bold-faced, aligned left and fully capitalised. Leave a blank line before each heading.
8. SUB-HEADINGS: All the sub-headings should be in a 8 point Calibri Font. These must be bold-faced, aligned left and fully capitalised. 9. MAIN TEXT: The main text should be in a 8 point Calibri Font, single spaced and justified.
10. FIGURES &TABLES: These should be simple, centered, separately numbered & self explained, and titles must be above the tables/figures. Sources of data should be mentioned below the table/figure. It should be ensured that the tables/figures are referred to from the main text.
11. EQUATIONS: These should be consecutively numbered in parentheses, horizontally centered with equation number placed at the right.
12. REFERENCES: The list of all references should be alphabetically arranged. It must be single spaced, and at the end of the manuscript. The author (s) should mention only the actually utilised references in the preparation of manuscript and they are supposed to follow Harvard Style of Referencing. The author (s) are supposed to follow the references as per following:
•
All works cited in the text (including sources for tables and figures) should be listed alphabetically.•
Use (ed.) for one editor, and (ed.s) for multiple editors.•
When listing two or more works by one author, use --- (20xx), such as after Kohl (1997), use --- (2001), etc, in chronologically ascending order.•
Indicate (opening and closing) page numbers for articles in journals and for chapters in books.•
The title of books and journals should be in italics. Double quotation marks are used for titles of journal articles, book chapters, dissertations, reports, working papers, unpublished material, etc.•
For titles in a language other than English, provide an English translation in parentheses.•
The location of endnotes within the text should be indicated by superscript numbers.PLEASE USE THE FOLLOWING FOR STYLE AND PUNCTUATION IN REFERENCES: BOOKS
•
Bowersox, Donald J., Closs, David J., (1996), "Logistical Management." Tata McGraw, Hill, New Delhi.•
Hunker, H.L. and A.J. Wright (1963), "Factors of Industrial Location in Ohio," Ohio State University.CONTRIBUTIONS TO BOOKS
•
Sharma T., Kwatra, G. (2008) Effectiveness of Social Advertising: A Study of Selected Campaigns, Corporate Social Responsibility, Edited by David Crowther & Nicholas Capaldi, Ashgate Research Companion to Corporate Social Responsibility, Chapter 15, pp 287-303.JOURNAL AND OTHER ARTICLES
•
Schemenner, R.W., Huber, J.C. and Cook, R.L. (1987), "Geographic Differences and the Location of New Manufacturing Facilities," Journal of Urban Economics, Vol. 21, No. 1, pp. 83-104.CONFERENCE PAPERS
•
Garg Sambhav (2011): "Business Ethics" Paper presented at the Annual International Conference for the All India Management Association, New Delhi, India, 19–22 June.UNPUBLISHED DISSERTATIONS AND THESES
•
Kumar S. (2011): "Customer Value: A Comparative Study of Rural and Urban Customers," Thesis, Kurukshetra University, Kurukshetra.ONLINE RESOURCES
•
Always indicate the date that the source was accessed, as online resources are frequently updated or removed.WEBSITE
VOLUME NO. 1 (2011), ISSUE NO. 5 (OCTOBER) ISSN 2231-5756
INTERNATIONAL JOURNAL OF RESEARCH IN COMMERCE, IT & MANAGEMENT
FORCASTING OF FINANCIAL MARKETS - APPLICATION OF FUZZY ASSOCIATION RULES
BHAGIRATHI NAYAK
RESEARCH SCHOLAR
NORTH ORISSA UNIVERSITY
BARIPADA, ORISSA
DR. C. NAHAK
ASSOCIATE PROFESSOR
DEPARTMENT OF MATHEMATICS
INDIAN INSTITUTE OF TECHNOLOGY KHARAGPUR
KHARAGPUR - 721 302
DR. ARUN KR. MISRA
ASST. PROFESSOR
VINOD GUPTA SCHOOL OF MANAGEMENT
INDIAN INSTITUTE OF TECHNOLOGY KHARAGPUR
KHARAGPUR - 721 302
ABSTRACT
The article has been designed to forecast financial market indicators using rule based fuzzy system. The fuzzy system has been applied on Gold commodity future market, Carbon credit and CNX Nifty Index. The report is devoted to articulate the impact of rule based fuzzy system for forecasting the above mentioned parameters. Fuzzy rule have been designed by considering the standard deviation of the above parameters as a rule input variable and is applied on the moving average of 2 days, 7 days and 15 days of the input variable that is the future commodity gold prices, carbon credit and the CNX Nifty Index. Around 42 rules have been designed by considering the bullish, bearish, near bullish, near bearish and active bullish and active bearish etc. The article effectively forecast future gold price and the bullish and bearish nature of market. It also forecast the Index along the cycle of bullish and bearish. In-sample prediction has supported the rule based fuzzy system as an effective methodology of forecasting.
KEYWORDS
Commodity Future Market, Fuzzy Association Rules, Fuzzy Inference System, Financial Market Forecasting.
INTRODUCTION
he article primarily discusses financial market forecasting using fuzzy system based association rules. The fuzzy system has been applied on Gold futures, Carbon credit and CNX Nifty Index. The fuzzy logic based inference system design to capture the historical movements of above parameters. The inference system has been designed to capture the time-varying volatility and factor the variability for the prediction of financial prices. In place of single input series, the study has used multiple input series of the same data through different periods of moving averages and factored the variability with time-varying volatility. Fuzzy rules have been designed by considering the standard deviation of the above parameters as a rule input variable and is applied on the moving averages of 2 days, 7 days and 15 days of the input variable that is the future gold prices, carbon credit and the CNX Nifty Index. Around 42 rules have been designed by considering the bullish, bearish, near bullish, near bearish and active bullish and active bearish etc. The outcome of the study is quite impressive as the prediction is significant. The model can also be used for prediction of other financial parameters.
FUZZY LOGIC IN FINANCE
Fuzzy systems have been widely used in expert systems, machinery, home appliances and robotics. Recently, applications in the finance field have also been reported, exploiting the ability of fuzzy systems to model the vague and imprecise information. Fuzzy systems have been used with various technical indicators in previous studies. It shows that the returns generated with the fuzzy systems are significantly larger than linear regression models, neural networks and other investment strategies. The results combining technical analysis and fuzzy logic were very promising. Since different artificial intelligence methods have different strengths and limitations, hybrid systems have also been studied to obtain synergetic combinations of methods models and architectures. In particular, combinations of fuzzy systems with neural networks and/or genetic algorithms appear to be popular in real-world implementations.
Traditionally science, engineering and mathematics showed virtually no interest in studying uncertainty. It was considered undesirable and the idea was to eliminate it. In fact, eliminating uncertainty was considered as one of the manifestations of progress. This attitude towards uncertainty was prevalent in the 19th century and faced serious challenges by the advent of probability theory in the early half of the 20th century. When constructing a system for some given purpose, one’s ultimate goal is to obtain a system that is as useful as possible for the given purpose. This implies that a system should be a proper mixture of the three fundamental characteristics of systems: credibility, complexity and uncertainty. Ideal we would want a system of high credibility, low complexity and low uncertainty. Unfortunately these three ideas conflict with one other. Thus to achieve a system with better performance we need to reach a tradeoff between these three characteristics.
The relationship between credibility, complexity and uncertainty is quite intricate and has not yet been fully understood. However, it is already well established that uncertainty has a pivotal role in any effort to maximize the usefulness of constructed systems. Although usually undesired in system, when considered alone, it becomes very valuable when considered in connection with credibility and complexity. A slight increase in relevant uncertainty may often significantly reduce complexity and at the same time increase credibility of the system. Uncertainty is thus an important commodity in the knowledge business, a commodity that can be traded for gains in other essential characteristics of systems by which we represent knowledge. Because of this important role, uncertainty started being no longer viewed in science and engineering as an unavoidable plague , but rather as an important resource that allows us to deal effectively with problems with systems involving complexity.
By the early half of the 20th century it was believed that only probability theory can be applied to fully capture the essence of uncertainty. The equivalence of probability and uncertainty was challenged in the latter half of the 20th century by an important generalization in mathematics, namely, the fuzzy set theory which was introduced by L. Zadeh in 1965. In the fuzzy set theory, the requirement of sharp boundaries as in the classical sets is abandoned. This implies that the membership of an object in a fuzzy set in not a matter of ‘present’ or ‘absent’ as in classical sets but is a matter of degree.
VOLUME NO. 1 (2011), ISSUE NO. 5 (OCTOBER) ISSN 2231-5756
INTERNATIONAL JOURNAL OF RESEARCH IN COMMERCE, IT & MANAGEMENT
Fuzzy logic is now a well established tool in the field of engineering, but its application in finance is still less developed.
FUZZY LOGIC BASICS
Fuzzy Logic was initiated in 1965 by Lotfi A. Zadeh, professor of computer science at the University of California in Berkeley. Basically, Fuzzy Logic (FL) is a multivalued logic that allows intermediate values to be defined between conventional evaluations like true/false, yes/no, high/low, etc. Notions like rather tall or very fast can be formulated mathematically and processed by computers, in order to apply a more human−like way of thinking in the programming of computers. Fuzzy systems are an alternative to traditional notions of set membership and logic that has its origins in ancient Greek philosophy. The precision of mathematics owes its success in large part to the efforts of Aristotle and the philosophers who preceded him. In their efforts to devise a concise theory of logic, and later mathematics, the so−called "Laws of Thought" were posited. One of these, the "Law of the Excluded Middle," states that every proposition must either be True or False. Even when Parminedes proposed the first version of this law (around 400 B.C.) there were strong and immediate objections: for example, Heraclitus proposed that things could be simultaneously True and not True. It was Plato who laid the foundation for what would become fuzzy logic, indicating that there was a third region (beyond True and False) where these opposites "tumbled about." Other, more modern philosophers echoed his sentiments, notably Hegel, Marx, and Engels. But it was Lukasiewicz who first proposed a systematic alternative to the bi−valued logic of Aristotle.
Fuzzy Logic has now emerged as a profitable tool for the controlling and steering of systems and complex industrial processes, as well as for household and entertainment electronics, as well as for other expert systems and applications like the classification of satellite data and application in various pure sciences.
LITERATURE REVIEW
As financial forecasting has been addressed for such a long time period, the number of proposed method is tremendously large. Statistical linear models such as the linear regression, the autoregressive model (Yule, 1927), the moving average and autoregressive moving average (Box et al., 1994) have dominated for decades. But statistical linear models have inferior performance because the dynamic of financial time series are strongly nonlinear (Ql and Maddala, 1999). More sophisticated nonlinear models such as the bilinear model (Granger and Anderson, 1984), the threshold autoregressive model (Tong and Lim, 1980), the smoothing transition autoregressive model (Chan and Tomg, 1986) and the autoregressive conditional heteroscadastic model (Eagle, 1982) were also developed and applied to forecast financial time series. However, nonlinear statistical models are limited in that they make strong assumptions about the properties of the data, thus introducing a high degree of bias in to the models. The emergence of artificial intelligence techniques has seen their enormous application to financial forecasting, such as expert systems (Tsaih et al., 1998), genetic algorithms (Bauer, 1994), fuzzy logic (hiemstra, 1994), wavelets (Bjorn, 1995; Pan and Wang, 1998), chaos theory (Trippi, 1995) and neural networks (Chou et al., 1996; Kryzanowski et al., 1993; Mani et al., 1995; Pi and Rognavldsson, 1995). Among them, neural networks are the most popular and successful tools. There is extensive literature about the application of neural networks in financial forecasting (Azoff, 1994; Beastaens et al., 1995; Goonatilake and Treleaven, 1995; References, 1995; Trippi and Turban, 1994; Turban and Trippi, 1992; Van 1996; Wong and Selvi, 1998). One of the most popular Journals published on the application of neural networks in finance is the Journal of Computational Intelligence in Finance. Various applications of neural networks in financial forecasting range from options price (Barucci et al. 1996; English and Mayhew, 1995; Lajbcygier et al., 1995; Yao et al., 2000), foreign exchange rate (Green and Pearson, 1995; Hwa and Seng, 1995; Lee, 1995; Staley and Peter, 1995; Yao and Tan, 2000; Yao et al., 1996; Zhang and Michael, 1998), stock price and index (Abecasis and Lapenta, 1997; Kohara et al.; 1996; Schoneburg, 1990; White 1988; Wittkemper and Steiner, 1996), mutual fund (Chiang et al., 1996), interest rate (Guenther, 1995; Steven and Noh, 1997), commodity price and index (Edelman et al., 1999; Grudnitski and Osburn, 1993), treasury bond (Cheng et al., 1996), and emergent markets (Jang and Lai, 1994; Siriopoulos et al., 1995).
METHODOLOGY
The fuzzy rule used in the model uses variance as rule based parameter for designing different rules. Different days moving average considered as input variable along with variance as the rule based variable.Fuzzy rules have been designed by considering the standard deviation of the above parameters as a rule input variable and are applied on the moving average of 2 day, 7 days and 15 days of the input variable that is the future commodities like Gold and Carbon. It is also applied on CNX Nifty Index for equity price forecasting. Around 42 rules have been designed by considering the bullish, bearish, near bullish, near bearish and active bullish and active bearish etc. Investors generally invest in financial market my looking in to future perspective yield over a medium and long time periods. This calls for preparing a forecasting model by factoring the medium and long term returns into the current yield. Using this, the study has made a fuzzy based association rules by relating the current yield with the moving averages yields of 2days, 7days and 15days. This fuzzy association model provides ideal framework for forecasting financial markets prices by developing fuzzy association rules based logic. The study has considered current yield, its volatility and the moving averages of returns for above mentioned days as inputs and involving these inputs about 35 fuzzy association rules based logic to forecast financial market prices. Various Logics have been developed to capture the bullish and bearish trends of financial markets prices.
INPUT DATA FOR THE FUZZY INFERENCE SYSTEM
(FIS)
Real time data of commodity prices of Gold and Carbon taken from the NCDEX Exchange India. Both Gold and Carbon are being most traded and active commodities and are always high on demand. Hence the selection of the commodities are taken since its price variation are very much reflected in most of the factors of economy as whole as very much affected by the financial market and stock prices of the Trading Exchange. While prices for many physical commodities tend to revolve around supply-demand data, Gold and Carbon need to be treated more like a financial market that responds to fear and anxiety. Both Commodities prices typically move higher in times of crisis and panic. Gold and Carbon prices usually move higher during periods of high inflation, which tend to bring on higher interest rates. Gold and Carbon futures prices also have an inverse relationship with the price of the U.S. dollar.
S&P CNX Nifty is a well diversified 50 stock index accounting for 21 sectors of the economy. It is used for a variety of purposes such as benchmarking fund portfolios, index based derivatives and index funds. The study also forecast needs future movements using the Fuzzy based Association Rules.
Moving average of the Average day futures prices is taken in case of Gold future for 2 day, 7 days, and 15 days. For each of the moving average future price we analyse the variance, its fluctuation range, and its bearish and bullish trend is observed. For CNX Nifty Index we consider Return from moving average value of the Index
The bearish and bullish trend is classified into three different categories:
• Active bearish
• New bearish
• Mild bearish
• Active bullish
• New bullish
• Mild bullish
Daily data for 3 years have been considered to forecast the future prices/returns using the 35 fuzzy association rules based logic.
ASSOCIATION RULES
VOLUME NO. 1 (2011), ISSUE NO. 5 (OCTOBER) ISSN 2231-5756
INTERNATIONAL JOURNAL OF RESEARCH IN COMMERCE, IT & MANAGEMENT
primary inputs. The fuzzy association rule based logic has been developed considering the primary inputs and co-occurrence inputs are the associated variables. The logic is depicted below.
FIGURE 1: FUZZY ASSOCIATION RELATION
R0
R2 R7 R15
+ + + R0 R0 R0
σ0 σ0 σ0
Input Output R0
σ0
R2
From each input set will provide a particular level of output and the objective of the fuzzy rules based association is to find that input set which provides the optimum level of output.
The objective of this thesis was to setup up a fuzzy inference system so as to predict the future price of Gold, Carbon and the Return on CNX Nifty Index. Data from the Commodity Market (NCDEX) and actual CNX Nifty Index for the past 3 years has been analyzed. The shape of the membership function, number of fuzzy regions and the fuzzy terms are defined for the data. Here mainly triangular membership functions are made using the Gaussian function. The fuzzy membership functions are the same for the inputs and the outputs. Two cases were taken, one with 5 membership functions and another with 3 membership functions. Fuzzy terms used for the 6 membership functions were (active bearish, new bearish, mild bearish, mild bullish, new bullish, active bullish) and for the 3 membership function case.
FIGURE 2: 6 TRIANGULAR MEMBERSHIP FUNCTIONS
FIGURE 3: 3 MEMBERSHIP FUNCTIONS INPUT /OUTPUT
VOLUME NO. 1 (2011), ISSUE NO. 5 (OCTOBER) ISSN 2231-5756
INTERNATIONAL JOURNAL OF RESEARCH IN COMMERCE, IT & MANAGEMENT
1. The space associated with each fuzzy term over the universal discourse for each variable was then calculated and divided evenly over the 5/9 membership functions.
2. For each available core data a fuzzy rule was established. For self generation of the rules, certain MATLAB codes were written which took the data as input and gave output the rule from that given input-output pair. The idea is to 1st divide the input output space into fuzzy regions. The fuzzy rule was established by
directly mapping the physical value of the variable to the corresponding fuzzy membership function. Most of the time for a given value, it always falls into more than one fuzzy region. In such a case the value was assigned to the fuzzy region with maximum degree
3. These steps were repeated for the entire given core data and a rule were established for each of the dataset. 4. These set of rules along with the centroid defuzzification method form the Fuzzy Inference System.
GOLD MARKET IN INDIA
India is the largest importer of gold jewellery contributing to 25% of world’s gold demand. It imports about 663 tonnes of gold annually mainly in the form of small cast bars known as TT bars or biscuits. India is also the largest consumer of gold worldwide.
Gold trading has existed for centuries and has been a keystone for economies throughout history, continuing to have global financial impacts today. Goldhas not only been a means of exchange but also is regarded as a store of value and an excellent hedge against inflation. In addition to being a monetary commodity, goldhas a number of uses in jewellery, dentistry, etc. andis also an important industrial commodity because it is an excellent conductor of electricity and is extremely resistant to corrosion, making it critically important in electronics and other high-tech applications. Gold is one of those markets that provide a wide range of viable investment vehicles for almost any type of investor. In addition to the physical gold itself in the form of gold bullionor gold coins, investors can express their opinions about the outlook for gold prices ingold futuresand options, stocks of companies involved in metals and mining including the gold mining penny stocks and gold exchange-traded funds.
The price of gold depends on a host of factors, which makes it very difficult to predict. In a fashion similar to shares, gold is an asset class by itself. In fact, in many villages and small towns of India, gold is preferred to bank deposits as a savings and investment instrument. Till few years ago, to gain from price volatility, one would have to hoard and trade in gold physically. Not any more, however. With the commodity futures market operating in full swing, one has the option of not physically stocking gold to gain from its price movements.
CARBON MARKET IN INDIA
India may be the leader in the number of carbon credits issued so far and the number of clean development (CDM) projects registered with international CDM body, but it already lags behind China in the volume of average annual credits expected till 2012. India has cornered nearly 43% of the Carbon credits (CERS) issued so far by the CDM executive board, the highest international body under the Kyoto Protocol to register projects and issue credits. In comparison, only 17% of the CERs have been issued to China. But the expected average annual CERs from registered projects till 2012 has China (44%) far ahead of India (15%), although India, with 259 projects, leads China (101) in the number of registered projects. Carbon credits, or CERs (Carbon Emission Reductions), are tradable credits earned for investing in projects aimed at reducing greenhouse gas emissions. One CER is equivalent to one tonne of carbon dioxide reduced. Under the Kyoto Protocol, governments and companies in the European Union can use these credits to offset their carbon emissions and meet part of their reduction targets. Carbon credits are generated mainly in the developing countries because of the lower project cost. “Indian companies have mainly concentrated on renewable energy (biomass, wind power, etc.) or waste heat recovery projects that generate much less CERs compared with the Chinese who have several projects in high CER-yielding HFC23 projects. Each tonne of HFC23, a by-product of the refrigerant gases production process, is equivalent to 11,700 tonnes of carbon dioxide. Naturally, destroying small quantity of HFC23 can fetch a very large volume of CERs. Also, these projects attract more investments since they are relatively cheap to execute and earn more credit.
S&P CNX NIFTY
The 50 or S&P CNX Nifty nicknamed Nifty 50 or simply Nifty (NSE: ^NSEI), is the leading index for large companies on the National Stock Exchange of India. The Nifty is a well diversified 50 stock index accounting for 22 sectors of the economy. It is used for a variety of purposes such as benchmarking fund portfolios, index based derivatives and index funds S&P CNX Nifty is owned and managed by India Index Services and Products Ltd. (IISL), which is a joint venture between NSE and CRISIL. IISL is India's first specialised company focused upon the index as a core product. IISL has Marketing and licensing agreement with Standard & Poor's (S&P), who world leaders are in index services.
• The total traded value for the last six months of all Nifty stocks is approximately 65.68% of the traded value of all stocks on the NSE
• Nifty stocks represent about 65.34% of the total market capitalization as on Mar 31, 2009.
• Impact cost of the S&P CNX Nifty for a portfolio size of Rs.2 crore is 0.16%
VOLUME NO. 1 (2011), ISSUE NO. 5 (OCTOBER) ISSN 2231-5756
INTERNATIONAL JOURNAL OF RESEARCH IN COMMERCE, IT & MANAGEMENT
RESULTS AND DISCUSSION
Following the above mentioned steps the following FIS has been setup for Gold Future.
FUZZY INFERENCE SYSTEM USING MATLAB
FIGURE 4: FUZZY INFERENCE SYSTEM OF GOLD
FIGURE 5: FUZZY INFERENCE SYSTEM RULES OF GOLD
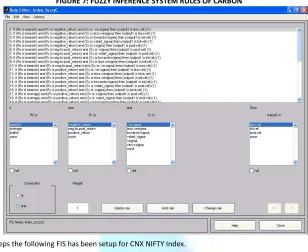
Following the above mentioned steps the following FIS has been setup for Carbon Future.
VOLUME NO. 1 (2011), ISSUE NO. 5 (OCTOBER) ISSN 2231-5756
INTERNATIONAL JOURNAL OF RESEARCH IN COMMERCE, IT & MANAGEMENT
FIGURE 7: FUZZY INFERENCE SYSTEM RULES OF CARBON
Following the above mentioned steps the following FIS has been setup for CNX NIFTY Index.
FIGURE 8: FUZZY INFERENCE SYSTEM OF CNX NIFTY
VOLUME NO. 1 (2011), ISSUE NO. 5 (OCTOBER) ISSN 2231-5756
INTERNATIONAL JOURNAL OF RESEARCH IN COMMERCE, IT & MANAGEMENT
Gold commodity future13000 13500 14000 14500 15000 15500 16000 16500 17000
1 6 11 16 21 26 31 36 41 46 51 56 61 66 71 76 81
Da ys
P
ri
c
e Series1
Series2
CARBON CREDITS
-100 -80 -60 -40 -20 0 20 40 60 80 100
1 16 31 46 61 76 91 106 121 136 151 166 181 196 211 226 241
DAYS
R
E
T
U
R
N
R0 R2
CNX NIFTY
-500 -400 -300 -200 -100 0 100 200 300 400 500 600
1 32 63 94 125 156 187 218 249 280 311 342 373 404 435 466 497
DAYS
R
E
T
U
R
N R0
R2
RESULT OF THE RULE BASE FORMED IS SHOWN BELOW
The following graph shows the results by overlapping the actual values and the values obtained from the fuzzy inference system. It must be noted that some of the obtained values were at places where no training of the FIS had been performed.
GRAPH 1: OUTPUT FOR GOLD FUTURES (SERIES1- ACTUAL PRICE, SERIES2-FUZZY FORECAST)
GRAPH 2: OUTPUT OF CNX INDEX OF TWO DAYS (R0-ACTUAL PRICE, R2-FUZZY FORECAST)
GRAPH 3: OUTPUT OF CARBON FUTURES OF SEVEN DAYS (R0-ACTUAL PRICE, R2-FUZZY FORECAST)
TABLE 1: FORECASTED VIS-À-VIS ACTUAL
Gold Future Carbon Future CNX –NIFY Index
Closing Price 667.03 Closing Price 324.09 Closing Price 935.08 FR-2 642.50 FR-2 322.28 FR-2 934.29
FR-7 603.96 FR-7 361.25 FR-7 960.42 FR-15 501.45 FR-15 328.31 FR-15 929.52 FR: Forecasting Return
VOLUME NO. 1 (2011), ISSUE NO. 5 (OCTOBER) ISSN 2231-5756
INTERNATIONAL JOURNAL OF RESEARCH IN COMMERCE, IT & MANAGEMENT
CONCLUSION
The study has used fuzzy logic based inference system to capture the historical movements of Gold prices, Carbon future and CNX Index, so as to, predict the future movements. The inferences have been designed to capture the time varying sigma and factor the variability for the prediction of movements. In place of single input series, the study has used multiple input series of same data through different periods of moving averages and factored the variability with time varying sigma. The system, so designed, is quite robust and the predictions are quite accurate once number of input series increases over time. Additional human knowledge or core information can be incorporated in the system easily and quickly in the form of rules without, thus the final mode can also incorporate the core data knowledge as well as any input from an experienced user. It’s easy in use and setting up makes it more meaningful and useful for analysts. The study can further be extended by designing different FIS which can capture the minute cyclical movement of input series by factoring the wavelength of each minute cycle. In place of ‘day closing’ data we can also consider minute-wise/high frequency data to capture the non-linearity of the series movements.
REFERENCES
Agrawal, Rakesh; Imielinski, Tomasz; Swami, Arun (1993): “Mining Association Rules between Sets of Items in Large Databases,” Proceedings of the 1993 ACM SIGMOD International Conference on Management of Data, 22(2), 207-16.
Agrawal, Rakesh; Srikant, Ramakrishnan (1994): “Fast Algorithms for Mining Association Rules,” Proc. 20th Int. Conf. Very Large Data Bases, VLDB. Alex A. Freitas (1998), ”Data Mining and Knowledge Discovery with Evolutionary Algorithm,” Springer.
Alex Berson, Stephen Smith, Kuert Thearling (1999), “Building Data Mining Application for CRM,” Mc Grow –Hill. Bakk. Lukas Helm, Priv. Doz. Dr. Michael Hahsler (2007), “Fuzzy Association Rules An Implementation in R,” Vienna, 2.8.2007. Christer Carlsson, Mario Fedrizzi, Robert Fuller (2004), “Fuzzy Logic in Management,” Kluwer Academic Publishers. Earl Cox (2005), “Fuzzy Modelling and Genetic Algorithms for Data Mining and Exploration,” Elsevier Inc.
Francis Eng-Hock Tay, Francis Tay Eng Hock, Lixiang Shen, Lijuan Cao, “Ordinary shares. exotic methods: Financial Forecasting using Data Mining Techniques,” World Scientific publication.
George J. Klir, Bo Yuan (1995), “Fuzzy Sets and fuzzy Logic Theory and applications,” Prentice Hall PTR.
Gyenesei, A. (2000): “Mining Weighted Association Rules for Fuzzy Quantitative Items,” Proceedings of PKDD Conference, 416-423. http://economictimes.indiatimes.com/India_gets_43_Of_Carbon_Credits/articleshow / 2245328.cms
J.F. Baldwin, (1996), “Knowledge from data using fuzzy methods,” Pattern Recognition Letters, vol. 17, pp 593-600. Kuok, Chan Man; Fu, Ada; Wong, Man Hon (1998), “Mining Fuzzy Association Rules in Databases,” SIGMOD Record Volume 27. L.A. Zadeh, (1968), "Fuzzy algorithms," Info. & Ctl., Vol. 12, pp. 94 -102.
L.A. Zadeh, (1984), "Making computers think like people," IEEE. Spectrum, 8/1984, pp. 26 - 32. L.A. Zadeh, (1965), “Fuzzy Sets,” Information and Control, Vol. 8, pp. 338-353, 1965
L.A. Zadeh, (1973), "Outline of a new approach to the analysis of complex systems and decision processes," IEEE Transactions on Systems, Man, and Cybernetics, Vol. 3, No. 1, pp. 28-44, Jan. 1973.
L.A. Zadeh. (1996), “Fuzzy Logic = Computing With Words,” IEEE Transactions on Fuzzy Systems, Vol. 4, pp. 103-111. IEEE Press, Piscataway, NJ, USA. Maeda, A., Ashida, H., Taniguchi, Y. and Takahashi, Y. (1995), “Data Mining System using Fuzzy Rule Induction,” Proceedings of 1995 IEEE International Conference on Fuzzy Systems.
Rakesh Agrawal, Ramakrishnan Srikant, (1994), “Fast Algorithms for Mining Association Rules in Large Databases,” VLDB, 1994, pp. 487-499.
Sotiris Kotsiantis, Dimitris Kanellopoulos, (2006 ), “Association Rules Mining: A Recent Overview,” GESTS International Transactions on Computer Science and Engineering, Vol.32 (1), pp. 71-82
VOLUME NO. 1 (2011), ISSUE NO. 5 (OCTOBER) ISSN 2231-5756
INTERNATIONAL JOURNAL OF RESEARCH IN COMMERCE, IT & MANAGEMENT
PERCEIVED QUALITY OF SERVICES RENDERED BY UNIVERSITY LIBRARY: A CASE STUDY OF PANJAB
UNIVERSITY MAIN LIBRARY, CHANDIGARH, INDIA
DR. TESFATSION SAHLU DESTA
ASST. PROFESSOR
MEKELLE UNIVERSITY
MEKELLE, ETHIOPIA
ABSTRACT
This study aimed at exploring, analyzing, and measuring the perceived service quality of the Panjab University (PU) main library, as well as to identify the dimensions that determine the customers’ evaluation of service quality. Moreover, the relationship between service quality, customer satisfaction and positive word of mouth was examined. A total of 80 (out of 100 sample) main library users responded the SERVQUAL instrument. After frequency, descriptive, Pearson’s correlation, factor analysis, and Cronbach’s alpha was tested the paired t-test, one-way ANOVA, independent sample t-test, and multivariate regression was employed for hypothesis testing. Its finding revealed the expectation of library users was not met and that the largest gap was found in the empathy. Assurance dimension also had the largest influence on customer satisfaction and overall satisfaction of library customers had a positive effect on their word-of-mouth. Besides, the study revealed almost non-existence of significant mean differences on expectations, perceptions, and rating of the most or least important dimension among the user groups (age, gender, education, and occupation). The study also suggested input from library customers and employees on what constitutes “service excellence” will be useful. The library need to reassess “what customers expect from the library” and provide client specific services. It needs to invest on employee training programs that will provide employees with an understanding of service culture and service excellence-particularly at front line levels. Employee training programs should focus on interpersonal communication and customer care factors in order to be able to meet the customers’ need for personalized service (because empathy is all about human interaction). There were some limitations, to mention few, in conducting the survey: the questionnaire was targeting only 100 main library users (80 responded), and customer expectation and perception explored at the same time with no interval. Thus, the study must be considered as explorative rather than conclusive. Finally, future research could be conducted on the library’s service quality and customer satisfaction by (1) taking greater sample size and (2) collecting data at reasonable intervals: first about their expectations and later about their perceptions of the same sample respondents.
KEYWORDS
Expectations, Library, Perceptions, Quality, SERVQUAL.
INTRODUCTION
t is an era of accountability for research libraries housed on university campuses confronting funding cutbacks and increased competition to recruit and retain tuition-paying students. Libraries have been starting introducing an entrepreneurial approach to library management to ensure value for money, who ever finances the library. It can be financed by government, students and other patron’s fee, or grants. But it has to discharge its responsibilities that the service financed is quality. Nitecki (1996b) said that every unit is valued in proportion to its contribution to the quality success of the campus.
Thompson and Cook (2000) described that the traditional evaluation criteria of the Association for Research Libraries (ARL) emphasized objective descriptions of collection sizes and their special features. Such evaluations include rankings and comparisons to peer institutions based on tangible measures such as budgets and collection size. The ARL annual statistics are designed to meet this traditional evaluation approach (Franklin & Nitecki, 1999). The variables that comprise the ARL Membership Index score are input measures: number of volumes held; number of volumes added; number of current serials; total library expenditures; and number of library staff. By implication, a higher rank on these performance indicators suggests a better quality of library. These input measures do not assess how well user needs are met.
However, recently there has been increasing pressure on libraries to assess the degree to which their services demonstrate criteria of quality as perceived by customers. Hernon and McClure(1990)explained that the emphasis on these measures and services provided to library clientele requires librarians not to equate quality merely with collection size. Nitecki (1996b) also noted that a measure of library quality based solely on collections has become obsolete. The impact of the library must be measured in terms of the user’s interaction with the library’s resources and its services. A critical judge of the impact is the user. Gronroos (1984) argued that service quality was composed of technical quality and functional quality. Technical quality is an objective assessment of what the customer receives from the service organization, and it concerns the outcome or content delivered through the service (for instance, materials in a collection). Functional quality, on the other hand, is a subjective measure of how the customer perceives the actual service delivered, and takes the measure of the process of service delivery. Gronroos puts a larger emphasis on this quality, contending that functional quality is more important to the perceived service than the technical quality, at least as long as the latter quality dimension is on the satisfactory level.
Thus, researchers have turned to the marketing literature for a measurement model that can be used for library service quality. The Parasuraman, Zeithaml and Berry’s SERVQUAL model, which includes 22 items measuring perceptions of tangibles, reliability, responsiveness, assurance and empathy, has been used for this purpose. With in this model, it is only the customer judge the quality of library service. They defined service quality in terms of reducing the gap between customers’ expectations for excellent service and their perceptions of actual services delivered.
Nagata et al. (2004) discussed that SERVQUAL has been evolved since 1985 - 1994 from 10 dimensions with 97 questionnaire items to 7 dimensions with 34 questionnaire items and then to its current status of 5 dimensions with 22 questionnaire items. SERVQUAL with five dimensions and its corresponding 22 items captures facets of all ten originally conceptualized dimensions” (Zeithaml, Parasuraman, & Berry, 1990), and could be widely utilized in any industry with only minor modifications (Parasuraman, Berry, & Zeithaml, 1991a). There is a need, therefore, to take the attributes unique to the university library service into consideration in the assessment of its quality.
Definitions of the dimensions are as follows (Zeithaml et al., 1990):
1) Tangibles are the appearance of physical facilities, equipment, personnel, and communication materials. 2) Reliability is the ability to perform service dependably and accurately.
3) Responsiveness is the willingness to help customers and provide prompt service.
4) Assurance is the knowledge and courtesy of employees and their ability to convey trust and confidence. 5) Empathy is the caring, individualized attention the institution provides its customers.
SERVQUAL MODEL
Nitecki (1996b) claimed that SERVQUAL is a mechanism to shift the assessment of quality of a library from the traditions of measuring collection size and counting incidents of its uses, to begin investigating how the provision of services relates to the library users’ service quality expectations. SERVQUAL has been used in various service industries, including academic, public, and special libraries (Hernon, 2002). It is important for libraries to know how well their performance by getting feedback from users because it is the factor for libraries to succeed in service performance.
VOLUME NO. 1 (2011), ISSUE NO. 5 (OCTOBER) ISSN 2231-5756
INTERNATIONAL JOURNAL OF RESEARCH IN COMMERCE, IT & MANAGEMENT
Only the user can judge quality, but on what criteria he/she judges it, or which aspect he/she values had not been made clear. The SERVQUAL instrument, designed by Parasuraman, Zeithaml and Berry (1985), has been playing a central role in the evaluation of service quality in marketing research and practice. Assessment of service quality has been an active topic of research since the pioneering work of Parasuraman et al. They identified five universally important dimensions of service quality: reliability, assurance, tangibles, empathy, and responsiveness. They developed the SERVQUAL instrument to measure customer assessment of service quality.
The SERVQUAL instrument is a questionnaire that consists of 22 pairs of statements. The first set of these statements measures the library user’s expectations by asking each respondent to rate, on a 7-point scale, how essential each item is for an excellent library. The second set of 22 statement measures the respondent’s perceptions of level of service given. The differences between the ratings for each statement are averaged to calculate the SERVQUAL score, an indicator of the library service’s quality as perceived by its users. In addition, the questionnaire includes a section in which participants were asked to allocate 100 points among descriptions of the five dimensions to indicate how important each is when they evaluate the quality of a library’s service. A set of overall and comparative service quality questions and a set of demographic questions are included on most adaptations of the SERVQUAL to library settings.
LITERATURE REVIEW ON LIBRARY SERVQUAL
From applications in a variety of service settings, Parasuraman et al. identified that reliability consistently ranks as most important to the delivery of service quality and tangibles as least important (Franklin & Nitecki, 1999). The research results from Nitecki’s doctoral dissertation shown that among the five dimensions of SERVQUAL, the users rated reliability was most important and tangibles was least important. This finding is parallel to those of Srisa-ard’s, Abdallah’s as well as Ford’s which found that the users reported the high expectation on reliability. On the contrary, the findings from the research project of Seay, Seaman and Cohen was shown that tangibles and reliability were the key concerns of library patrons. In sum, most findings reflected that reliability is the most important quality in evaluating library services that is similar to the result which the Parasuraman et al. proposed (as cited by Nimsomboon & Nagata, 2003).
In their study on “the dimensions that construct the evaluation of service quality in academic libraries”, Nagata et al. (2004) found that the ranking of desired expectations in the four universities indicated three items with the highest total mean scores: availability of required information, providing services as promised, and library staff with the knowledge to answer users’ questions were ranked within the top ten in all universities, showing no large variations. The items that were ranked differently depending on universities were space that enables quiet study, timely document delivery, assuring users of the accuracy and confidentiality of their personal information/data, willingness to help users, and modern equipment.
White (1998), in service quality survey at the University of Virginia Library, found the following results:
1. For Alderman Library Reference and Information Services, nine items were identified as the high importance/high rating: Assurance (staff who are consistently courteous and staff who have the knowledge to answer my questions); Responsiveness (providing service at the promised time, willingness to help me, readiness to respond to my questions, and offering appropriate services and resources); Reliability (providing the service promised and dependability of staff in handling my service problems); and Tangibles (modern equipment). On the contrary, three items identified as the high importance/low rating: Reliability (maintaining error-free circulation records and equipment that functions well) and Empathy (convenient hours of operation).
2. For Fiske Kimball Fine Arts Library, seven items were identified as the high importance/high rating: Assurance (staff who are consistently courteous); Responsiveness (providing service at the promised time, willingness to help me, readiness to respond to my questions, and offering appropriate services and resources); Reliability (providing services as promised); and Tangibles (modern equipment). On the contrary, five items identified as the high importance/low rating: Reliability (maintaining error-free circulation records, equipment that functions well, and signs and space arrangements that function well); Assurance (staff who have the knowledge to answer my questions); and Empathy (convenient hours of operation).
The findings of Nimsomboon and Nagata (2003) on “the assessment of library service quality at Thammasat University library system” were summarized as follows. On most of the SERVQUAL statements, user expectations for service quality lagged behind user expectations of actual service quality. When looking at the size of the expectation-perception gaps, faculty members appeared to desire improvements in the updating of equipment and in the promptness, sincerity, knowledge-ability, and degree of understanding with which staff assist users. Graduate students had the same concerns, though they were generally more critical of the library in terms of the number of SERVQUAL statements for which mean expectation rating exceeded mean perception ratings. Unlike the faculty, students indicated that their expectations for physical facilities, the visual appearance of library materials, the neatness of employees, operating hours and the personal attention staff give to users were not met. Among 5 dimensions of service quality, the findings suggested that the library users place a premium on the non- tangible aspects of service, particularly reliability and responsiveness.
OBJECTIVE AND SIGNIFICANCE
This study aimed at assessing and measuring the library service quality perception of users; to examine the relationship between service quality, user satisfaction and positive word of mouth; and some useful recommendations were presented to improve service quality and become more users centric. Besides, the study is significant that it contributes to the existing literature and suggests further study areas.
RESEARCH HYPOTHESES
H1: There are no significant mean differences between expectations and perceptions of library users regarding the tangibles, reliability, responsiveness, and empathy and assurance dimensions of service quality.
H2: There are no significant mean differences on expectations in terms of the tangibles, reliability, responsiveness, empathy and assurance among user groups (i.e., age, gender, education, and occupation).
H3: There are no significant mean differences on perceptions in terms of the tangibles, reliability, responsiveness, empathy and assurance among user groups (i.e., age, gender, education, and occupation).
H4: There is no positive significant impact of service quality dimensions on over all users’ satisfaction.
H5: There is no positive significant impact of library user satisfaction on users’ positive word of mouth about the library.
H6: There is no significant mean difference on the rating of importance of the tangibles, reliability, responsiveness, assurance and empathy dimensions of service quality among user groups.
METHODOLOGY
The aim of this research was to explore the PU main library users’ service quality perceptions, expectations and satisfaction. It was an exploratory research employing quantitative analysis. Questionnaires were distributed to samples of 100 (80 responded) respondents who are regular users of the library service selected using non-probability convenience sampling. The SERVQUAL questionnaire as proposed by Parasuraman et al. (1988) was employed to collect data. Data were collected on the first – second week of February 2011. These data have been analyzed using the Pearson’s correlation matrix, t-test, ANOVA (f-test) and multiple regressions in order to test the aforementioned hypothesis. A pilot test was conducted with 10 willing respondents who were selected on a convenience basis and who were voluntary to take their precious time to evaluate the questionnaire and forward their constructive comments for further refinement if there was any kind of problem with regards to wording, expressions and clarity of the questions.
VOLUME NO. 1 (2011), ISSUE NO. 5 (OCTOBER) ISSN 2231-5756
INTERNATIONAL JOURNAL OF RESEARCH IN COMMERCE, IT & MANAGEMENT
study as proposed by White (1998); namely degree of overall satisfaction and degree of recommendation of the library to others. Each of these variables was measured by a single item because of their ready interpretability and clear definition. A seven-point Likert scale ranging from (1= very bad) to (7= very good) was used to measure the two variables. Part D contains allocation of 100% among the five dimensions in terms of importance and, finally, Part E contains questions about personal profiles of the respondents including gender, educational level, age, and occupation.
Expectations and perceptions were given for each item. P (perceptions) - E (expectations) was also used to find gap scores because service quality depends on perceived performance in delivery value relative to users’ expectations. If E > P; the user is dissatisfied and if E< P the user is satisfied (Kotler & Armstrong, 1999; Parasuraman, 1998; Parasuraman et al., 1991a).
SCOPE AND LIMITATION
The study was targeting only the patrons on the first - second week of February 2011. The researcher had time and resource constraints which limited the potential sample size and the target group. Besides, data on expectations and perceptions was filled at the same time rather than at different intervals due to the already mentioned time constraint. This research finding provides only a glimpse of the users’ library service satisfaction, not used for generalization. Hence, future research could be conducted on the library’s service quality and customer satisfaction by (1) taking greater sample size and (2) collecting data at reasonable intervals: first about their expectations and later about their perceptions of the same sample respondents.
RESEARCH FINDINGS AND DISCUSSIONS
DEMOGRAPHIC VARIABLES
Out of the total sample size of 100 participants, only 80 respondents responded (i.e., the response rate is 80%); 2 (50 and above), 33 (41-50), 17 (31- 40), and 28 of them were at the age of between 21-30 years; 43 of the respondents were male and 37 of them female; educational background of the respondents was 31 (PhDs) and 49 (post graduates); 6 of the respondents were office workers, 17 professors and 57 of them students.
The study indicated insignificant number of respondents rated some of the 22-items below 4 thus resulting in higher customer expectation. There were also high mean scores (i.e., 6.2625 – 6.6250 in a 7-rating scale) and low variance. In this case it would be possible to have low rating of overall satisfaction as well as word of mouth to recommend the library to others unless there is a corresponding high customer perception. However, there was low rating of perception below 4 in a 7-rating scale. This leads to the low mean scores that is lower than 5 for all the five quality dimensions. There were also significant variances as compared to the low variances in the case of expectation. The significant discrepancy between expectation and perception result in the relatively lower overall satisfaction and recommendation to others. The variance among respondents was also relatively high for recommendation than over all satisfaction.
PRE-ANALYSIS TESTING (Validity and Reliability Testing)
The Pearson correlation indicated significant positive correlation among the five service quality dimensions. A change in either of the dimensions will have a significant change on the others. Besides, over all satisfaction (Q1OS) had significant positive correlation with assurance (0.830), tangible (0.794), empathy (0.788), reliability (0.770) and responsiveness (0.673) respectively at p < 0.001. Overall satisfaction had strong positive correlation with assurance and had relatively low positive correlation with responsiveness. It also had significant positive correlation with customers’ recommendation to others (Q1R) (0.841), i.e., the more customers are satisfied, the more they will have positive word of mouth and are inclined to recommend the library to others. Customers’ recommendation to others had relatively significant positive correlation with reliability (0.878) and tangible (0.825). It means any positive improvement on reliability and tangibility of the library service will have a more positive word of mouth towards the library (Annexure I).
FACTOR ANALYSIS (Expectation)
Factor analysis attempts to identify underlying variables, or factors, that explain the pattern of correlations within a set of observed variables. Factor analysis is often used in data reduction to identify a small number of factors that explain most of the variance observed in a much larger number of manifest variables. However, in this study, the factor analysis is used to make pre analysis testing in order to check for adequacy of sample and validity of the data for further statistical analysis.
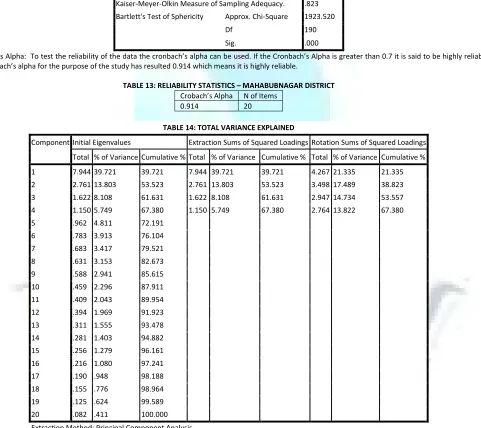
Pre-analysis testing for the suitability of the entire sample for factor analysis was computed as recommended by Comrey (1978). The study showed that Kaiser-Meyer-Olkin (KMO) measure of sampling adequacy was 0.715 and the Bartlet tests of sphericity was significant at p < 0.001. As Bedi (2004) stated, KMO larger than 0.6 is appropriate for factor analysis.
As the Kaiser-Meyer-Olkin Measure of Sampling Adequacy indicated, KMO equals to 0.715 which is adequate to conduct statistical analysis; because 0.60 is the cut-off point. The KMO value increases with an increase in sample size (Thompson & Cook, 2000). Besides, the Bartlett’s test of Sphericity was significant at p < 0.001.
Reliability Measures: Cronbach’s alpha [the 22-item customer expectations]
Reliability analysis allows studying the properties of measurement scales and the items that make them up. The Reliability Analysis procedure calculates a number of commonly used measures of scale reliability and also provides information about the relationships between individual items in the scale. Intraclass correlation coefficients can be used to compute interrater reliability estimates. Alpha (Cronbach) is a model of internal consistency, based on the average inter-item correlation.