www.ann-geophys.net/27/3065/2009/
© Author(s) 2009. This work is distributed under the Creative Commons Attribution 3.0 License.
Annales
Geophysicae
HF echo types revisited: aspect angle attenuation effects
R. A. Makarevich and B. A. Carter
Department of Physics, La Trobe University, Melbourne, Victoria 3086, Australia
Received: 13 March 2009 – Revised: 28 July 2009 – Accepted: 5 August 2009 – Published: 6 August 2009
Abstract. The high-spatial-resolution observations of the au-roral E-region echoes by the Super Dual Auau-roral Radar Net-work (SuperDARN) HF radar at Pykkvibaer, Iceland con-sidered in a previous study are re-examined. Both the spec-tral power and Doppler velocity of the E-region HF echoes exhibit strong dependence on the slant range and expected off-perpendicular magnetic aspect angle (aspect angle atten-uation). We consider the aspect angle attenuation effects in identification of spectral HF echo types. It is argued that echoes with Doppler velocities close to the nominal value of the ion-acoustic speed Cs (∼350 m/s) and echoes with velocities greatly exceeding the Cs (up to 600 m/s) are more related in their generation mechanisms than previ-ously thought. It is proposed to treat the echoes near theCs as aspect-angle-attenuated counterparts of the high-velocity echoes and that both types are generated directly by the mod-ified two-stream instability with aspect angle attenuation re-sulting in the preferential phase velocity saturation at theCs.
Keywords. Ionosphere (Auroral ionosphere; Ionospheric ir-regularities; Plasma waves and instabilities)
1 Introduction
Over the last decade, the HF coherent radar studies of the plasma waves in the auroral E region have been extremely successful in identifying fundamental differences between irregularity properties at decameter scales as compared to meter-scale irregularities observed with VHF radars (Milan and Lester, 1998, 1999, 2001; Jayachandran et al., 2000; Uspensky et al., 2001; Koustov et al., 2001, 2002, 2005; Makarevitch et al., 2001, 2002b,a, 2004; Milan et al., 2003, 2004; Makarevich, 2008; Carter and Makarevich, 2009). In particular, the HF echoes have been found to exhibit a wider
Correspondence to: R. A. Makarevich ([email protected])
variety of relationships between their spectral characteristics: spectral power, Doppler velocity and spectral width (Mi-lan and Lester, 2001). This is often interpreted in terms of the decameter-scale waves generated through different and more numerous mechanisms (Milan and Lester, 2001; Kous-tov et al., 2002; Drexler et al., 2002; Drexler and St.-Maurice, 2005).
At VHF, the two predominant echo populations are re-ferred to as Types I and II. Type I spectra are narrow and cen-tered around the nominal value for the ion-acoustic speedCs in the E region of 350 m/s, while Type II echoes have spec-tral widths of the order ofCs and Doppler velocities much smaller thanCs. The Type I and Type II echoes are generally believed to be generated through the modified two-stream and gradient-drift plasma instabilities, respectively (e.g. Hal-doupis, 1989).
no distinction between the two populations has been made in that study; they both were considered together and called the high-velocity echoes.
An interesting result obtained by Makarevitch et al. (2002a) was that the Doppler velocities of high-velocity echoes showed a clear decrease or attenuation with the ex-pected off-perpendicular aspect angleα(angle between the direction of observations and the perpendicular to magnetic field line). This result was reminiscent of the echo power at-tenuation with the aspect angle established at all frequency ranges and similar to the irregularity velocity attenuation with the aspect angle reported at VHF (Ogawa et al., 1980; Nielsen, 1986; Kustov et al., 1994). However, an impor-tant difference was that the HF velocity at large aspect an-gles did not reach very small values near zero; the observed velocity minimum was 300–500 m/s. Interestingly, nearly si-multaneous observations of the Doppler velocity at low VHF (50 MHz) in the same study by Makarevitch et al. (2002a) clearly showed the expected behaviour (approaching zero) at large aspect angles. More recently, the VHF velocity de-pendence upon the aspect angle was re-examined using for the first time simultaneous and coincident measurements of the plasma drift velocity upon which the phase velocity is also strongly dependent; the VHF velocity attenuation was found to be even stronger than previously thought (Makare-vich et al., 2006, 2007).
A common approach used in plasma irregularity stud-ies is to employ spectral characteristic data (Power, Veloc-ity, Width, and Skewness, if available) collected with co-herent radars and analyse different populations in the Wa-termann scatter plots, e.g. W-V, P-V, and P-W, (WaWa-termann et al., 1989; Hanuise et al., 1991; Milan and Lester, 2001) or, for large data statistics, similar point occurrence plots (Mi-lan et al., 2003; Makarevich, 2008; Carter and Makarevich, 2009). As velocity depends strongly on the flow angle, of-ten a velocity-L-shell angle (V-A) plot is also analysed. In such an approach it is tacitly assumed though that either the echoes are coming predominantly from locations with small aspect angles or that the aspect angle effects are not impor-tant. In other words, the aspect angle effects in identification of various echo types are not considered.
The aim of this study is to re-examine the HF echo popu-lations by considering explicitly the effects arising from the power and velocity dependencies upon the aspect angle. It will be demonstrated that population I with velocities near theCs is closely related to population III with velocities ex-ceeding theCs and that one can treat population I as aspect-angle-attenuated high-velocity echoes from population III.
2 Observations
In this study, we consider the data from the same two inter-vals as those selected by Milan and Lester (2001), i.e. two radar scans starting at 03:30 UT and 21:16 UT on 24
Febru-ary 1997 of the SuperDARN Pykkvibaer HF radar. The radar scans through 16 azimuthal directions (radar beams 0–15) in ∼3.25◦ steps. The radar measures a 17-lag Auto
Correla-tion FuncCorrela-tion from which estimates of the Doppler veloc-ity, power, and spectral width of ionospheric echoes in 75 range bins for each of the 16 radar beams are obtained. The measured Doppler velocity corresponds to the l-o-s irregu-larity velocity and is, by convention, positive for irregulari-ties propagating towards the radar. The sounding frequency is usually fixed somewhere between 9 and 18 MHz. On 24 February 1997, the radar operated in the “myopic” mode de-signed to provide high-spatial-resolution observations of the short ranges where E-region backscatter normally occurs. In this scan mode, the range gate length is 15 km with the first range gate of 180 km. The radar frequency was 10 MHz dur-ing both intervals of interest. In addition to the original study by Milan and Lester (2001), the reader is referred to an earlier study for more details on the radar’s technical characteristics and operations (Milan et al., 1997).
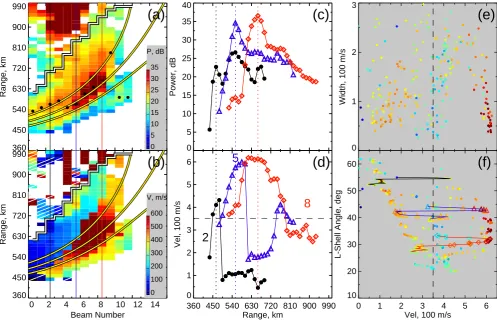
Figure 1 shows the scatter plots of (a) and (c) the spectral width and (b) and (d) the L-shell angle versus the Doppler ve-locity as measured by the SuperDARN Pykkvibaer HF radar during the two intervals of interest. This figure is almost identical to Fig. 6, panels (b), (c), (e), and (f), of Milan and Lester (2001). The minor differences in a small number of echoes being excluded are due to the slightly different data selection criteria employed as described below. All ground-and sea-scatter echoes were excluded using the stground-andard Su-perDARN criteria of low width and velocity. The F-region echoes at farther ranges were also excluded using the vari-able range threshold introduced later in Figs. 2 and 3. The additional echoes excluded had small velocities of the same polarity as the expected F-region convection flow for a par-ticular interval of interest: positive in (a) and (b) and negative in (c) and (d). They also referred to farther ranges of 630– 990 km, had the same velocity polarity as the majority of echoes at these ranges and opposite polarity to that of echoes at closer ranges. The excluded echoes were therefore almost definitely of the F-region origin.
Fig. 1. Scatter plots of (a) and (c) the spectral width and (b) and (d) the L-shell angle versus Doppler velocity for two intervals on 24 February 1997. Also shown are the echo populations I, II, and III identified in a previous study (see text for details).
contrary to behaviour of population II echoes whose veloc-ities steadily increase towards the smallest observed angles
φ.
To investigate the three populations in further detail, in particularly, considering the effects of aspect angle atten-uation of the spectral power and Doppler velocity, Fig. 2 presents the data from one of the two interval shown in Fig. 1. As the second interval 21:16–21:18 UT contained only 2 populations, it is analysed first. The first two pan-els show the range-versus-beam spatial plots colour-coded in (a) the spectral power and (b) the Doppler velocity. For further analysis, standard power-range correction was per-formed by assuming ar−3power decrease with slant range
r(e.g. Greenwald et al., 1975; Makarevich, 2008). The spa-tial plots clearly show the E-region echo band at near ranges
r=405–900 km which curves away from the radar for larger beam numbers. The sense of curvature is the same as those of zero aspect angle lines at 110 km shown by the yellow curves for 3 selected electron density profiles. The aspect angles were computed for the frequency of observations of 10 MHz assuming that the radar beam undergoes refraction
as described by Uspensky et al. (1994). The spectral power maxima along each beam (black dots) are located in the mid-dle of the band, with the bottom line representing well most maxima. A similar representation of the power maxima lo-cations by the model aspect angle lines has been employed for various VHF and HF radar systems (e.g. Koustov et al., 2001, 2002; Makarevitch et al., 2001, 2002b, 2004).
360 450 540 630 720 810 900 990
Range, km
0 5 10 15 20 25 30 35 P, dB
(a)
Beam Number 360
450 540 630 720 810 900 990
Range, km
0 2 4 6 8 10 12 14
0 100 200 300 400 500 600 V, m/s
(b)
0 5 10 15 20 25 30 35 40Power, dB
(c)
360 450 540 630 720 810 900 990 Range, km
0 1 2 3 4 5 6
Vel, 100 m/s
2
8
12
(d)
0 1 2 3Width, 100 m/s
(e)
0 1 2 3 4 5 6 Vel, 100 m/s
10 20 30 40 50 60
L-Shell Angle, deg
[image:4.595.49.551.63.386.2](f)
Fig. 2. Panels (a) and (b) show, respectively, the spectral power and Doppler velocity maps for 21:16–21:18 UT on 24 February 1997. The cells with white diagonal in panel (b) represent negative velocities. The black-white line indicates the chosen boundary between the F- and E-region backscatter bands. The coloured vertical lines show the 3 selected beams. The black dots show the power maxima along each beam. The thick yellow curves are the lines of zero aspect angle at an altitude of 110 km assuming electron density profiles with the density maxima (3.7, 4.2, 4.7)×104cm−3for the top, middle and bottom curves, respectively. Panels (c) and (d) show, respectively, slant range profiles of the spectral power and velocity along the 3 selected beams. The digits show the beam numbers. The vertical dashed lines show the range of maximum power along each beam. Panels (e) and (f) are the scatter plots of (e) the spectral width and (f) the L-shell angle versus velocity. The data points are colour-coded in spectral power as given by the colour bar in panel (a). The horizontal dashed line in (c) and (d) and vertical dashed line in (e) and (f) show the nominal ion-acoustic speed of 350 m/s. The coloured lines in (e) and (f) connect the data points for the 3 selected beams (the same as in panels c and d).
In the next presentation, the power (c) and velocity (d) data from 3 selected beams are considered. These beams are indicated by the vertical lines in Figs. 2a and b and the corresponding beam numbers are also shown by the digits in Fig. 2d. The important feature here is that the power curves for beams 2 and 8 have a well-defined bell-like shape, with maxima at the ranges 495 km and 585 km, respectively, shown by the vertical dashed lines. A similar feature is ob-served in beam 12, but with a dip that occurs nearr=630 km. In the velocity data, Fig. 2d, for each beam, the veloc-ity reaches a maximum at a range which is close to that of the power maximum shown by the vertical dashed line. An important feature for this study is that, for all 3 beams, the velocities at the nearest ranges where the echoes were ob-served (430–630 km) are close to each other and to the
nomi-nal ion-acoustic speedCsof 350 m/s shown by the horizontal dashed line. In beam 2, all points are close toCs, while in beam 8 only two closest ranges (leftmost triangles), at which power is at or close to its minimum, have velocities near the
Cs. Similarly, in beam 12, the points that are closest to the
Cs in velocity are observed at∼630 km; these are the points near the power minimum. Moreover, on the other side of the power maximum (larger ranges) velocity and power both de-crease with range increasing until velocity reaches∼400 m/s, i.e. values that are close to theCsdashed line.
360 450 540 630 720 810 900 990
Range, km
0 5 10 15 20 25 30 35 P, dB
(a)
Beam Number 360
450 540 630 720 810 900 990
Range, km
0 2 4 6 8 10 12 14
0 100 200 300 400 500 600 V, m/s
(b)
0 5 10 15 20 25 30 35 40Power, dB
(c)
360 450 540 630 720 810 900 990 Range, km
0 1 2 3 4 5 6
Vel, 100 m/s
2
5
8
(d)
0 1 2 3Width, 100 m/s
(e)
0 1 2 3 4 5 6 Vel, 100 m/s
10 20 30 40 50 60
L-Shell Angle, deg
[image:5.595.48.546.63.385.2](f)
Fig. 3. The same as Fig. 2 but for 03:30–03:32 UT and with the reversal in velocity polarity in panels (b), (d), and (f).
yellow-to-red points with the largest power have largest ve-locities of 550–600 m/s, which is obvious in both Figs. 2e and f. As power decreases so does velocity, which is most obvi-ous for points at small L-shell anglesφ=10◦–35◦including the data in beam 8 (triangles). The same feature as in Fig. 2d is observed here, i.e. that velocities with smaller power are near theCs (vertical dashed line in Figs. 2e and f).
The key feature for this study in Fig. 2f is that the points near the Cs at φ=10◦–35◦, which have been termed pop-ulation I in Fig. 1d, no longer seem to be completely un-related to high-velocity population III with velocities near 600 m/s. On the contrary, as highlighted by the beam 8 and 12 data (triangles and diamonds, respectively) and other sim-ilar groups of points, both populations appear to be simply two “extreme cases” of the same common group of points, with points near 350 m/s and 600 m/s connected by lines that often have several, evenly-spaced points in between, for ex-ample for beam 8 (triangles) or for the lower branch of the beam 12 data (diamonds).
We next analyse the data from the other interval, which was previously presented in Figs. 1a and b. Figure 3 has the same format as Fig. 2 but with the polarity of the Doppler velocities reversed for convenience in panels (b), (d), and (f). In panels (a) and (b), echoes at farther ranges are less patchy
than in Fig. 2. However, other features that allowed us to dis-tinguish between the E- and F-region scatter bands are still present, including the predominantly different polarities and different magnitudes (for the same beam) of the l-o-s veloci-ties measured.
Figure 3a shows that the primary power maxima (black dots) are in the middle of the band, similar to Fig. 2a, but here they do not appear to be described by a single aspect angle curve. Rather, they fall into 2 major groups with the maxima from the first (second) group observed in beams 0–3 (4–8) and appearing close to the top (middle) yellow curve. The first (second) group is clearly associated with the blue (red) cells in Fig. 3b. The red cells in Fig. 3b are high-velocity echoes of population III, similar to Fig. 2.
should note, however, that for beam 2 it is the secondary maximum that has been used as reference (465 km, indicated by the black vertical dashed line) since the primary maxi-mum at 555 km referred to population II (plateau in veloc-ity in Fig. 3d). Similar local maximum and inflection point were observed in the beam 5 and 8 data, respectively, at 670 and 840 km. They also referred to population II. In beam 2, all velocities near the secondary power maximum at 465 km were close toCs.
The difference between Figs. 2d and 3d is that on the other side of power maximum (toward increasing range) there is a sharp drop-off in velocity in beams 2 and 5. This is contrary to what is seen in Fig. 2d in beams 2 and 12, where velocity was gradually approachingCsat farther ranges. The velocity variation along beam 8 is different as it does not decrease significantly at ranges beyond 630 km staying near 550 m/s, Fig. 2d. However, one can argue that had there been echoes at
r>675 km, their velocities would also have shown a decrease to theCs values.
Interestingly enough, Fig. 3d shows that if one considers even farther ranges of near 800 km for beam 5, the velocity does return to theCslevel. In addition, velocity is close toCs in beam 8 at farther ranges. However, in this beam it is rather difficult to say whether these echoes belong to population I or population II as the difference between the velocity plateau near 800 km and theCs-level is small (unlike in beams 2 and 5). This feature is discussed later in Sect. 3.
From Fig. 3f one can conclude that, similar to Fig. 2f, points at smaller anglesφ=10◦–45◦nearCsform a common group with points near 600 m/s. The echo power is progres-sively smaller for points in the beam 5 and 8 data (triangles and diamonds, respectively) as velocity gradually decreases until it reaches theCs level so that choosing any threshold velocity and/or power to separate the two populations ap-pears to be rather artificial. Thus Fig. 3 shows that, simi-larly to Fig. 2, populations I and III do not appear to have a sharp boundary between them as far as velocity variation with range is concerned. This is in contrast with transition between populations I and II.
3 Discussion
The echo power decrease with the aspect angle, often re-ferred to as the aspect angle power attenuation, is a well-established property of coherent radar backscatter from iono-spheric irregularities in the auroral E region (e.g. Haldoupis, 1989; Sahr and Fejer, 1996, and references therein). A sim-ilar velocity decrease with the aspect angle has also been re-ported (Ogawa et al., 1980; Nielsen, 1986). The aspect angle attenuation of power has been found to occur at all frequency ranges with comparisons between observations at different frequencies suggesting that echoes at low VHF (50 MHz) are less aspect sensitive than those observed near 150 or 400 MHz (Haldoupis, 1989).
The HF observations have suggested that decameter-scale waves are perhaps even less aspect sensitive, with echoes regularly observed at the expected aspect angles of α∼=5◦
(Makarevitch et al., 2002b,a) and often at very large aspect angles ofα>10◦–15◦(Milan et al., 2004). One should bear in mind though that none of the above-cited studies at HF have performed rigorous ray-tracing simulations using elec-tron density measurements to estimate the aspect angles. The majority of aspect angle estimates were based on a simple geometric optics model described by Uspensky et al. (1994) that was also employed in this study. In this approach, the power and velocity variations with range can be described in terms of the expected aspect angles at a given height for each range cell assuming either no refraction (geometrical or rec-tilinear aspect angles) or some electron density profile (“real” aspect angles). Several profiles are often tried to determine which profile results in a better match between the power maxima and locations of zero aspect angles (e.g. Koustov et al., 2001; Makarevitch et al., 2004).
For the SuperDARN Pykkvibaer HF radar, the geomet-rical aspect angles at 110 km do not reach zero anywhere in the near field-of-view (see recent study by Makarevich, 2008, and their Fig. 1). At the same time, this radar regu-larly observes the E-region echoes at near ranges (Milan and Lester, 2001; Makarevich, 2008), which implies appreciable refraction and electron density for majority of observations. In this study, 3 electron density profiles were used to deter-mine whether power variation with range can be reasonably described in terms of expected aspect angle, Sect. 2. Given that the two considered intervals referred to two significantly different time sectors, it is not surprising that the power max-ima locations were different and described well by the two aspect angle models that were not exactly the same.
In the past, much debate has been generated about whether all “true” aspect angles in VHF observations are in fact small (<1◦–2◦), whereas the corresponding “real” aspect angles are significantly overestimated (see review paper by Moor-croft, 2002, and references therein). In other words, the ef-fects of refraction, reflection and multiple scattering at VHF were argued to be regularly underestimated. Certainly, these effects are expected to be even larger at HF. Theoretically, the waves at large aspect angles should be rapidly destroyed by diffusive damping as electrons that are highly mobile along magnetic field lines short out the fields supporting the waves (e.g. Farley, 2009). However, nonlinear and nonlocal pro-cesses may provide some support to the waves at large as-pect angles through an increase in the scattering of electrons (Hamza and St-Maurice, 1995) and through a mode conver-sion at a spatial discontinuity in the aspect angle (Drexler and St.-Maurice, 2005), respectively, with the latter scenario being applicable mostly to decameter waves.
not important for this study, and the model presented later in this section only considers aspect angles below 2◦, i.e. it
is within the small “true” aspect angle paradigm described above.
The other interesting feature of HF observations is that that echoes with unusually large Doppler velocities at and above 600 m/s are not that uncommon (Milan and Lester, 2001; Milan et al., 2003; Makarevich, 2008). Termed “super-Cs” and high-velocity echoes by Milan and Lester (2001) and Makarevitch et al. (2002a), respectively, to distinguish from echoes near the nominalCsvalues of∼350 m/s typical of the VHF and UHF backscatter, they have been originally found to occur at relatively low L-shell angles ofφ<45◦. More re-cently however, similar echoes near 600 m/s have been found to occur at all L-shell angles (all 16 beams) sampled with a single HF radar (Makarevich, 2008). This has been attributed to the two-stream plasma wave generation within the insta-bility cone (low flow angles) with possible energy transfer to waves at large flow angles.
In the present study, it was demonstrated that the two pop-ulations of HF echoes near 350 and 600 m/s are more closely related than perhaps thought previously as the echoes with “intermediate” power and velocity values were regularity ob-served, Figs. 2f and 3f. Both the HF power and velocity behaviour were typical of those observed in other studies that employed oblique-sounding auroral HF radars (Koustov et al., 2001; Makarevitch et al., 2002b) with the power and velocity reaching their respective maxima at rangesrP and
rV (withrP typically being close torV) and decreasing with range increasing/decreasing fromrP orrV. Such a behavior is believed to be related to the power and velocity attenua-tion with the aspect angle as demonstrated by numerous pre-vious studies at HF (Koustov et al., 2001, 2002; Uspensky et al., 2001; Makarevitch et al., 2001, 2002b, 2004) and as described below.
The aspect angle varies with range along each radar beam reaching a minimum at some ranger0. These ranges for zero
aspect angle for different electron densities were shown by the yellow curves in Figs. 2 and 3. The linear fluid theory of auroral irregularities predicts that the growth rate and the phase velocity should be maximized atr0and decrease with
the aspect angle increasing in magnitude on both sides ofr0.
This is exactly what is observed for power in Figs. 2 and 3 except that in some beams there is a secondary power maxi-mum at near ranges (e.g. atr∼=540 km in beam 12 in Fig. 2c). This secondary power maximum most likely occurs since the echoes at these radar cells are generated through a different mechanism. The fact that velocity near 540 km in beam 12 (and adjacent beams) is also lower than the nominal value of
Cs of 350 m/s and nearly constant with range at 505–585 km suggests that these echoes may simply belong to population II echoes that are only observed at small L-shell angles for this interval (unlike those in Fig. 3). As was noted in Sect. 2, at these small L-shell angles it is rather difficult to distinguish between the populations I and II. In this beam, however, the
data suggest that only points at 585–630 km near the power minimum should be classified as population I. The distinc-tion is clearer at larger L-shell anglesφ∼=40◦ (beam 5) for
the other interval where a gap in velocity was observed be-tween points in Figs. 3d, f. Hence one can argue that it is incorrect to lump all points near and below 350 m/s into one population I as it has been done in Fig. 1d.
The analysis of observations presented in this study shows that the echoes from population I with velocities near theCs may be interpreted as aspect-angle-attenuated echoes from population III with velocities near 600 m/s rather than as a stand-alone population. The spectral power showed a grad-ual decrease as velocity was decreasing from ∼600 m/s to ∼350 m/s along the same beam at smallφ. This often oc-curred on both sides of the maximum in the power profile (e.g. beam 12 in Fig. 2d). Also, the echoes with the largest spectral powers generally had the largest velocities, Figs. 2f and 3f.
Notwithstanding the importance of this interpretation, one should emphasise that statistically-speaking populations I and III are different. That is they are evident as separate peaks in either 1-D velocity distributions or in 2-D distribu-tions in the W-V and P-V point occurrence plots (see Milan et al., 2003, and their Fig. 6), although the troughs between the peaks are not deep, which is consistent with the present study. This means that there is a preferentially observed ve-locity near theCs. So the question why there are two statis-tically separate populations is still valid, although it perhaps should be reformulated as: Why does the aspect angle atten-uation of HF velocity stop near theCs rather than continuing all the way to very low values near zero, which is observed at VHF and UHF (e.g. Ogawa et al., 1980; Foster et al., 1992), or stopping somewhere between 350 and 600 m/s?
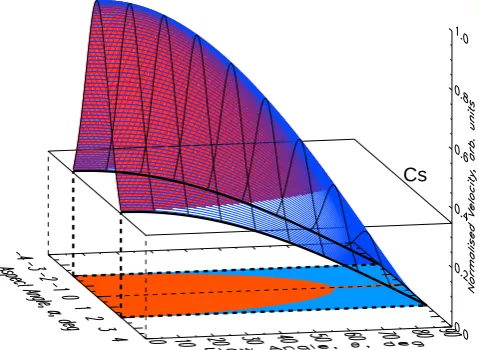
To discuss this issue in more detail, Fig. 4 shows two models of the phase velocity variation with the flow and as-pect angles. The red surface shows the phase velocity cal-culated using the expressions from the linear fluid theory (e.g. Fejer and Kelley, 1980). In these calculations we used the typical values of collision frequencies νi=726 s−1 and
νe= 31 243 s−1 and a convection velocity of 1000 m/s that have also been used by Makarevich (2008). The velocity shown was normalised to the selected convection speed so that the Cs plane is at 0.35. The lowest achievable veloc-ity in this approach is the Cs, which is obtained from the zero growth rate condition (when wave amplitude is satu-rated). The red half-oval at the bottom (i.e. at thez=V=0 plane) is the projected red velocity surface; it shows the lim-its in flow (θ0) and aspect (α0) angles on the wave generation
in this regime. The range of aspect angles at which linear wave modes can be generated is largest along the plasma flow, α≤α0(θ=0)∼=2◦. It then decreases and reaches zero
at θ=θ0∼=60◦, at which point the waves can only be
gen-erated perpendicular to the magnetic fieldα=α0(θ=θ0)=0.
Atθ >θ0, no linear wave modes should exist. This is
Cs
Fig. 4. Surfaces of the phase velocity model dependence upon the flow and aspect angles. The red (blue) surface shows the model as-suming that the phase velocity reaches minimum at the ion-acoustic speedCs (cosine component of the ion-acoustic speed Cscosθ) represented by the plane (thick curves).
angle increase demonstrated experimentally by Makarevich (2008). One should also note that the electron drift velocity used here is somewhat large (1000 m/s); for a smaller ve-locity of 500 m/s the largest flow and aspect angles achiev-able in the linear regime would be smaller: θ0∼=30◦ and
α0(θ=0)∼=1◦(Makarevich, 2008).
The population III echoes in this model would correspond to the top ridge of the red surface atα=0. The variation with the flow angle is not exactly consistent with the observations at the maximum measured velocity was observed atθ∼=35◦ (assuming θ=φ) rather than at θ=0. This may indicate a significant rotation of the direction at which the maximum velocity is observed in the E-region. The population I in this model is represented by the bottom edge of the red surface atCs. The populations I and III are connected by the black bell-shaped lines for each fixed flow angle value. A single bell-shaped line in theα−θspace would roughly correspond to the data from a single radar direction (beam) in Fig. 2f (in ther−φspace).
In the past, various mechanisms were employed to explain the observations of the high-velocity echoes at VHF (known as Type IV echoes) and more recently at HF. These mech-anisms included the electron heating by the strong electric fields (Fejer et al., 1986), electrostatic ion cyclotron waves (Villain et al., 1987), strong gradients in the electron density (St.-Maurice et al., 1994), and convective nature of the two-stream instability at decameter scales (Drexler et al., 2002). The difference between the VHF and HF observations ap-pears to be that the high-velocity echoes are observed quite regularly by the radars observing at low flow angles (Milan et al., 2003; Makarevich, 2008) and that the echo character-istics do not match those of the VHF Type IV echoes (Moor-croft, 2002).
Importantly, Fig. 4 shows that both populations can be generated directly by the modified two-stream instability (even if marginally in case of population I, i.e. when the growth rate is only slightly above zero) when plasma con-vection speeds are sufficiently (but not unrealistically) large. The aspect angle attenuation results in the phase velocity being significantly reduced, with the smallest value (Cs) reached at the red half-oval boundary. Thus in this approach one can successfully explain the preferential detection of echoes with velocities near theCs through the lower limit on the aspect angle attenuation of the phase velocity. How-ever, a still outstanding question is: why this is not observed at higher frequencies. Multi-frequency UHF/VHF/HF mea-surements of the Doppler velocity at small flow angles are required to resolve this issue.
The blue surface in Fig. 4 shows an alternative model that assumes that the aspect angle attenuation of velocity does continue even beyond the aspect angle cone, until velocity reachesCscosθ(two thick curves). This particular model is suggested here to give some additional insight into our results as well as into some of the previous results. As mentioned, in our observations the Doppler velocity of echoes from pop-ulations I or III did not reach belowCs. In other words, no echoes were observed that would have fallen onto the blue surface below theCs plane. However, the echoes with lower velocities in Fig. 3f (population II) did show a cosine-like variation. The HF echoes at the lowest anglesφ<30◦could have been assigned to either population I or II, but extrapo-lating the HF velocities atφ=30◦–60◦for echoes from popu-lation II in Fig. 3f would give a coefficient of proportionality close to 350 m/s. The variation in range did not appear to cause any appreciable change in velocity for this population (Fig. 3d) with most points being away from the power max-imum, which implies large aspect angles. This population did not appear to be related to either population I or popula-tion III as there were no points connecting populapopula-tion II to the other two when observed along the same beam. Instead, a sharp drop-off in velocity was observed in Fig. 3d, which was also accompanied by a sharp change in the rate of power decrease with range. One can conclude that the population II velocities can be described by the bottom edge of the blue surface in Fig. 4 but not by the blue surface itself.
angles even at 140 MHz (Uspensky et al., 2003), it is possible that the large bulk of their observations at 30 MHz, where the altitude-integration effects are expected to be stronger, was performed at relatively large aspect angles. Our observations of echoes from population II that occurred at ranges away from the power and velocity maxima are consistent with the
Cscosθmodel, which suggests that the model possibly ap-plies to observations at large aspect angles as illustrated in Fig. 4. The present study thus provides an alternative in-terpretation of the observations consistent with theCscosθ model either at 10 MHz or at 30 MHz.
Finally, in this study, a case was made for a continuous transition between the echoes from populations I and III as-sociated with a gradual change in the expected aspect angle. Another possibility is a spatial convolution of the two distinct echo types observed, with preponderance ofCs (“super-Cs”) echoes at shorter (farther) ranges. Within this scenario, there are two cases: the two types of echoes may originate from two different heights or they may occur in the same scatter-ing volume with different probabilities (addscatter-ing to 1) depend-ing on the range. The second case does not appear to be supported by observations as probabilistic nature of this case implies more random distribution of velocities within each range cell and hence more irregular velocity variation with range. One also expects that, on occasions,Cs echoes may be observed where most “super-Cs” echoes occur and vice versa. Nothing of the kind is observed in either of the two radar scans presented in Figs. 2 and 3 and, in general, for the entire event of interest.
In the first case, in which the echoes are coming from two different heights, one expects that the spectral width will be enhanced somewhere in the middle between the ranges whereCs and “super-Cs” echoes predominantly occur. In other words, the spectral width at “intermediate” velocity and power values should be enhanced. Figures 2e and 3e indeed show that the width at velocities∼500 m/s is some-what larger than at smaller or larger velocities (near 0 and 600 m/s).
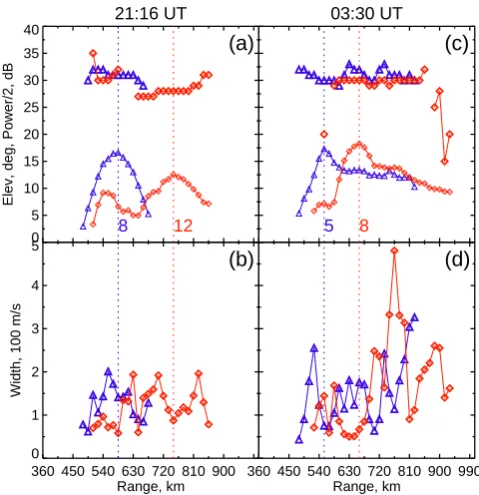
To investigate this possibility in more detail, Fig. 5 presents the elevation angle and spectral width measurements for the two intervals of interest in the same format as Fig. 2c. The power profiles are also shown in panels (a) and (c) for reference. The ranges of power maxima are shown by the dashed lines. The spectral width is expected to be enhanced between the power maximum and minimum ranges, which are also approximately the ranges where velocity is at max-imum and closest to the nominalCs, respectively. Indeed, the width reaches a maximum on the “ascending leg” of the power profile in beam 8 (5) for the first (second) interval at a range 555 km (535 km). The width is also at (near) a local minimum at the dashed line in beam 12 (8) at a range 750 km (660 km) for the first (second) interval. However, the width variation with range is mush less smooth than that of power or velocity and the local width maxima reached are only 200– 250 m/s. In addition, one can argue that the width should be
21:16 UT
0 5 10 15 20 25 30 35 40
Elev, deg, Power/2, dB
8 12 (a)
360 450 540 630 720 810 900 Range, km 0
1 2 3 4 5
Width, 100 m/s
(b)
03:30 UT
5 8
(c)
360 450 540 630 720 810 900 990 Range, km
[image:9.595.307.547.61.309.2](d)
Fig. 5. Elevation angle (a) and (c) and spectral width (b) and (d) variations with range for the two intervals of interest. The measure-ments in two selected beams (the same as the last two from Figs. 2c, d and 3c, d) are shown by triangles and diamonds. The power pro-files (thin lines and symbols) scaled down by a factor of 2 are also shown in panels (a) and (c).
smaller at small aspect angles (large power and velocity) and increase with aspect angle (as power and velocity decrease) (Hamza and St.-Maurice, 1993), so that the fact that width has a local minimum at a range of maximum power does not necessarily support the spatial convolution scenario.
630–765 km, which supports our earlier conjecture that the echoes at these short ranges had a different origin. The dif-ferences in the elevation angle would be expected to be con-sistently more significant than the present 1◦–2◦, for the first case with echoes coming from two different heights to be a preferred option.
Furthermore, the maximum spectral width values reached were somewhat smaller than those expected from the dif-ference in typical velocities of the two populations. Thus, Danskin et al. (2004) demonstrated that a spectral width of 200 m/s typically corresponds to a difference in ve-locity between two spectral types of ∼150 m/s (see their Fig. 7). This is significantly lower than typical differences of 600−350=250 m/s observed in the present study. We con-clude from the above analysis that it is less likely that the trends observed are mostly due to the spatial convolution of two distinct types.
4 Conclusion
The HF echoes with Doppler velocities near the nominal value of the ion-acoustic speed Cs of 350 m/s and echoes with substantially greater velocities near 600 m/s may rep-resent two sides of the same phenomenon. Analysis of the spectral power and Doppler velocity variations with range shows that the echoes nearCscan be treated as aspect-angle-attenuated counterparts of the high-velocity echoes. This suggests that the HF echoes from both populations are gen-erated through the same mechanism with the linear fluid formalism describing observations reasonably well when a lower limit on the phase velocity is considered.
Acknowledgements. This research was supported by the Australian Research Council Discovery grant to R.A.M. (project DP0770366). The SuperDARN Pykkvibaer HF radar is operated by the Univer-sity of Leicester, UK and funded by the Science and Technology Facilities Council (UK), the Finnish Meteorological Institute, and the Swedish Institute for Space Physics.
Topical Editor M. Pinnock thanks D. Moorcroft and another anonymous referee for their help in evaluating this paper.
References
Bahcivan, H. and Hysell, D. L.: A model of secondary Farley-Buneman waves in the auroral electrojet, J. Geophys. Res., 111, A01304, doi:10.1029/2005JA011408, 2006.
Bahcivan, H., Hysell, D. L., Larsen, M. F., and Pfaff, R. F.: The 30 MHz imaging radar observations of auroral irregularities dur-ing the JOULE campaign, J. Geophys. Res., 110, A05307, doi: 10.1029/2004JA010975, 2005.
Carter, B. A. and Makarevich, R. A.: E-region decameter-scale plasma waves observed by the dual TIGER HF radars, Ann. Geo-phys., 27, 261–278, 2009,
http://www.ann-geophys.net/27/261/2009/.
Danskin, D. W., Koustov, A. V., Makarevitch, R. A., and Lester, M.: Observations of double-peaked E region coherent spectra
with the CUTLASS Finland HF radar, Radio Sci., 39, RS2006, doi:10.1029/2003RS002932, 2004.
Drexler, J. and St.-Maurice, J.-P.: A possible origin for large aspect angle “HAIR” echoes seen by SuperDARN radars in the E re-gion, Ann. Geophys., 23, 767–772, 2005,
http://www.ann-geophys.net/23/767/2005/.
Drexler, J., St.-Maurice, J.-P., Chen, D., and Moorcroft, D. R.: New insights from a nonlocal generalization of the Farley-Buneman instability problem at high latitudes, Ann. Geophys., 20, 2003– 2025, 2002, http://www.ann-geophys.net/20/2003/2002/. Farley, D. T.: The equatorial E-region and its plasma instabilities: a
tutorial, Ann. Geophys., 27, 1509–1520, 2009, http://www.ann-geophys.net/27/1509/2009/.
Fejer, B. G. and Kelley, M. C.: Ionospheric irregularities, Geophys. Rev., 18, 401–454, 1980.
Fejer, B. G., Providakes, J., Farley, D. T., and Swartz, W. E.: Auro-ral E region plasma waves and elevated electron temperatures, J. Geophys. Res., 91, 13583–13592, 1986.
Foster, J. C., Tetenbaum, D., del Pozo, C. F., St-Maurice, J.-P., and Moorcroft, D. R.: Aspect angle variations in intensity, phase ve-locity and altitude for high-latitude 34 cmEregion irregularities, J. Geophys. Res., 97, 8601–8617, 1992.
Greenwald, R. A., Ecklund, W. L., and Balsley, B. B.: Radar ob-servations of auroral electrojet currents, J. Geophys. Res., 80, 3635–3641, 1975.
Haldoupis, C.: A review on radio studies of auroral E region iono-spheric irregularities, Ann. Geophys., 7, 239–258, 1989. Hamza, A. and St-Maurice, J.-P.: Large aspect angles in auroral E
region echoes: A self-consistent turbulent fluid theory, J. Geo-phys. Res., 100, 5723–5732, 1995.
Hamza, A. M. and St.-Maurice, J.-P.: A turbulent theoretical frame-work for the study of current-driven E region irregularities at high latitudes: Basic derivation and application to gradient-free situa-tions, J. Geophys. Res., 98, 11587–11599, 1993.
Hanuise, C., Villain, J.-P., Cerisier, J. C., Senior, C., Ruohoniemi, J. M., Greenwald, R. A., and Baker, K. B.: Statistical study of high-latitude E region Doppler spectra obtained with SHERPA HF radar, Ann. Geophys., 9, 273–285, 1991.
Jayachandran, P. T., St.-Maurice, J.-P., MacDougall, J. W., and Moorcroft, D. R.: HF detection of slow long-lived E region plasma structures, J. Geophys. Res., 105, 2425–2442, 2000. Koustov, A. V., Igarashi, K., Andr´e, D., Ohtaka, K., Sato, N.,
Yam-agishi, H., and Yukimatu, A.: Observations of 50- and 12-MHz auroral coherent echoes at the Antarctic Syowa station, J. Geo-phys. Res., 106, 12875–12887, 2001.
Koustov, A. V., Danskin, D. W., Uspensky, M. V., Ogawa, T., Jan-hunen, P., Nishitani, N., Nozawa, S., Lester, M., and Milan, S.: Velocities of auroral coherent echoes at 12 and 144 MHz, Ann. Geophys., 20, 1647–1661, 2002,
http://www.ann-geophys.net/20/1647/2002/.
Koustov, A. V., Danskin, D. W., Makarevitch, R. A., and Gorin, J. D.: On the relationship between the velocity of E-region HF echoes and E×B plasma drift, Ann. Geophys., 23, 371–378, 2005, http://www.ann-geophys.net/23/371/2005/.
Kustov, A. V., Uspensky, M. V., Sofko, G. J., Koehler, J. A., and Mu, J.: Aspect angle dependence of the radar aurora Doppler velocity, J. Geophys. Res., 99, 2131–2144, 1994.
Res., 113, A09321, doi:10.1029/2008JA013204, 2008.
Makarevich, R. A., Senior, A., Koustov, A. V., Uspensky, M. V., Honary, F., and Dyson, P. L.: A study of aspect angle effects in theE-region irregularity velocity using multi-point electric field measurements, Geophys. Res. Lett., 33, L21102, doi:10.1029/ 2006GL027740, 2006.
Makarevich, R. A., Koustov, A. V., Senior, A., Uspensky, M., Honary, F., and Dyson, P. L.: Aspect angle dependence of the E-region irregularity velocity at large flow angles, J. Geophys. Res., 112, A11303, doi:10.1029/2007JA012342, 2007.
Makarevitch, R. A., Ogawa, T., Igarashi, K., Koustov, A. V., Sato, N., Ohtaka, K., Yamagishi, H., and Yukimatu, A.: On the power-velocity relationship for 12- and 50-MHz auroral coher-ent echoes, J. Geophys. Res., 106, 15455–15470, 2001. Makarevitch, R. A., Koustov, A. V., Igarashi, K., Sato, N., Ogawa,
T., Ohtaka, K., Yamagishi, H., and Yukimatu, A. S.: Comparison of flow angle variations of E-region echo characteristics at VHF and HF, Adv. Polar Upper Atmos. Res., 16, 59–83, 2002a. Makarevitch, R. A., Koustov, A. V., Sofko, G. J., Andr´e, D., and
Ogawa, T.: Multifrequency measurements of HF Doppler veloc-ity in the auroral E region, J. Geophys. Res., 107, 1212, doi: 10.1029/2001JA000268, 2002b.
Makarevitch, R. A., Honary, F., and Koustov, A. V.: Simultaneous HF measurements of E- and F-region Doppler velocities at large flow angles, Ann. Geophys., 22, 1177–1185, 2004,
http://www.ann-geophys.net/22/1177/2004/.
Milan, S. E. and Lester, M.: Simultaneous observations at differ-ent altitudes of ionospheric backscatter in the eastward electrojet, Ann. Geophys., 16, 55–68, 1998,
http://www.ann-geophys.net/16/55/1998/.
Milan, S. E. and Lester, M.: Spectral and flow angle characteristics of backscatter from decametre irregularities in the auroral elec-trojets, Adv. Space Res., 23, 1773–1776, 1999.
Milan, S. E. and Lester, M.: A classification of spectral populations observed in HF radar backscatter from the E region auroral elec-trojets, Ann. Geophys., 19, 189–204, 2001,
http://www.ann-geophys.net/19/189/2001/.
Milan, S. E., Yeoman, T. K., Lester, M., Thomas, E. C., and Jones, T. B.: Initial backscatter occurrence statistics from the CUT-LASS HF radars, Ann. Geophys., 15, 703–718, 1997,
http://www.ann-geophys.net/15/703/1997/.
Milan, S. E., Lester, M., and Sato, N.: Multi-frequency observations of E-region HF radar aurora, Ann. Geophys., 21, 761–777, 2003, http://www.ann-geophys.net/21/761/2003/.
Milan, S. E., Lester, M., Yeoman, T. K., Robinson, T. R., Uspensky, M. V., and Villain, J.-P.: HF radar observations of high-aspect angle backscatter from the E-region, Ann. Geophys., 22, 829– 847, 2004, http://www.ann-geophys.net/22/829/2004/.
Moorcroft, D. R.: Outstanding issues in the theory of radar aurora: Evidence from the frequency dependence of spectral character-istics, J. Geophys. Res., 107, 1301, doi:10.1029/2001JA009218, 2002.
Nielsen, E.: Aspect angle dependence of mean Doppler velocities of 1-m auroral plasma waves, J. Geophys. Res., 91, 10173–10177, 1986.
Ogawa, T., Balsley, B. B., Ecklund, W. L., Carter, D. A., and John-ston, P. E.: Aspect angle dependence of irregularity phase veloc-ities in the auroral electrojet, Geophys. Res. Lett., 7, 1081–1084, 1980.
Sahr, J. and Fejer, B. G.: Auroral electrojet plasma irregularity theory and experiment: A critical review of present understand-ing and future directions, J. Geophys. Res., 101, 26893–26909, 1996.
St.-Maurice, J.-P., Prikryl, P., Danskin, D. W., Hamza, A. M., Sofko, G. J., Koehler, J. A., Kustov, A., and Chen, J.: On the origin of narrow non-ion-acoustic coherent radar spectra in the high-latitude E region, J. Geophys. Res., 99, 6447–6474, doi:10.1029/ 93JA02353, 1994.
Uspensky, M., Koustov, A., Janhunen, P., Pellinen, R., Danskin, D., and Nozawa, S.: STARE velocities: the importance of off-orthogonality and ion motions, Ann. Geophys., 21, 729–743, 2003, http://www.ann-geophys.net/21/729/2003/.
Uspensky, M. V., Kustov, A. V., Sofko, G. J., Koehler, J. A., Villain, J.-P., Hanuise, C., Ruohoniemi, J. M., and Williams, P. J. S.: Ionospheric refraction effects in slant range profiles of auroral HF coherent echoes, Radio Sci., 29, 503–517, 1994.
Uspensky, M. V., Koustov, A. V., Eglitis, P., Huuskonen, A., Milan, S. E., Pulkkinen, T., and Pirjola, R.: CUTLASS HF radar ob-servations of high-velocity E-region echoes, Ann. Geophys., 19, 411–424, 2001, http://www.ann-geophys.net/19/411/2001/. Villain, J. P., Greenwald, R. A., Baker, K. B., and Ruohoniemi,
J. M.: HF radar observations of E region plasma irregularities produced by oblique electron streaming, J. Geophys. Res., 92, 12327–12342, 1987.