www.biogeosciences.net/7/1223/2010/
© Author(s) 2010. This work is distributed under the Creative Commons Attribution 3.0 License.
Biogeosciences
Spatial and temporal effects of drought on soil CO
2
efflux in a cacao
agroforestry system in Sulawesi, Indonesia
O. van Straaten1, E. Veldkamp1, M. K¨ohler2, and I. Anas3
1Buesgen-Institute, Soil Science of Tropical and Subtropical Ecosystems, Georg-August-University of Goettingen, Buesgenweg 2, 37075 Goettingen, Germany
2Burckhardt-Institute, Tropical Silviculture and Forest Ecology, Georg-August-University of Goettingen, Buesgenweg 2, 37075 Goettingen, Germany
3Department of Soil Science, Faculty of Agriculture, Bogor Agricultural University (IPB), Jl. Raya Pajajaran Bogor 16143, Indonesia
Received: 25 November 2009 – Published in Biogeosciences Discuss.: 15 December 2009 Revised: 4 April 2010 – Accepted: 7 April 2010 – Published: 9 April 2010
Abstract. Climate change induced droughts pose a
seri-ous threat to ecosystems across the tropics and sub-tropics, particularly to those areas not adapted to natural dry peri-ods. In order to study the vulnerability of cacao (Theo-broma cacao) – Gliricidia sepium agroforestry plantations to droughts a large scale throughfall displacement roof was built in Central Sulawesi, Indonesia. In this 19-month ex-periment, we compared soil surface CO2efflux (soil respira-tion) from three roof plots with three adjacent control plots. Soil respiration rates peaked at intermediate soil moisture conditions and decreased under increasingly dry conditions (drought induced), or increasingly wet conditions (as evi-denced in control plots). The roof plots exhibited a slight decrease in soil respiration compared to the control plots (av-erage 13% decrease). The strength of the drought effect was spatially variable – while some measurement chamber sites reacted strongly (responsive) to the decrease in soil water content (up to R2=0.70) (n=11), others did not react at all (non-responsive) (n=7). A significant correlation was measured between responsive soil respiration chamber sites and sap flux density ratios of cacao (R=0.61) and Gliri-cidia (R=0.65). Leaf litter CO2 respiration decreased as conditions became drier. The litter layer contributed approx-imately 3–4% of the total CO2efflux during dry periods and up to 40% during wet periods. Within days of roof opening soil CO2efflux rose to control plot levels. Thereafter, CO2
Correspondence to: O. van Straaten ([email protected])
efflux remained comparable between roof and control plots. The cumulative effect on soil CO2 emissions over the du-ration of the experiment was not significantly different: the control plots respired 11.1±0.5 Mg C ha−1yr−1, while roof plots respired 10.5±0.5 Mg C ha−1yr−1. The relatively mild decrease measured in soil CO2efflux indicates that this agro-forestry ecosystem is capable of mitigating droughts with only minor stress symptoms.
1 Introduction
largely dependent on the mechanisms it has available to adapt to droughts. The presence or absence of deep root systems is one such response mechanism. Studies carried out in tropical forests of Latin America suggest that ecosystems with deep rooted trees are more capable of mitigating drought effects (Davidson et al., 2004; Nepstad et al., 1994).
Droughts in Indonesia pose a potential threat to both nat-ural forest ecosystems and agricultnat-ural production systems for example cacao (Theobroma cacao L.). In the last 25 years, Indonesia has experienced a boom in cocoa produc-tion and has since become the third largest producer of coa beans worldwide (FAO, 2009). Nearly 80% of the co-coa beans produced in Indonesia are grown in Sulawesi. It is unknown how well cacao agroforestry plantations adapt to drought conditions, although a recent socio-economic survey by Keil et al. (2008) in central Sulawesi found that cocoa pro-duction is vulnerable to drought. Unlike cacao trees which tend to have a shallow rooting architecture (Kummerow et al., 1982), agroforestry over-story trees such as Gliricidia (Gliricidia sepium (Jacq.) Kunt ex Steud.) often have deeper root systems.
To date, little has been published on below-ground car-bon dynamics in agroforestry systems (Bailey et al., 2009; Hergoualc’h et al., 2008; Oelbermann et al., 2006), and as far as we are aware, no soil CO2efflux measurements have been carried out in tropical agroforestry systems in relation to drought stress.
In this experiment, we investigated how soil CO2 efflux in a cacao – Gliricidia agroforestry plantation in central Su-lawesi, Indonesia reacted to an experimental drought. In an earlier paper by Schwendenmann et al. (2010) it was shown that this agroforest was surprisingly resilient to drought which was explained by a combination of complementary use of soil water resources and acclimation. The specific re-search objectives for this study were twofold:
1. to determine how belowground CO2 production and surface soil CO2efflux reacted to a simulated drought and the subsequent rewetting phase;
2. to identify the controls driving CO2production. At the beginning of the experiment we suspected that this agroforestry system would be vulnerable to drought stress and hypothesized that soil respiration rates would show strong decreases across the plantation. After the end of the simulated drought we expected a CO2production flush in the drought plots.
2 Materials and methods
2.1 Site description
The drought simulation experiment was conducted in a seven year old cacao agroforestry plantation on the western periph-ery of the Lore Lindu National Park (1.552◦S, 120.020◦E)
in Central Sulawesi, Indonesia at an elevation of 560 m above sea level (asl). Established in December 2000, the plantation was composed of a Gliricidia overstory (∼330 trees ha−1) and a cacao understory (∼1030 trees ha−1). The ground was largely devoid of undergrowth herbs and grasses except for a few patches of grass in open areas. We selected a site that was located on a gentle slope (8–12◦), where the ground wa-ter table (>4.5 m) was deeper than the tree rooting zone. The region experiences two mild rainy seasons per year. The av-erage annual precipitation from 2002 to 2006 at the Gimpu meteorological station (417 m a.s.l.) five kilometers south of the experimental site was 2092 mm. The mean annual tem-perature was 25.5◦C (Schwendenmann et al., 2010).
The soil has been classified as a Cambisol with a sandy loam texture (Leitner and Michalzik, unpublished data). The top 75 cm of soil has a relatively homogeneous tex-ture, a stone content of 15–25% and a bulk density of 1.31±0.06 g cm−3 (measured using the undisturbed core method described by Blake and Hartge, 2006). Below 75 cm the sub-soil is heterogeneous, made up of saprolite, irregular granitic rock fragments embedded in a quartz-feldspar rich loam. The bulk density of the subsoil is 1.56±0.08 g cm−3. Soil chemical and physical properties are summarized in Ta-ble 1.
While the majority of cacao fine roots (diameter<2 mm) are predominantly concentrated at the soil surface (top 40 cm), the Gliricidia fine roots penetrate to greater depths (Moser et al., 2010). Fine roots of both tree species extended to a maximum depth of 2.4 m.
2.2 Experimental design
Table 1. Soil physical and chemical characteristics of the cacao agroforestry site in Sulawesi, Indonesia.
Sampling depth Bulk density Soil Texture Carbon Nitrogen ECEC Soil pH (cm) (g cm−3) Sand (%) Silt (%) Clay (%) (g kg−1) (g kg−1) (cmol kg−1) (H2O)
Control Plots
−5 1.27±0.02 60.7±1.7 25.7±0.2 13.6±1.6 16.6±1.4 1.5±0.1 7.7±1.3 5.8±0.3
−10 1.31±0.01 54.1±1.8 31.1±2.4 14.8±1.3 10.7±1.3 1.0±0.1 6.6±0.6 5.6±0.1
−20 1.33±0.02 55.1±1.0 28.3±0.9 16.5±0.5 6.4±0.1 0.6±0.0 7.3±1.3 5.9±0.3
−40 1.31±0.02 53.9±0.0 25.5±1.2 20.6±1.2 4.2±0.3 0.4±0.0 5.3±0.8 5.7±0.0
−75 1.36±0.08 58.6±2.8 22.2±2.6 19.2±1.8 3.4±0.3 0.4±0.0 7.5±1.9 5.9±0.0 Roof Plots
−5 1.23±0.02 59.6±0.9 28.4±1.8 12.1±2.7 16.3±2.4 1.6±0.2 9.9±1.2 6.0±0.1
−10 1.26±0.02 55.9±1.1 28.2±1.8 16.0±1.1 14.5±2.9 1.3±0.2 9.0±0.3 6.4±0.1
−20 1.30±0.00 56.2±3.0 28.1±2.6 15.6±0.4 7.7±1.1 0.7±0.1 7.9±0.1 6.3±0.0
−40 1.32±0.04 56.1±1.7 27.4±2.6 16.6±1.6 4.6±0.1 0.4±0.0 5.6±0.2 6.0±0.1
−75 1.37±0.01 57.3±1.2 23.4±1.5 19.3±0.9 3.3±0.2 0.4±0.0 7.9±2.5 5.8±0.3
Notes: mean value (±1 SE);n=3. ECEC: effective cation exchange capacity.
All measurements were made within a “core zone” (30×25 m) in the plot, leaving a 5 m buffer zone along the in-side of the plot boundary to avoid edge effects. Per plot one central soil pit (0.8 m width×1.6 m length×3.0 m depth) was dug and equipped with gas samplers, thermocouples and soil moisture probes. Three parallel transects per plot were set up within the “core zone” for soil CO2 flux measure-ments.
The experiment began in late January 2007, one month prior to the roof closure in the treatment plots. Pre-treatment measurements were made to verify that control and roof plots did not exhibit any initial systematic differences. The roof was closed at the beginning of March 2007 and re-mained closed for 13 months. The roof was opened in mid April 2008 and measurements continued for an additional five months to monitor the recovery of the ecosystem.
2.3 Soil surface CO2efflux measurements
We determined the soil surface CO2efflux (soil respiration) using dynamic closed chambers (Parkinson, 1981; Norman et al., 1992). At each plot, two circular polyvinyl chloride (PVC) chamber bases (0.045 m2 area, 0.15 m height) were set up in each of the three parallel transects. In total six chambers were established per plot. In the roof plots, cham-ber bases were located under a range of roof closure con-ditions ranging from tightly closed to relatively open with more gaps. The chambers were established between 1.1 and 2.1 m from the nearest tree. During installation, chamber bases were embedded 1–2 cm into the soil surface. Prior to each measurement we removed all emergent vegetation from inside the chamber base and fanned the air above the chamber for at least one minute in order to bring the soil surface CO2concentrations to near atmospheric
concentra-tions. We also measured the chamber height at three places around the chamber base in order to get a good estimate of air volume within the chamber headspace. Measurements entailed attaching a chamber hood (12 cm height) tightly to the chamber base. Air in the headspace was subsequently circulated by a small battery-operated pump at a rate of 0.8 L min−1between the chamber and an infrared CO2gas analyzer (IRGA) (LI-800; Li-Cor Inc., Lincoln, NE, USA). The chamber was closed for 5 min 30 s. Atmospheric pres-sure was maintained within the chamber during meapres-sure- measure-ments by using a small metal vent (0.1 cm diameter and 2.5 cm length) installed on top of the chamber hood. Car-bon dioxide concentrations were recorded every 5 s using a datalogger (Campbell CR800). A two point calibration of the infrared CO2 gas analyzer was done in the laboratory between sampling expeditions. The first point calibration was with a “zero” standard gas, which was created by re-moving CO2from the air by running air in a loop through a scrubber column of soda lime (4–8 mesh). The second point calibration was made using a CO2 standard gas (700 ppm, Deuste Steininger GmbH, M¨uhlhausen, Germany), while a third CO2standard gas (356 ppm, Deuste Steininger GmbH, M¨uhlhausen, Germany) was used to test the quality and ac-curacy of the calibration.
05:00 p.m. The sequence in which plots were measured was randomized during each sampling expedition to minimize ef-fects from diurnal fluctuations. In total, 36 soil respiration measurements were made per sampling expedition using the portable infrared CO2gas analyzer. During the experimen-tal period we carried out 47 sampling expeditions. Due to an equipment failure with the IRGA we did not measure soil respiration in August 2007.
To study the contribution of leaf litter to CO2efflux, we randomly selected two experiment chambers in each control plot (in total 6 chambers). At each of the selected chambers, two additional chambers were installed directly adjacent to the “main” chamber (<1 m away). We removed litter from one chamber and placed it into the second chamber. The “main” chamber was left undisturbed and used as a control. The differences in CO2 efflux between the three chambers were compared. The CO2produced from the litter layer was calculated by subtracting the CO2flux respired by the “main” chamber from that respired by the litter-removed chamber. Measurements were made during 36 sampling expeditions.
2.4 Soil air CO2concentrations and soil moisture depth profiles
Gas samples for CO2concentration analyses were collected from one central soil pit per plot. Samples were taken bi-weekly in conjunction with soil respiration measurements. The gas samplers consisted of thin stainless-steel tubes (1 mm inner diameter), where one end was perforated with small holes and the other end was fitted with an airtight sep-tum holder. The samplers were inserted horizontally into the soil profile at 10, 20, 40, 75, 150 and 250 cm depths. Sam-plers in the top 75 cm were 1 m in length, while the samSam-plers inserted at greater depths (150 and 250 cm) were slightly longer (1.5 m) to take into consideration the diffusion losses near the soil pit wall. Each sampler was equipped with a thermocouple (Type K) at its tip so that temperature could be recorded at the time of sampling with a handheld unit (Greisinger GMH 3210). Before taking a gas sample, 5 mL of air was extracted and discarded to clear the sampler of any stagnant “dead” air. We took the gas samples by connecting a pre-evacuated, air-tight glass vial (50 mL) to the sampler’s septum holder with a syringe needle and short flexible plas-tic tube. A two-way stop valve on the glass vial was then opened to suck in the gas sample. A sample was also taken at the soil surface by sticking a polypropylene syringe (with 5 cm needle) into the ground and drawing a sample.
Samples were analyzed in a laboratory at Tadulako Uni-versity in Palu, Sulawesi, within 72 h after collection in the field. We measured the CO2 concentration of each sample using a gas chromatograph (GC) (GC-11, Delsi Instruments, Suresnes, France) with thermal conductivity detector (TCD). Sample CO2 concentrations were calculated by comparing the integrated peak areas to that of two known standard gas
concentrations (0.07% and 3.5%, Deuste Steininger GmbH, M¨uhlhausen, Germany), to make a two point calibration.
In addition to the CO2concentration and temperature mea-surements, volumetric soil water content was also measured using TDR sensors (Campbell CS616) in three soil pits per plot. TDR sensors were installed adjacent to each gas sam-pler, in the central pit, by inserting them into the undis-turbed soil at the end of a 30 cm hole dug horizontally into the soil pit wall. Soil moisture was recorded hourly using a datalogger (Campbell CR1000). Due to high rock content we could not install TDR sensors in three plots at 250 cm depth. Using undisturbed soil samples we calibrated the wa-ter content measurements using the methodology described by Veldkamp and O’Brien (2000). Volumetric water content was recalculated to soil matric potential using soil water re-tention curves developed by van Straaten (unpublished data). Soil CO2concentration measurements were made during 46 field sampling expeditions, in conjunction with the IRGA soil respiration measurements. One additional was missed due to a large landslide that limited access to the site with the gas sampling equipment.
2.5 CO2leaching losses
The downward CO2leaching flux was determined by multi-plying the amount of CO2dissolved in water with modeled drainage rate estimates. According to Henry’s Law, CO2 dis-solved in water is proportional to the partial pressure of CO2 above the solution and the CO2 Bunsen absorption coeffi-cient. When CO2 dissolves into water it can produce two possible reactions (Eqs. 1 and 2). The solubilization of CO2 gas:
CO2(gas)→CO2(aq) (1)
and hydration of CO2(aq) to form carbonic acid
CO2(aq)+H2O→H2CO3(aq) (2)
However, given the low proportion of H2CO3(aq) relative to CO2(aq) it is possible to lump their concentrations together with Henry’s Law. The dissolved CO2was calculated as fol-lows:
M-CO2w=CO2a×VWC×B (3)
Where: M-CO2w is the CO2 content dissolved in the liq-uid phase (g CO2m−3), CO2ais the partial pressure of CO2 (concentration) in the soil air (g CO2m−3)at atmospheric air pressure, VWC is the soil’s volumetric water content andB is the Bunsen solubility coefficient for CO2. The Bunsen co-efficient is the volume of gas that can be absorbed by one cubic meter of water at standard atmospheric air pressure, at 24◦C, the CO2Bunsen coefficient is 0.7771 g m−3.
Subsequently, dissolved CO2was multiplied with daily mod-eled soil water drainage to determine CO2 leaching losses. Soil drainage from roof and control plots were modeled us-ing HYDRUS 1-D ( ˇSimnek et al., 2008) with measured tran-spiration rates, net precipitation and soil water contents as input. The method has been described in greater detail in K¨ohler (2010). Leaching losses were calculated only from 10 February, 2007 to 5 June, 2008 because of the shorter time frame in which soil water drainage was modeled.
2.6 Isotope analysis
To identify the origin of the high CO2concentrations in deep soil,13CO2isotope signatures were measured. One soil air sample was taken from each plot at 250 cm depth, stored in airtight, stainless steel vials and transported to the Center for Stable Isotope Research and Analysis (KOSI, Georg-August-University G¨ottingen, Germany) for analysis using a Isotope Ratio Mass Spectrometer (Finnigan MAT Delta Plus, Bre-men, Germany).
2.7 Data analysis
We divided the experiment into four time periods. The first was the “pre-treatment period” which started on 27 January, 2007 and lasted until the roof was closed on 1 March, 2007 – a total of 33 days. The period of roof closure was sub-sequently divided into two periods, the first being the initial ten months when the drought effect was mild, hereafter re-ferred to as treatment period #1 (from 1 March 2007 to 1 January 2008; 306 days), followed by treatment period #2, which corresponded to the time when the drought effect was more pronounced and ran until 10 April 2008 when the roof was opened (100 days). The fourth was the “post-treatment period” which extended until 27 August, 2009 (139 days). Throughout the experiment, roof plot measurements were compared to adjacent control plot measurements to decipher roof plot ecosystem drought response from normal fluctu-ations. Individual soil CO2 efflux chamber measurements were averaged for each plot at each measurement date and logarithmically transformed to normalize data distributions. The significance of the drought effect difference was tested using linear mixed effects models for the four time periods mentioned above. In the model, the drought treatment was considered a fixed effect while the measurement day (from day 1 to day 579) and plot were considered random effects. Differences were considered significant ifP ≤0.05. Addi-tionally, temporal autocorrelation in this time series CO2flux dataset was corrected for by using a first order autoregressive model.
We used a multiple linear regression analyses to establish predictive relationships between temporal soil CO2 efflux, soil moisture and soil temperature. We stratified the data into three soil moisture classes: wet (pF≤1.2), intermedi-ate (1.2<pF≤1.7) and dry (pF>1.7). Subsequently, for each
class we determined the variability of CO2efflux explained by the two variables (coefficient of determination). Correla-tion coefficients for soil temperature and soil moisture were determined to test the strength of the correlation between the two independent variables.
Additionally, to discern the extent of autotrophic respira-tion and belowground tree drought reacrespira-tions, we tested how soil CO2efflux correlated with Gliricidia and cacao sap flux densities, solar radiation, and the chamber distance from ad-jacent trees respectively using simple linear regressions. All statistical analyses were done using the statistical package R version 2.8.1 (R Development Core Team, 2008).
3 Results
3.1 Volumetric soil water content and soil temperature
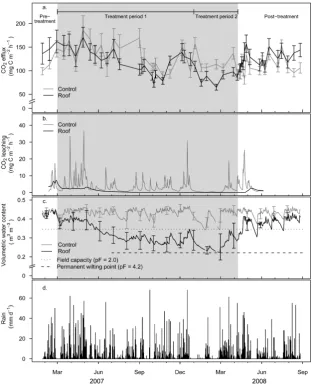
During the pre-treatment phase, volumetric soil water con-tent of all six experiment plots were in the same range for each respective sampling depth (Fig. 1c). Approximately ten days after roof closure, soil water contents began to diverge between the control and roof plots. Soil moisture contents in the plots under the roof decreased simultaneously at all depths, apart from the depth of 250 cm which began drying out only after a period of two and a half months. Although gaps in the roof did allow some throughfall to enter, the water recharge was limited to the upper soil layers and was never sufficient to recharge the soil under roof to control plot lev-els. A natural drought in January–February 2008 reduced soil water contents in both roof and control plots. The dry-ing effect was recorded down to 250 cm depth in the control plots. Minimum soil water contents in the roof plots were ex-perienced during this dry spell. Upon roof opening in April 2008, soil water contents in the roof plots quickly rose to near control plot levels.
Soil surface temperature exhibited little fluctuation throughout the duration of the experimental period, ranging from a minimum temperature of 21.8◦C to a maximum tem-perature of 24.8◦C. The average soil temperature at 5 cm depth was unaffected by the roof installation, measuring 23.2±0.8◦C and 23.0±0.7◦C (mean±SD) for the roof and control plots respectively. At 250 cm depth, soil tempera-tures were slightly higher than at the surface and averaged 24.0±0.4◦C (mean±SD).
3.2 Soil surface CO2efflux
Fig. 1. (a) Average soil surface CO2efflux in control and roof plots, (b) average CO2leaching losses in control and roof plots, (c) average
volumetric water content at 10 cm soil depth in control and roof plots and (d) daily precipitation. Error bars indicate±1 SE. The shaded area indicates the period of roof closure.
During the pre-treatment phase, soil CO2 efflux mea-surements was not significantly different between roof and control plots (roof: 142.5±32.9 mg C m−2h−1, control: 118.0±18.2 mg C m−2h−1 (mean±standard error, n=3)) (Fig. 1a). In the first ten months of the simulated drought (treatment period #1) soil CO2 efflux treatment means did not deviate significantly (roof: 124.1±8.5 mg C m−2h−1, control: 136.9±10.9 mg C m−2h−1 (mean±standard error, n=21)). The onset of a natural dry spell, combined with improved roof closure finally caused roof plot CO2 efflux to drop significantly below the control for the re-maining three months of the simulated drought (treat-ment period #2). During this time, soil respiration in the roof plots decreased by 26% (P <0.05) in compar-ison to the control (roof: 85.5±8.2 mg C m−2h−1, con-trol: 115.9±9.9 mg C m−2h−1 (mean±standard error, n=
7)). The overall difference in average soil CO2 efflux be-tween the control and the roof plots was relatively minor during the 13-month simulated drought. Soil CO2efflux de-clined only slightly (13%) in the roof plots in comparison to the control plots (roof: 119.5±5.4 mg C m−2h−1, control: 126.2±5.4 mg C m−2h−1(mean±standard error,n=47)).
Within three days of opening the roof, in April 2008, soil CO2efflux rose to control plot levels. No pronounced CO2 efflux peak was measured and over the next five months the average roof plot CO2 efflux did not significantly dif-fer from the control (roof: 129.1±13.6 mg C m−2h−1, con-trol: 111.9±6.7 mg C m−2h−1 (mean±standard error, n=
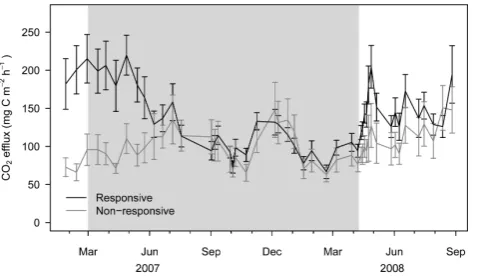
[image:6.595.141.454.64.451.2]Fig. 2. Soil CO2efflux from drought responsive efflux chambers and non-responsive efflux chambers in the roof plots. Error bars in-dicate±1 SE. The shaded area indicates the period of roof closure.
The cumulative CO2respired from control and roof plots were not significantly different, indicating the drought had a CO2 neutral effect. The cumulative CO2 flux from the 579-day experiment was 17.5±0.75 mg C ha−1 and 16.6±0.74 mg C ha−1for the control and roof plots respec-tively. Annually this equates to 11.1±0.5 Mg C ha−1yr−1for the control plot and 10.5±0.5 mg C ha−1yr−1 for the roof plot.
Although the overall drought response in the roof plots was moderate, 11 of the 18 efflux chambers in the roof plots exhibited stronger drought effects than the others (Fig. 2). Drought effects were most pronounced at chamber sites al-ready producing high CO2before the roof closure. We used the coefficient of determination (R2)of a linear regression between CO2 efflux and the soil moisture as an index of drought response (hereafter called the “drought response in-dex”) and plotted it spatially (Fig. 3). The drought response appeared to be localized, as some chamber sites measured strong relationships to soil water content changes (up to R2=0.70), while other chambers located nearby measured little to no response to decreasing soil water contents.
Over the course of the 19-month measurement period, no distinguishable seasonal patterns in either precipitation (Fig. 1d) or in air temperature were measured (data not shown).
3.3 Controls regulating CO2efflux
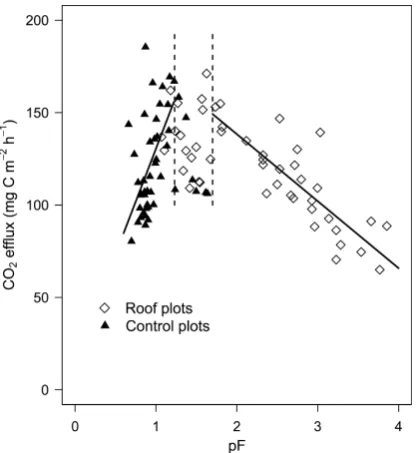
Soil CO2 efflux exhibited a strong relationship with soil moisture. CO2efflux peaked under intermediate soil mois-ture contents (between pF 1 and 2) and decreased when con-ditions became either wetter (R2=0.34,p <0.01), or drier (R2=0.71,p <0.01) (Fig. 4). The rate of change (slope) at the wet end of the moisture spectrum was steeper than at the drier end. At the wet end of the moisture spectrum (pF≤1.2), soil moisture accounted for 39% of the CO2efflux variation, while soil temperature accounted for 9% (P <0.01). At in-termediate soil moisture (1.2<pF≤1.7) neither soil
tempera-Fig. 3. Schematic of cacao agroforestry plot layout and response of
CO2flux chambers to soil water content changes. The coefficient of determination (R2)for the CO2efflux to volumetric water content
was used as an index of how strong a chamber reacted to changes in soil moisture.
ture nor soil moisture could explain the variability exhibited in CO2 efflux. Lastly, under dry conditions (pF>1.7) soil moisture accounted for 73% (P <0.01) of the CO2 efflux variation while the soil temperature influence was insignifi-cant. Soil moisture and soil temperature were not correlated at any of the three soil moisture categories.
A weak diurnal pattern was detected in soil respiration in the control plots, whereby CO2 efflux was lowest early in the early morning between 06:00 a.m. and 08:00 a.m. (107.6±12.6 mg C m−2h−1) and rose steadily throughout the day reaching a maximum in the mid-afternoon be-tween 02:00 and 04:00 p.m. (142.0±8.6 mg C m−2h−1, mean±1 SE).
Soil respiration was found to decrease with distance from cacao tree stems (R2=0.22,P <0.01), but showed no rela-tionship with distance from Gliricidia trees. In the roof plots, the CO2drought response index declined with distance from cacao tree stems (R2=0.23,P =0.053), but showed no re-lationship with distance to Gliricidia tree stems.
3.4 Leaf litter respiration
[image:7.595.311.547.63.206.2]Fig. 4. Relationship between soil water potential (pF) at 10 cm
depth and soil CO2efflux. The regression equation at the wet end
of the moisture spectrum is CO2efflux=114.35(pF)+16.13 (R2=
0.34,P >0.01) and at the dry end CO2efflux=−36.26(pF)+210.86
(R2=0.71,P >0.01).
contribution to the overall control plot CO2flux over the du-ration of experiment is shown in Fig. 5.
3.5 Soil profile CO2concentrations
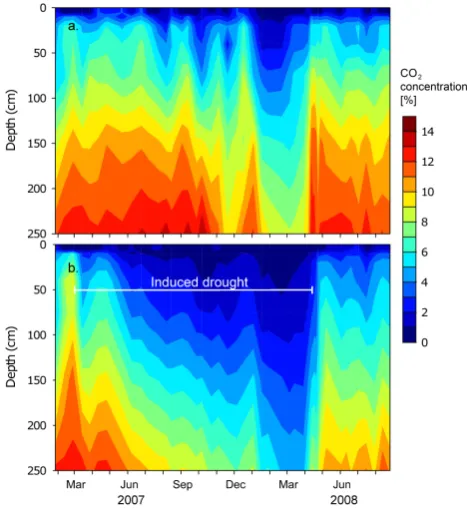
Soil CO2concentrations increased with soil depth, display-ing an exponential shape in concentration rise. CO2 concen-trations near the soil surface (0–10 cm) were relatively low and increased rapidly with depth (between 20–75 cm depth) and approached an asymptote at deeper soil depths (150– 250 cm). The average CO2 concentration at 250 cm depth was 11.8% in the control plots over the duration of the exper-iment. This is more than 300 times higher than atmospheric CO2. The highest recorded CO2concentration was 15.3% in October 2007 in one of the control plots.
[image:8.595.64.274.61.288.2]During the pre-treatment period, soil CO2concentrations in the control and treatment plots were similar for each re-spective soil depth (Fig. 6). Upon roof closure, CO2 concen-trations in the roof plots began to decline in conjunction with the drying out of the soil profile. Carbon dioxide concentra-tions declined steadily over the 13-month treatment period and reached a minimum level in the last month of the in-duced drought. In comparison to the control plots, roof plot soil CO2 concentrations decreased by up to 83% at 10 cm depth and up to 48% at 250 cm depth. During the driest pe-riod of the simulated drought (treatment pepe-riod #2) the soil CO2 concentration depth profile was nearly linear in shape, supposedly saturating at a deeper depth than from which we
Fig. 5. CO2efflux from leaf litter contribution study in the control
plots. The dark grey color indicates the CO2production derived from leaf litter, while the light grey color denotes the CO2
produc-tion from within the soil profile from other sources. The error bars indicate the standard error of the six measurements per sampling date.
sampled. Although CO2concentrations in the control plots remained relatively constant throughout the treatment period, a sharp drop was measured at all soil depths in January– February 2008, during a phase of natural drought. When we opened the roof in April 2008, CO2concentrations rose quickly; within a one month period CO2concentrations at all depths rose to near control plot levels whereby CO2 concen-trations at shallower depths rose faster than in the subsoil. Thereafter, CO2 concentrations leveled off, and remained lower than the control plot until the end of the experiment in August 2008.
Theδ13C isotope signature of the six CO2gas samples was
−23.6±0.19‰ (mean±SD) indicating that the CO2present in the soil profile is biologically produced and most likely produced by C3plants – e.g. cacao and Gliricidia.
3.6 CO2leaching losses
In the control plots, 93% of the total carbon dioxide was stored in soil water as aqueous CO2while the remaining 7% was present in the gaseous phase. In the roof plots, on aver-age 65% of the total CO2was dissolved in soil water.
Dissolved CO2drainage losses during the experiment are shown in Fig. 1b. In the control plots, CO2leaching losses spiked during periods of high drainage. They reached as high as 36.5 mg C m−2h−1(15% of the total CO
[image:8.595.310.547.62.178.2]4 Discussion
4.1 CO2fluxes in a cacao agroforestry system
As far as we are aware, this study represents the first in situ measurements of soil CO2 dynamics of a cacao agro-forestry ecosystem. Measured CO2efflux rates indicate that the ecosystem is very productive as respiration rates were within or slightly below the range measured in tropical for-est ecosystems in Asia (Adachi et al., 2006; Ohashi et al., 2008), and in Latin America (Davidson et al., 2000, 2008; Schwendenmann et al., 2003; Sotta et al., 2006).
The main controlling variable driving temporal variation in soil CO2efflux in this ecosystem was soil moisture. Soil respiration peaked at intermediate soil water contents and de-clined under both wetter and drier conditions (Fig. 4). Unlike the gradual decline observed in soil respiration when condi-tions got drier (as was observed in the roof plots and will be discussed later), soil respiration rates in the control plots of-ten plummeted when moist soil became slightly wetter. This is evident by the steep slope shown at the wet end of the moisture spectrum in Fig. 4. As a result, the CO2flux in the control plots exhibited strong efflux fluctuations with minor changes in soil moisture. The reduction in soil CO2 efflux under the saturated conditions may be a result of a diffusion block that prevented CO2from exiting the soil through the saturated pore space, and/or prevented oxygen from diffus-ing into the soil – subsequently creatdiffus-ing anaerobic conditions (Luo and Zhou, 2006).
CO2production from the leaf litter was sensitive to mois-ture conditions. When external conditions were wet the litter layer contributed as much as 40% of the total CO2 efflux, however when conditions were dry, the CO2 contributions from the litter layer was nearly zero percent.
Soil temperature displayed a slightly positive relationship with soil CO2efflux at the wet end of the soil moisture spec-trum. The temperature influence, however, was very minor given the small temperature variation (in total 3◦C) expe-rienced during the 19-month experimental period. In con-trast to studies conducted in rainforests in the Amazon basin (Wofsy et al., 1988) and in Costa Rica (Schwendenmann et al., 2003), the effect of solar radiation on plant photosynthe-sis was not observed in the soil respiration measurements for this site.
[image:9.595.309.543.63.318.2]Dissolved CO2leaching beyond 250 cm soil depth proved to be only a minor CO2flux (Fig. 1b). Considering the high proportion of CO2stored in the liquid phase, the overall CO2 leaching flux from below 250 cm was relatively low (3.5 and 0.8 mg C m−2h−1 for control and roof plots respectively). This is in line or slightly higher than CO2leaching fluxes re-ported by studies in tropical forests in Latin America (John-son et al., 2008; Schwendenmann and Veldkamp, 2006). The diffusion of CO2through soil water along the CO2 concen-tration gradient is considered negligible since liquid phase
Fig. 6. Isopleths of average soil CO2concentrations (percent) in the
soil profile of (a) control plots and (b) roof plots in soil air through-out the drought experiment.
diffusion (in free water) is more than 8000 times slower than CO2transport through free air (Moldrup et al., 2000).
4.2 Drought effects on soil CO2efflux
Since pre-treatment soil CO2efflux averages did not signifi-cantly differ between control and roof plots, subsequent dif-ferences exhibited during the period of roof closure are at-tributed to ecosystem drought responses. Though soil CO2 efflux drought effects were not significantly different dur-ing the first 10 months (treatment period #1), a natural dry spell (and improved roof closure) in early 2008 was pivotal in causing significant CO2efflux declines in the following three months (treatment period #2). The decreases in soil CO2efflux coincided with drought stress symptoms exhib-ited in both cacao and Gliricidia trees (Schwendenmann et al., 2010).
dry in roof plots. However, unlike the control plots where slightly wetter conditions caused soil respiration to decrease rapidly, the drying process observed in the roof plots caused a slow decrease in soil respiration (evident by the gradual slope at the dry end of the moisture spectrum in Fig. 4).
We have several indirect indications that different CO2 sources reacted differently to drought stress. The first indi-rect indication comes from the spatial variability of soil res-piration across the project area. While eleven efflux chamber sites in the roof plots showed relatively strong declines in soil CO2efflux as the soil dried out, the other seven efflux cham-bers, often just a few meters away, exhibited little to no re-action (Fig. 2 and Fig. 3). This localized drought response is indicative of the contrasting processes taking place directly below the respective chambers. Under some chambers soil respiration was dominated by CO2 production sources sen-sitive to moisture stress (under responsive chambers), i.e. root respiration, while under other chambers the CO2efflux was dominated by sources more resilient to drier conditions (non-responsive chambers) i.e. soil micro-organism respira-tion. The second indirect indication was that soil CO2efflux from chambers that exhibited strong drought response corre-lated closely to the sap flux ratios of both cacao (R=0.61, P <0.01) and Gliricidia trees (R=0.65, P=0.01) as re-ported by Schwendenmann et al. (2010). In contrast, those chambers that did not exhibit a drought sensitive CO2 ef-flux did not correlate significantly with sap ef-flux density. Al-though this does not necessarily establish a causal relation-ship between soil CO2efflux and tree sap flux, it does show that when tree metabolisms slowed down, CO2efflux corre-sponding decreased in the drought responsive efflux cham-bers. Our interpretation is that these drought responsive chambers, which had higher than average respiration rates even during the pre-treatment measurements, were situated above active roots and the onset of drought conditions in-duced tree drought stress which resulted in root respiration decreases. This is substantiated by the strong correlation between the average soil respiration prior to roof closure (pre-treatment) and the drought response index (R2=0.76, P <0.01,n=18). This means that the high flux chambers were situated above already active CO2production sources, very likely active roots, which were susceptible to drought stress.
Furthermore, the drought effect on autotrophic respiration was again detected when examining the relationship between soil CO2 efflux and the distance to tree stems. We found that the drought response index declined with distance from cacao tree stems suggesting that cacao rooting activity near the stem declined during the induced drought, while fur-ther away the effect was not as pronounced. We also found that average soil CO2respiration rates declined with distance from cacao tree stems in both control and roof plots. Soil compaction was excluded as a potential explanatory variable for these decreases, as bulk density cores taken at 0.25 m tance intervals outward from the tree stem to a maximum
dis-tance of 1.75 m, failed to show any systematic increases with distance (n=6 cacao trees). Stem flow and the potentially wetter conditions around the tree base was also excluded as an explanatory variable as we did not find an evident rela-tionship between the average soil moisture and the respective distance to the tree.
Unlike the cacao trees, we did not observe similar tree dis-tance relationships with Gliricidia trees. This is thought to be primarily due to the deeper and more diffuse root architec-ture and rooting behavior exhibited by Gliricidia fine roots (Moser et al., 2010), which may have masked measurable effects with distance. A Deuterium (δD) study by Schwen-denmann et al. (2010) found that tree water uptake was par-titioned vertically in the soil horizon, where cacao accessed water from the upper horizons while Gliricidia explored for water in deeper soil layers.
Additionally, a root excavation exercise done by Moser et al. (2010) at the site, found that coarse roots of both ca-cao and Gliricidia were primarily concentrated around the tree stems while fine root (diameter<2 mm) distributions ex-tended well into the agroforestry plantation. Other stud-ies by Harteveld et al. (2008) and Kummerow et al. (1982) confirm that cacao fine roots extend well beyond the stem and are primarily concentrated in the uppermost 30 cm. Al-though overall autotrophic respiration rates appeared to de-cline, Moser et al. (2010) reported that cacao and Gliricidia fine root biomass remained unchanged at all soil depths to 250 cm, over the duration of the 13-month induced drought. These findings suggest that regardless of the drought stress the trees still continued to maintain and build new fine roots required to search for available water resources.
The litter layer, as was previously mentioned, is sensitive to changes in moisture regimes. Therefore, given that the lit-ter layer would have dried out relatively quickly, the effect on soil respiration would have also been correspondingly fast. By the end of the roof experiment, in April 2008, visibly more leaf litter was found on the plantation floor of the roof plots than the control, although leaf litter fall was unaffected by the induced drought (Schwendenmann et al., 2010). This is an additional indication that decomposition rates decreased under the drier conditions.
Although we have little data to substantiate how below-ground heterotrophic CO2respiration from soil microorgan-isms in the bulk soil reacted to the drought, the results from the leaf litter study clearly show that heterotrophic respira-tion was sensitive to droughts.
4.3 Belowground CO2dynamics
of the sampled soil air CO2 (−23.6‰) confirmed that the CO2produced originated from plants having a C3 photosyn-thetic pathway. Since soil CO2 diffusion typically leads to enrichment of 4.4‰ (Amundson et al., 1998), the resulting
−28‰ clearly falls in theδ13C signature range produced by C3plants (between 22‰ and−34‰) (Trumbore and Druffel, 1995). This excludes that the CO2came from either geologi-cal origins (δ13C signature of carbonate rocks is between 0‰ and +5‰) or from C4plants (δ13C signature between−10‰ and−20‰).
The high CO2concentrations in soils of the cacao agro-forestry ecosystem are thought to be caused by a diffusion block that prevented CO2molecules from traveling upward along the concentration gradient to the atmosphere. Gaseous CO2 diffusion was slowed down by the soil medium’s high bulk density (low porosity), high concentration of coarse rock fragments as well as soil water. Each of these compo-nents would have increased the tortuousness of the gas path-way to the soil surface. During wet conditions CO2 concen-trations were high in the soil air, as the pore-space would have been saturated with water and resulted in slow diffu-sion. However, as soon as the soil dried out, the CO2 concen-trations began to decline, as there were more open air filled pore-spaces available for CO2diffusion. This trend is appar-ent in both the roof plots (where we artificially manipulated the soil moisture) and in the control plots during a natural drought in January–February 2008 (Fig. 6). In and of itself, the soil air CO2concentrations do not say very much about the soil carbon allocation dynamics, but highlight the CO2 storage capacity of the soil.
4.4 Rewetting phase
Soil CO2efflux levels rose almost immediately after the first rain showers began to rewet the soil profile. Within three days, soil CO2 efflux reached control plot levels and re-mained at par with it for the remaining five months. We attribute the quick recovery to the mineralization of dead ac-cumulated labile organic matter that became wet. The unex-pected lack of a pronounced rewetting peak thereafter may be due to: 1) increased hydrophobicity of organic particles which in turn affected decomposition rates (Goebel et al., 2005), and/or 2) the ecosystem’s adaptation to drying and wetting cycles, where a quick response and recovery indi-cates that the ecosystem is well adapted to drying and rewet-ting (Borken and Matzner, 2009). Indications of hydropho-bicity are evident in the post-treatment period (Fig. 1c), where soil moisture failed to return to control plot levels despite frequent precipitation events and sufficient water to rewet the soil (monthly average of 225 mm over five months). The latter explanation can be partially substantiated by the rapid recuperation of sap flux densities in both cacao and Gliricidia trees after roof opening (Schwendenmann et al., 2010).
5 Conclusions
Although there were evidently some drought induced carbon responses, the net emission of soil CO2 over the duration of the 19-month experiment remained unaffected. The 13-month simulated drought caused a slight decrease in soil res-piration because of localized changes in root activity and de-clines in decomposition rates both above and belowground. The moderate soil CO2 efflux decrease experienced during the drought indicates that this agroforestry ecosystem is ca-pable of mitigating drought stress for extended periods.
Acknowledgements. The project was financed by the Deutsche
Forschungsgemeinschaft (DFG) in the framework of the collabora-tive German-Indonesian research project SFB-552, sub-project B6. The authors gratefully acknowledge Purwanto for his assistance with the fieldwork, Luitgard Schwendenmann for her useful advice with data analysis, Kendra Leek for her help polishing the English, and Andreas Schindlbacher and two anonymous reviewers for their constructive reviews and suggestions.
Edited by: G. Wohlfahrt
This Open Access Publication is funded by the University of G¨ottingen.
References
Adachi, M., Bekku, Y. S., Rashidah, W., Okuda, T., and Koizumi, H.: Differences in soil respiration between different tropical ecosystems, Appl. Soil Ecol., 34, 258–265, 2006.
Amundson, R., Stern, L., Baisden, T., and Wang, Y.: The isotopic composition of soil and soil-respired CO2, Geoderma, 82, 83–
114, 1998.
Bailey, N. J., Motavalli, P. P., Udawatta, R. P., and Nelson, K. A.: Soil CO2emissions in agricultural watersheds with agroforestry and grass contour buffer strips, Agroforest. Syst., 77, 143–158, doi:10.1007/s10457-009-9218-x, 2009.
Blake, G. R. and Hartge, K. H.: Bulk density, in: Methods of Soil Analysis. Part 1. Physical and Mineralogical Methods, edited by: Klute, A., Soil Science Society of America, Madison, 2006. Borken, W. and Matzner, E.: Reappraisal of drying and wetting
ef-fects on C and N mineralization and fluxes in soils, Glob. Change Biol., 15, 808–824, doi:10.1111/j.1365-2486.2008.01681.x, 2009.
Davidson, E. A., Verchot, L. V., Cattˆanio, J. H., Ackerman, I. L., and Carvalho, J. E. M.: Effects of soil water content on soil res-piration in forests and cattle pastures of eastern Amazonia, Bio-geochemistry, 48, 53–69, 2000.
Davidson, E. A., Savage, K. E., Trumbore, S. E., and Borken, W.: Vertical partitioning of CO2production within a temperate forest
soil, Glob. Change Biol., 12, 944–956, 2006.
Davidson, E. A., Nepstad, D. C., Yoko Ishida, F., and Brando, P. M.: Effects of an experimental drought and recovery on soil emis-sions of carbon dioxide, methane, nitrous oxide, and nitric oxide in a moist tropical forest, Glob. Change Biol., 14, 2582–2590, 2008.
FAO: Food and Agriculture Organization of the United Nations, on-line available at: http://faostat.fao.org, (last access: November 2009), 2009.
Goebel, M. O., Bachmann, J., Woche, S. K., and Fischer, W. R.: Soil wettability, aggregate stability, and the de-composition of soil organic matter, Geoderma, 128, 80–93, doi:10.1016/j.geoderma.2004.12.016, 2005.
Harteveld, M. A., Hertel, D., and Leuschner, C.: Spatial and tempo-ral variability of fine root abundance and growth in tropical moist forests and agroforestry systems (Sulawesi, Indonesia), Ecotrop-ica, 13, 111–120, 2008.
Hergoualc’h, K., Skiba, U., Harmand, J. M., and Henault, C.: Fluxes of greenhouse gases from Andosols under coffee in monoculture or shaded by Inga densiflora in Costa Rica, Biogeo-chemistry, 89, 329–345, doi:10.1007/s10533-008-9222-7, 2008. Johnson, M. S., Lehmann, J., Riha, S. J., Krusche, A. V., Richey, J. E., Ometto, J. P. H. B., and Couto, E. G.: CO2 efflux
from Amazonian headwater streams represents a significant fate for deep soil respiration, Geophys. Res. Lett., 35, L17401, doi:10.1029/2008GL034619, 2008.
Keil, A., Zeller, M., Wida, A., Sanim, B., and Birner, R.: What determines farmers’ resilience towards ENSO-related drought? An empirical assessment in central Sulawesi, Indonesia, Clim. Change, 86, 291–307, doi:10.1007/s10584-007-9326-4, 2008. K¨ohler, M.: Cacao agroforestry under ambient and reduced
throughfall: Tree water use characteristics and soil water bud-geting, Ph.D., Faculty of Forest Sciences and Forest Ecol-ogy, Georg-August University of G¨ottingen, G¨ottingen, 140 pp., 2010.
Kummerow, J., Kummerow, M., and Souza da Silva, W.: Fine-root growth dynamics in cacao (Theobroma cacao), Plant Soil, 65, 193–201, 1982.
Luo, Y., and Zhou, X.: Soil Respiration and the Environment, Aca-demic Press, Burlington, San Diego, London, 2006.
Moldrup, P., Olesen, T., Schjønning, P., Yamaguchi, T., and Rol-ston, D. E.: Predicting the gas diffusion coefficient in undis-turbed soil from soil water characteristics, Soil Sci. Soc. Am. J., 64, 94–100, 2000.
Moser, G., Leuschner, C., Hertel, D., H¨olscher, D., K¨ohler, M., Leitner, D., Michalzik, B., Prihastanti, E., Tjitrosemito, S., and Schwendenmann, L.: The drought response of cocoa trees
(Theo-broma cocoa) to a 13-month desiccation period in Sulawesi,
In-donesia, Agroforest. Syst., in press, 2010.
Nepstad, D. C., Decarvalho, C. R., Davidson, E. A., Jipp, P. H., Lefebvre, P. A., Negreiros, G. H., Dasilva, E. D., Stone, T. A., Trumbore, S. E., and Vieira, S.: The role of deep roots in the hy-drological and carbon cycles of Amazonian forests and pastures, Nature, 372, 666–669, 1994.
Norman, J. M., Garcia, R., and Verma, S. B.: Soil surface CO2
fluxes and the carbon budget of grasslands, J. Geophys. Res., 97, 18845–18853, 1992.
Oelbermann, M., Voroney, R. P., Thevathasan, N. V., Gordon, A. M., Kass, D. C. L., and Schlonvoigt, A. M.: Soil carbon dy-namics and residue stabilization in a Costa Rican and southern Canadian alley cropping system, Agroforest. Syst., 68, 27–36, doi:10.1007/s10457-005-5963-7, 2006.
Ohashi, M., Kumagai, T., Kume, T., Gyokusen, K., Saitoh, T. M., and Suzuki, M.: Characteristics of soil CO2efflux variability in
an aseasonal tropical rainforest in Borneo Island, Biogeochem-istry, 90, 275–289, 2008.
Parkinson, K. J.: An improved method for measuring soil respira-tion in the field, J. Appl. Ecol., 18, 221–228, 1981.
Quinn, W. H., Zopf, D. O., Short, K. S., and Yang, R.: Histori-cal Trends and Statistics of Southern Oscillation, El Nino, and Indonesian Droughts, Fish. Bull., 76, 663–678, 1978.
R Development Core Team R: A language and environment for sta-tistical computing. R Foundation for Stasta-tistical Computing: Vi-enna, Austria, ISBN 3-900051-07-0, online available at: http: //www.R-project.org, 2008.
Schwendenmann, L., Veldkamp, E., Brenes, T., O’Brien, J. J., and Mackensen, J.: Spatial and temporal variation in soil CO2efflux
in an old-growth neotropical rain forest, La Selva, Costa Rica, Biogeochemistry, 64, 111–128, 2003.
Schwendenmann, L. and Veldkamp, E.: Long-term CO2production
from deeply weathered soils of a tropical rain forest: evidence for a potential feedback to climate warming, Glob. Change Biol., 12, 1–16, 2006.
Schwendenmann, L., Veldkamp, E., Moser, G., H¨olscher, D., K¨ohler, M., Clough, Y., Anas, I., Djajakirana, G., Erasmi, S., Hertel, D., Leitner, D., Leuschner, C., Michalzik, B., Propastin, P., Tjoa, A., Tscharntke, T., and van Straaten, O.: Effects of an experimental drought on the functioning of a cacao agroforestry system, Sulawesi, Indonesia, Glob. Change Biol., doi:10.1111/j.1365-2486.2009.02034.x, in press, 2010. Sheffield, J. and Wood, E. F.: Projected changes in drought
oc-currence under future global warming from model, multi-scenario, IPCC AR4 simulations, Clim. Dynam., 31, 79–105, 2008.
ˇSim˚unek, J., ˇSejna, M., Saito, H., Sakai, M., and van Genuchten, M. T.: The Hydrus-1D Software Package for Simulating the One-Dimensional Movement of Water, Heat, and Multiple Solutes in Variably-Saturated Media. Riverside, California, USA, 2008. Sivakumar, M. V. K., Das, H. P., and Brunini, O.: Impacts of
present and future climate variability and change on agriculture and forestry in the arid and semi-arid tropics, Clim. Change, 70, 31–72, 2005.
Sotta, E. D., Veldkamp, E., Guimaraes, B. R., Paixao, R. K., Ruivo, M. L. P., and Almeida, S. S.: Landscape and climatic controls on spatial and temporal variation in soil CO2efflux in an Eastern
Amazonian Rainforest, Caxiuana, Brazil, Forest Ecol. Manage., 237, 57–64, doi:10.1016/j.foreco.2006.09.027, 2006.
Sotta, E. D., Veldkamp, E., Schwendenmann, L., Rocha Guimar˜aes, B., Keila Paix˜ao, R., de Lourdes P. Ruivo, M., Carlos Lola da Costa, A., and Meir, P.: Effects of an induced drought on the soil CO2production and soil CO2efflux in an Eastern Amazonian
Rainforest, Brazil., Glob. Change Biol., 13, 2218–2229, 2007. Tian, H., Melillo, J. M., Kicklighter, D. W., McGuire, A. D.,
Timmermann, A., Oberhuber, J., Bacher, A., Esch, M., Latif, M., and Roeckner, E.: Increased El Nino frequency in a climate model forced by future greenhouse warming, Nature, 398, 694– 697, 1999.
Trumbore, S. and Druffel, E.: Carbon isotopes for characterizing sources and turnover of nonliving organic matter, in: The Role of Nonliving Organic Matter in the Earth’s Carbon Cycle, edited by: Zepp, R. G. and Sontag, C. K., John Wiley and Sons, Chichster, 342, 1995.
Veldkamp, E. and O’Brien, J. J.: Calibration of a Frequency Do-main Reflectometry Sensor for Humid Tropical Soils of Volcanic Origin, Soil Sci. Soc. Am. J., 64, 1549–1553, 2000.

![(Diethyl ether){1 [2 (1 methyl 1H imidazol 2 yl κN3) 1,1 diphenylethyl] (1,2,3,3a,7a η) indenyl}lithium(I)](data:image/gif;base64,R0lGODlhAQABAIAAAP///wAAACH5BAEAAAAALAAAAAABAAEAAAICRAEAOw==)