in the population sciences published by the Max Planck Institute for Demographic Research Konrad-Zuse Str. 1, D-18057 Rostock·GERMANY www.demographic-research.org
DEMOGRAPHIC RESEARCH
VOLUME 27, ARTICLE 27, PAGES 775-834
PUBLISHED 13 DECEMBER 2012
http://www.demographic-research.org/Volumes/Vol27/27/ DOI: 10.4054/DemRes.2012.27.27
Research Article
Intergenerational transfers in the era of
HIV/AIDS: Evidence from rural Malawi
Iliana V. Kohler
Hans-Peter Kohler
Philip Anglewicz
Jere R. Behrman
c
2012 Kohler, Kohler, Anglewicz & Behrman.
2 Data and descriptive statistics 780
3 Age patterns of intergenerational transfers in rural Malawi 789
3.1 Family structure and health 789
3.2 Age patterns of given and received transfers between respondents and their parents 794
3.3 Age patterns of transfers between respondents and their children 801
4 Correlates of transfer patterns to/with parents 806
5 Correlates of transfer patterns to/with adult children 811
6 Conclusions 815
7 Acknowledgments 819
References 820
Intergenerational transfers in the era of HIV/AIDS:
Evidence from rural Malawi
Iliana V. Kohler1
Hans-Peter Kohler2
Philip Anglewicz3
Jere R. Behrman4
Abstract
BACKGROUNDIntergenerational transfer patterns in sub-Saharan Africa are poorly understood, despite the alleged importance of support networks to ameliorate the complex implications of the HIV/AIDS epidemic for families.
OBJECTIVE
There is a considerable need for research on intergenerational support networks and trans-fers to better understand the mechanisms through which extended families cope with the HIV/AIDS epidemic and potentially alleviate some of its consequences in sub-Saharan Africa, and to comprehend how transfers respond—or not—to perceptions about own and other family members’ health.
METHODS
Using the 2008 round of the Malawi Longitudinal Study of Families and Health (MLSFH), we estimate the age patterns and the multiple directions of financial and non-financial transfer flows in rural Malawi—from prime-aged respondents to their elderly parents and adult children age 15 and up. We also estimate the social, demographic and economic
1Corresponding author; Associate Director, Population Aging Research Center (PARC) and PSC
Re-search Associate, University of Pennsylvania, 3718 Locust Walk, Philadelphia, PA 19104, USA; E-mail: [email protected].
2Frederick J. Warren Professor of Demography, University of Pennsylvania, 3718 Locust Walk, Philadelphia,
PA 19104, USA; E-mail: [email protected].
3Assistant Professor, Tulane University, School of Public Health & Tropical Medicine and
Depart-ment of Global Systems and DevelopDepart-ment, 1440 Canal St., Suite 2200, New Orleans, LA 70112-2737; E-mail: [email protected].
4William R. Kenan Jr. Professor of Economics and Sociology, University of Pennsylvania, 3718 Locust Walk,
correlates of financial and non-financial transfers of financial intergenerational transfers in this context.
RESULTS AND CONCLUSIONS
Our findings are that: (1) intergenerational financial and non-financial transfers are wide-spread and a key characteristic of family relationships in rural Malawi; (2) downward and upward transfers are importantly constrained and determined by the availability of transfer partners (parents or adult children); (3) financial net transfers are strongly age-patterned and the middle generations are net-providers of transfers; (4) non-financial transfers are based on mutual assistance rather than reallocation of resources; and (5) intergenerational transfers are generally not related to health status, including HIV positive status.
1.
Introduction
addi-tion, intergenerational transfer patterns are shaped by the underlying social, economic, cultural, normative and political context in which these transfers occur (Wachter, Knodel, and VanLandingham 2002; Hammel 2005; Billari and Liefbroer 2008; Palloni, Pinto, and Wong 2010; Knodel, Chayovan, and Siriboon 1992; Kohler and Hammel 2001; Bianchi et al. 2008; Velkoff and Kowal 2006; Merli and Palloni 2006; Zagheni 2011).
In the context of the HIV/AIDS epidemic in SSA, a focus on transfer relations and behavior is of particular relevance for several important reasons. By affecting fertility, morbidity, and mortality patterns in the region, the HIV/AIDS epidemic has changed the demographic determinants of transfer behavior, resulting in substantial disruptions in social network structure, intergenerational composition of families and availability of kin. Support provided through kin networks, however, may partially alleviate the conse-quences of the epidemic for those who are directly or indirectly affected by the increased morbidity and mortality resulting from HIV/AIDS. Intergenerational transfers are an im-portant, and perhaps even the most essential component of the existing support networks in SSA. The pattern and extent of these transfers is likely to be shaped by perceptions of own and other family members’ health and mortality pattern.
Despite the potentially heightened relevance of intergenerational relationships in the context of HIV/AIDS, the transfers occurring within families in SSA are currently poorly understood and documented.5 The age patterns and directions of financial and
non-fi-nancial transfers and their relationship to the health status of different generations, have not been described in detail in a SSA context (exceptions include Weinreb 2002; Mtika and Doctor 2002; Mtika 2003). Our knowledge about the flows and distribution of trans-fers between generations is thus very limited.
For example, since its outbreak in the late 1980s the HIV/AIDS epidemic has trans-formed the demographic, health, social and economic environment in SSA.6 The impact of the HIV/AIDS epidemic is not only direct, through mortality, but the levels and specifi-cally the characteristic age pattern of the disease have indirect implications for household structure through fertility, household organization and residential patterns. The high levels
5In contrast, extensive research has documented and analyzed the intergenerational relations in many developed
countries that face rapid population aging; see for instance Lee and Mason (2011) or Silverstein and Giarrusso (2010).
6AIDS is currently the leading cause of adult mortality in many SSA countries (Porter and Zaba 2004; Crampin
of HIV/AIDS morbidity and mortality in SSA have been hypothesized in the literature to have disruptive, profound and immediate impacts on multiple aspects of individuals’ and their extended families’ lives (Merli and Palloni 2006; Bray 2009; Nyasani, Sterberg, and Smith 2009; Knodel, Watkins, and VanLandingham 2003; Hosegood and Timaeus 2006; Mtika 2001; Floyd et al. 2007; Naidu and Harris 2005; Peters, Kambewa, and Walker 2008; Zimmer 2009; Zagheni 2011). HIV/AIDS is also expected to add significantly to the burden of aging in SSA as well as in other developing regions (Wachter, Knodel, and VanLandingham 2002; Ankrah 1994). For instance, while the median age of the Malawi population is still below 17 years, Malawi—similarly to other SSA countries—will age rapidly in the next decades in ways that are significantly different from the aging patterns in other developing countries due to the consequences of the AIDS epidemic (Cohen and Menken 2006; Merli and Palloni 2006; Heuveline 2004; Zaba, Whiteside, and Boerma 2004).
Since a substantial proportion of the elderly in SSA are supported by intra- and inter-generational family networks, AIDS-related morbidity and mortality that peak at primary adult ages affect the ability of families to care for their elderly members, and increases the pressure on existing support networks (Merli and Palloni 2006; Bray 2009; Zagheni 2011). In addition, the HIV/AIDS epidemic increases the importance of older individu-als in sustaining the family through financial and non-financial contributions, or taking on care-giver’s responsibilities for sick adult children and a rising number of orphaned grandchildren. The observed transfer patterns between family members reflect thus both, the short-term needs for and/or abilities to provide transfers, as well as longer-term life-course considerations in which individuals adjust transfer patterns to changes in house-hold structure and life-course patterns of health, consumption and productivity. In the rapidly changing SSA epidemiological and socioeconomic context, however, individuals’ perceptions of own and other family members’ health status, including the probability of being infected with HIV, may often be inaccurate (Delavande and Kohler 2009; An-glewicz and Kohler 2009). Empirical evidence from Malawi, for example, suggests that in the presence of the HIV/AIDS epidemic, prime-aged adults perceive their own mortality risks not only to be high, but higher than might be expected based on measured mortality rates (Delavande and Kohler 2009). Arguably, such pessimistic subjective survival expec-tations may importantly affect intergenerational transfer patterns because they diminish the respondent’s perceptions of future life expectancies, earnings and consumption.7 It is
therefore possible that the response of transfer patterns to the changing health and social conditions as a result of HIV/AIDS epidemic are suboptimal.
In summary, therefore, there is a considerable need for research on intergenerational
7For example, in the context of investments in children’s schooling, Grant (2008) has showed that women’s
support networks and transfers to better understand the mechanisms through which ex-tended families cope with the epidemic and potentially alleviate some of its consequences, and to comprehend how transfers respond—or not—to perceptions about own and other family members’ health. Our analyses make an important contribution to this emerg-ing literature on intergenerational relations in SSA in the context of HIV by drawemerg-ing on innovative and rich new data collection from rural Malawi that includes extensive infor-mation on intergenerational transfer relations across three generations living in a context characterized by high poverty, and high morbidity and mortality. Specifically, we de-scribe the age patterns of transfers and the multiple directions in which financial and non-financial transfers flow—from prime-aged respondents to their elderly parents and vice versa, and also between the respondents and theirco-residentandnon-coresident
adult children above age 15. In addition, we investigate to which extent these transfer flows are related to the health status and other socioeconomic characteristics of the trans-fer providers and transtrans-fer recipients. Moreover, we approximate the extent to which these transfers result in an intergenerational redistribution of resources, as compared to mutual assistance across generations that results in balanced resource flows in both directions. While most of the prior research on transfers has focused on dyads and specifically the ex-changes between an older parent and one randomly selected adult child (Wong, Kitayama, and Soldo 1999), an innovation of our analysis is that we take a multi-generational per-spective by describing intergenerational transfer patterns that involve individuals aged 20–60 years (i.e., the primary respondents in our data), their elderly parents and their adult children aged 15 and above. In addition, a noteworthy aspect of our analyses is that we include both co-resident and non-coresident parents and children.8 This aspect of
our analysis is of particular importance because adult children who co-reside with their parents may have different motivations and obligations for the provision of transfers than their non-coresiding siblings, and the decision to co-reside is likely to depend on parental preferences as well as their health status (Stecklov 1999; Agree et al. 2002).
In light of the current gaps in the literature, several new findings emerge from the analyses in this paper: First, intergenerational financial and non-financial transfers are widespread and a key characteristic of family relationships in rural Malawi. Second, downward and upward transfers are importantly constrained and determined by the avail-ability of transfer partners (parents or adult children): conditional on parents being alive, financial transfers from prime-aged individuals to their parents are widespread and do not follow a strong age pattern, despite the fact that there is a marked decline of parental health among older prime-aged respondents. From a life-cycle perspective for the overall
sam-8Although we acknowledge the importance of lateral familial ties and other supportive networks in the SSA
ple, however, the transfers from respondents to parents are strongly age-patterned with a decline in their frequency with age as the probability of having living parents dimin-ishes with respondent’s age. Our data show that downward transfers to the respondents from their elderly parents are less common than upward transfers, and if they occur, they are concentrated at early adult ages (20-30 years) rather than the later adult ages (30-35 years) when AIDS-related morbidity is more likely to occur.Third, while a large fraction of males and females at ages 40–60 provided to and received transfers from their living adult children—with the provision of transfers to children dominating at early adult ages and the receipt of transfers from children rising at later adult ages—only a relatively small number of children seems to be engaged in these transfers. Fourth, our analyses of net transfer flows between respondents and their parents/children indicate thatnon-financial
assistance is relatively unimportant in terms of resource reallocation between generations, despite the fact that there is extensive—and also in some cases age-patterned—mutual non-financial help across the generations. Net financial transfersto both children and parents are, in contrast, strongly age-patterned and peak in mid-to-late adult ages: both male and female respondents age 40–45 in our data provide substantial upward transfers to their parents (possibly more extensive for female than for male respondents), and at the same time, they make substantial downward transfers to their living adult children (pos-sibly more extensive for male than for female respondents). Fifth, multivariate analyses of transfers between respondents and their elderly parents suggest that, quite surprisingly in light of the existing literature, transfersdo not strongly varyby the respondent’s or the parents’ health status including HIV positive status and perception of HIV risk. These transfers, however, do vary with respondent’s wealth and in some cases education. They differ across regions, and they are positively associated with the transfers (giving and receiving) to and from adult children age 15 and up. Sixth, transfers between respon-dents and their adult children are strongly associated with the adult children’s age and sex composition, and they are positively associated with the transfer patterns between the respondents and their elderly parents. Similar to the transfer patterns between the respon-dents and their elderly parents, financial and non-financial transfers from responrespon-dents to children do not vary significantly by the health status of the respondents or that of their living adult children.
2.
Data and descriptive statistics
communities develop and use in a poor rural setting to cope with the impact of high mor-bidity and mortality in their immediate living environment. The MLSFH is implemented in three sites in rural Malawi: Rumphi (in the northern region), Mchinji (in the central region), and Balaka (in the southern region).9 The project started in 1998 with a sample
of 1,541 women ever having been married aged 15–49 and 1,065 of their spouses. In 2001, respondents were re-interviewed, along with any new spouses since 1998. In 2004, the study added two new components to the data-collection: a new additional sample of approximately 1,500 adolescents, and free HIV testing and a voluntary counseling on the HIV test results for all respondents. The MLSFH returned for a fourth wave of survey data collection and a second round of HIV testing in 2006, and it was followed-up in 2008 and 2010 by two additional rounds of wide-ranging survey data, including the collection of the extensive transfer data used in this analysis.
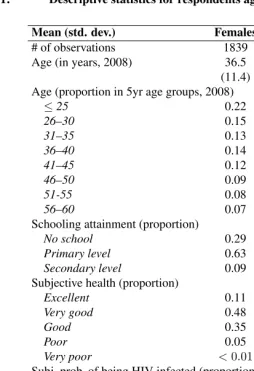
Table 1 summarizes demographic and socioeconomic characteristics for the MLSFH respondents in 2008, the MLSFH round on which the present analysis is based. The sam-ple is comprised of 1,839 female respondents and 1,303 male respondents 20 to 60 years old in 2008.10 The mean age of female respondents is 36.5 years, while male respondents
are on average one year older. Men are on average better educated than women. For instance, only 13% of male respondents have no formal schooling, while twice as many women fall into this category. 21% of men have secondary or higher level of schooling, but only 8.6% of women have completed this level of schooling. The largest fraction of respondents rated their health status as good, very good or excellent, and only 6% of women and 2% of men rated their health status as poor or very poor. In response to questions about their subjective probability of being infected with HIV, the majority of men (55%) and about half of the women (47%) responded that there is some likelihood of being infected. About one third of both sexes rates this likelihood as low, and only 5% of men and 9% of women rated the likelihood of being HIV positive as high.11 Based on HIV test results, 8% of female respondents and 4% of male respondents were HIV positive.12
9Detailed descriptions of the MLSFH sample selection, data collection, and data quality are provided on the
project website http://www.malawi.pop.upenn.edu, in a Special Collection of the online journalDemographic
Researchthat is devoted to the MLSFH (Watkins et al. 2003), and in a recent follow-up publication that incor-porates the 2004 and 2006 MLSFH data (Anglewicz et al. 2009). Comparisons with the Malawi Demographic and Health Survey showed that the MLSFH sample population is reasonably representative of the rural Malawi population (Anglewicz et al. 2009; Bignami-Van Assche, Reniers, and Weinreb 2003; Watkins et al. 2003).
10The larger number of female than male respondents is in part due to the sample design of the MLSFH dating
back to 1998, and the somewhat higher response rates and lower rates of temporary migration for females as compared to males; see Anglewicz et al. (2009) for additional information.
11For more detailed analysis of HIV/AIDS risk perceptions, see Anglewicz and Kohler (2009), Delavande and
Kohler (2009), and Delavande and Kohler (forthcoming).
Table 1: Descriptive statistics for respondents aged 20–60 (in 2008)
Mean (std. dev.) Females Males Total
# of observations 1839 1303 3142
Age (in years, 2008) 36.5 37.6 37.0
(11.4) (12.0) (11.6) Age (proportion in 5yr age groups, 2008)
≤25 0.22 0.21 0.22
26–30 0.15 0.15 0.15
31–35 0.13 0.10 0.12
36–40 0.14 0.13 0.14
41–45 0.12 0.10 0.11
46–50 0.09 0.11 0.10
51-55 0.08 0.09 0.09
56–60 0.07 0.10 0.08
Schooling attainment (proportion)
No school 0.29 0.13 0.22
Primary level 0.63 0.66 0.64
Secondary level 0.09 0.21 0.14
Subjective health (proportion)
Excellent 0.11 0.23 0.16
Very good 0.48 0.50 0.49
Good 0.35 0.24 0.31
Poor 0.05 0.02 0.04
Very poor <0.01 <0.01 <0.01
Subj. prob. of being HIV infected (proportion)
No likelihood 0.45 0.53 0.48
Low 0.33 0.30 0.32
Medium 0.14 0.12 0.13
High 0.09 0.05 0.07
Some subj. likelihood of being HIV 0.55 0.47 0.52 infected (proportion)
HIV+ 0.08 0.04 0.06
A key innovation of the 2008 data collection was the expansion of the family and transfer information. The 2008 household and family roster includes not only all individ-uals who currently live in the household, as frequently done in other studies, but it also asked for information about all parents and children, independent of their survival and resident status, including their demographic, socioeconomic characteristics and transfers received and given from the respondent’s perspective. In addition, approximately 800 parents of MLSFH respondents were interviewed. The present analysis is based on the 2008 MLSFH data since they provide the most comprehensive and detailed information on transfers and intergenerational relations within the MLSFH.13 In total, 3,850 fathers (1,570 of whom were alive), 3,830 mothers (2,150 of whom were alive), and 22,000 chil-dren (16,050 of whom are alive) were listed in the approximately 3,900 household/family rosters that were collected in 2008.
Specifically, for each listed parent or child, MLSFH respondents were asked a set of questions, including: “What is [name’s] relationship to you?”, with our analyses focus-ing on the respondent’s parents and adult children. “Is [name] alive? ”For all living parents/children, respondents were asked:(i)“How old is [name]?”, with children above age 15 considered as “adults” in our analyses; (ii)“Where does [name] usually live?”, where we classify parents or children living in the same household or compound as the respondent asco-resident;(iii)“How would you rate [name’s] health in general?”, with response categories including excellent, very good, good, poor, very poor. Because few respondents used poor or very poor to describe the health of their children or parents, which is similar to the response pattern for the respondents themselves (see Table 1), these categories were further collapsed in our analyses intoexcellent health,good health,
andvery poor, poor or good health; and (iv)“What is the highest level of schooling
[name] has attended?”, from which we establish whether respondents have completed less than primary schooling, primary schooling, secondary schooling or more.
Since the quantitative measurement of transfers in contexts such as Malawi is inher-ently difficult, the MLSFH did not attempt to monetize the financial and non-financial transfers between respondents and their children or parents. Instead, for all living parents and children above age 15, MLSFH respondents were asked a set of questions about fi-nancial and non-fifi-nancial assistance during the last two years, including:(i)“In the past two years, have you given [name] any money or financial assistance?”, with responses ranging from: 0 = no; 1 = yes, a little; 2 = yes, some; and 3 = yes, a lot; (ii) “In the past two years, have you given [name] any non-financial help? This could include help that takes time like collecting firewood, cooking, taking care of people, or helping with farming.”, with responses ranging from 0 = no; 1 = yes, once; 2 = yes, several times a
13The sixth survey wave has been collected in summer 2010, but the data were not available for analyses at the
year; 3 = yes, at least once a month; 4 = yes, at least once a week; and 5 = Yes, daily;(iii)
“In the past two years, has [name] given you any money or financial assistance?”, with responses ranging from: 0 = no; 1 = yes, a little; 2 = yes, some; and 3 = yes, a lot; and
(iv)“In the past two years, has [name] given you any non-financial help? This could include help that takes time like collecting firewood, cooking, taking care of people, or helping with farming.”, with responses ranging from 0 = no; 1 = yes, once; 2 = yes, several times per year; 3 = yes, at least once a month; 4 = yes, at least once per week; and 5 = yes, daily.
For each of the above questions about financial or non-financial transfers among re-spondents and their parents or children 15 years old and older, a further binary variable was created that indicates whether a respondent has given or has received asubstantial amountof transfers, defined as either “2 = yes, some and 3 = yes, a lot” for financial transfers and “3 = yes, at least once a month; 4 = yes, at least once per week; and 5 = yes, daily” for non-financial transfers.
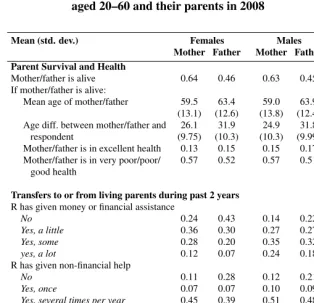
Table 2 presents descriptive statistics for the survival and health of the respondent’s parents, and the transfers that the respondent gave to and/or received from his/her parents during the two years prior to the survey. More than 60% of female and male respondents have living mothers, but only 45% of respondents have living fathers. The mean age of mothers is about 60 years (if alive), while fathers are about 4 years older. Mothers are on average about 25–26 and fathers are about 32 years older than the respondents. About 13–15% of living mothers, and 15–17% of living fathers are assessed by the respondents as being in excellent health, and 57% of mothers and 51–52% of fathers are described as being in very poor, poor or good health. Transfer patterns also vary by sex of the parents. Both male and female respondents are more likely to have given money or help to their mothers than to their fathers during the past two years. For instance, 43% of female respondents and 22% of male respondents stated that they havenotgiven any financial assistance to their fathers, as compared to 24% and 14% respectively to their mothers. 12% of female respondents and twice as many male respondents give a lot of financial support to their mothers, but only 7% of female and 18% of male respondents gave a lot of financial assistance to their fathers.
Table 2: Descriptive statistics for transfer patterns between respondents aged 20–60 and their parents in 2008
Mean (std. dev.) Females Males Total Mother Father Mother Father Mother Father Parent Survival and Health
Mother/father is alive 0.64 0.46 0.63 0.45 0.63 0.45
If mother/father is alive:
Mean age of mother/father 59.5 63.4 59.0 63.9 59.3 63.6
(13.1) (12.6) (13.8) (12.4) (13.4) (12.5)
Age diff. between mother/father and 26.1 31.9 24.9 31.8 25.6 31.8
respondent (9.75) (10.3) (10.3) (9.99) (9.99) (10.1)
Mother/father is in excellent health 0.13 0.15 0.15 0.17 0.14 0.16
Mother/father is in very poor/poor/ 0.57 0.52 0.57 0.51 0.57 0.52
good health
Transfers to or from living parents during past 2 years
R has given money or financial assistance
No 0.24 0.43 0.14 0.22 0.20 0.34
Yes, a little 0.36 0.30 0.27 0.27 0.32 0.29
Yes, some 0.28 0.20 0.35 0.32 0.31 0.25
yes, a lot 0.12 0.07 0.24 0.18 0.17 0.12
R has given non-financial help
No 0.11 0.28 0.12 0.21 0.12 0.25
Yes, once 0.07 0.07 0.10 0.09 0.08 0.08
Yes, several times per year 0.45 0.39 0.51 0.48 0.48 0.43
Yes, at least once per month 0.13 0.12 0.10 0.10 0.11 0.11
Yes, at least once per week 0.14 0.08 0.11 0.09 0.13 0.08
Yes, daily 0.10 0.06 0.07 0.04 0.08 0.05
R has received money or financial assistance
No 0.51 0.51 0.56 0.50 0.53 0.51
Yes, a little 0.27 0.22 0.25 0.19 0.26 0.21
Yes, some 0.16 0.17 0.11 0.15 0.14 0.16
Table 2: (Continued)
Mean (std. dev.) Females Males Total Mother Father Mother Father Mother Father
R has received non-financial help
No 0.34 0.56 0.29 0.46 0.32 0.52
Yes, once 0.09 0.09 0.08 0.08 0.09 0.08
Yes, several times per year 0.36 0.25 0.37 0.30 0.36 0.27
Yes, at least once per month 0.11 0.06 0.08 0.07 0.10 0.06
Yes, at least once per week 0.06 0.03 0.08 0.06 0.07 0.04
Yes, daily 0.05 0.02 0.10 0.04 0.07 0.02
Summary measures of transfers to or from living parents during past 2 years
R hasgivensubstantial amount of 0.40 0.27 0.59 0.50 0.48 0.37
financialassistance
R has given substantial amount of 0.36 0.25 0.27 0.22 0.32 0.24
non-financialhelp
R has received substantial amount of 0.23 0.27 0.20 0.31 0.21 0.29
financial assistance
R has received substantial amount of 0.21 0.11 0.26 0.16 0.23 0.13
non-financial help
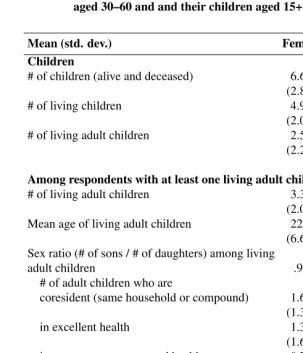
Descriptive statistics for transfers between respondents 30–60 years old and their chil-dren are shown in Table 3.14 Female respondents in our sample have on average 6.7
children ever born, and male respondents have 7.1 ever-born children. The number of living children is lower, about 4.9 children for women and 5.6 children for men. Female and male respondents have on average around 2.5 living adult children above age 15. The number of adult children among respondents with at least one alive child 15 or more years old is higher, and these respondents have on average more than 3 adult children with a mean age of about 22 years. Both men and women have more living adult daughters than sons. Not surprisingly, many adult children do not reside in the same household or com-pound as the respondent (=parent), and the mean number of co-residing adult children is slightly higher for female respondents than for males (1.64 and 1.47 respectively). Less than one half of the respondent’s living adult children were reported to be in excellent health status, and about one fifth of adult children were reported to be in very poor, poor or good health.
14Because we are interested in reciprocal transfers among parents and adult children and very few respondents
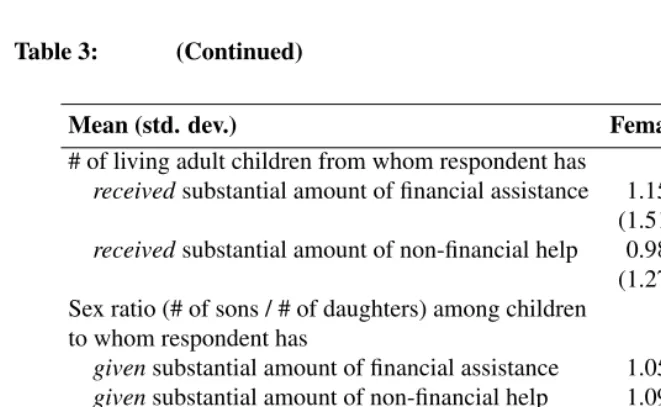
Table 3 also reveals that received and given financial and non-financial transfers dur-ing the last two years were concentrated between respondents and mostly one child on average. For instance, substantial financial help was given on average only to slightly more than one child (1.16 children for female and 1.48 children for male respondents). Female respondents provided non-financial help to about the same number of children, whereas male respondents provided non-financial help to fewer children than the num-ber of children to whom they provided financial assistance. However, the basic pattern for received financial and non-financial help from children to respondents is very similar: during the past two years, both types of transfers were primarily given by the respondent to a small number of children (often only one). Similarly, respondents received substantial amounts of financial or non-financial assistance from just one child during the past two years. Separating the transfer patterns by gender of the respondent’s children furthermore reveals that both male and female respondents provide more financial transfers to their sons than to their daughters. Specifically, the sex ratio of number of sons to number of daughters among adult children with whom the respondent has exchanged transfers shows that parents give substantial amounts of financial help to 5–10% more sons than daughters, which is striking, given the fact that they report to have 4–10% fewer sons than daughters. Respondents also tend to give non-financial help more to sons than daughters, and this is particularly the case for male respondents. Male respondents also tend to receive finan-cial assistance more from sons than daughters, whereas non-finanfinan-cial help—espefinan-cially for females—is more often provided by daughters.
Table 3: Descriptive statistics for transfer patterns between respondents aged 30–60 and and their children aged 15+ in 2008
Mean (std. dev.) Female Male Total
Children
# of children (alive and deceased) 6.66 7.14 6.86
(2.81) (3.38) (3.07)
# of living children 4.91 5.59 5.19
(2.09) (2.63) (2.35)
# of living adult children 2.58 2.33 2.48
(2.27) (2.54) (2.39)
Among respondents with at least one living adult child
# of living adult children 3.35 3.66 3.46
(2.02) (2.30) (2.13)
Mean age of living adult children 22.7 22.3 22.6
(6.62) (7.02) (6.77) Sex ratio (# of sons / # of daughters) among living
adult children .92 .95 .93
# of adult children who are
coresident (same household or compound) 1.64 1.47 1.58
(1.36) (1.46) (1.40)
in excellent health 1.31 1.46 1.37
(1.66) (1.93) (1.76)
in very poor, poor or good health 0.73 0.84 0.77
(1.33) (1.56) (1.42)
Transfers to/from children during past two years
(Among respondents with at least one living adult child) # of living adult children to whom respondent has
givensubstantial amount of financial assistance 1.16 1.48 1.28
(1.34) (1.54) (1.42)
givensubstantial amount of non-financial help 1.08 0.70 0.94
Table 3: (Continued)
Mean (std. dev.) Female Male Total
# of living adult children from whom respondent has
receivedsubstantial amount of financial assistance 1.15 0.81 1.03
(1.51) (1.32) (1.45)
receivedsubstantial amount of non-financial help 0.98 0.81 0.92
(1.27) (1.25) (1.26) Sex ratio (# of sons / # of daughters) among children
to whom respondent has
givensubstantial amount of financial assistance 1.05 1.09 1.07
givensubstantial amount of non-financial help 1.09 1.36 1.15
Sex ratio (# of sons / # of daughters) among children from whom respondent has
receivedsubstantial amount of financial assistance .95 1.41 1.06
receivedsubstantial amount of non-financial help .72 .93 .78
3.
Age patterns of intergenerational transfers in rural Malawi
3.1 Family structure and healthTo provide the demographic context in which intergenerational transfers occur, we begin our analysis with a description of the family composition in rural Malawi. Specifically, we focus on the number of children and living parents respondents have and how these numbers change with respondent’s age. The left panel of Figure 1 shows the mean number of children ever born, children living, children below age 15 and adult children above age 15 by age of female respondents, and the right panel shows the same information for male respondents. The observed means of number of children in 5-years age intervals are shown by the dots, and the lines are estimated by using a local polynomial regression fitting procedure from the individual-level data.15 With very few exceptions, we find
similar patterns for male and female respondents. At age 20, female respondents have on average less than 2 children, but the number of children increases with age, and at age 60 female respondents report on average more than 8 children ever born. The difference between children ever born and surviving children increases sharply with age. At age 50, for example, female respondents have on average 7.8 children ever born, of whom
approximately 70% were alive at the time of the interview. The mean number of living children below age 15 is highest around age 30 (about 3 children) and declines with age, while the number of older children 15 and up years increases with age. At age 20 almost none of the male respondents have children, but by age 60 they have on average about 9.5 children ever born. The higher number of children for men is likely due to the fact that about 7% of men in the sample are in polygamous unions, and unmarried men are underrepresented in the MLSFH sample at older ages.16 By age 50 the difference between
children ever-born and children alive is about 2. The mean number of alive young children (aged < 15) is highest at age 35–40 for men, which is about 5 years later than for women.17
Figure 1: Children of respondents, by respondent’s age and gender: Number of children ever born, living children, living young children (age < 15), living adult children (age≥15), and living children of unknown age
(a) Female Respondents (b) Male Respondents
20 30 40 50 60
0
2
4
6
8
10
Age
Number of children
● ●
● ●
● ●
● ●
● ●
● ●
● ●
● ●
● ●
●
●
●
●
● ●
● ●
● ●
● ●
● ●
● ● ● ● ● ● ● ●
# of children # of alive children # of alive young child.
# of alive adult children # alive child., age unknown
20 30 40 50 60
0
2
4
6
8
10
Age
Number of children
● ●
● ●
● ●
● ●
● ●
● ●
● ●
●
●
● ●
● ●
●
●
●
●
● ●
● ●
● ●
● ●
● ● ● ● ● ● ● ●
# of children # of alive children # of alive young child.
# of alive adult children # alive child., age unknown
16Because of the MLSFH sampling design, dating in part back to 1998, men above age 30 in the sample where
ever married to a female MLSFH respondent; in 2004, the MLSFH recruited an adolescent and young adult sample that was not conditional on marital status also included unmarried men.
17As an indicator for the data quality of the listing of children in the household/family roster, we also show
Figure 2 shows the proportion of female and male respondents with living parents, by age of the respondent. The pattern is strikingly similar for both male and female respon-dents. About 83–94% of men and women in the age range 20–30 years report having at least one parent alive. 72–91% of respondents below age 30 have alive mothers, while the proportion of those with an alive father in this young age range is lower (56–74%), which reflects higher male mortality and that husbands tend to be older than their wives. The probability of having living parents declines with age, and at age 60 only about 26–29% of respondents report having at least one parent alive, but a much smaller fraction (about 2–6%) of elderly respondents have both parents alive. In addition, to allow for the assess-ment of data quality, both panels present information on surviving biological parents that was elicited outside the family/household roster in a separate part of the questionnaire. The two dashed gray lines referring to biological parents and mother or father in general are almost identical with the survival lines for mothers or fathers obtained from the house-hold/family roster, which suggests that respondents primarily list their biological parents when asked about “parents” in the household roster and that they provide information about parents consistent across different parts of the questionnaire and question formats. More importantly, this implies also that the transfer behavior from the respondent’s per-spective described later in the paper occurs in most instances among biological children and parents. In addition, calculations from our data show that around 3/4 of female re-spondents around age 30 do not co-reside with their mother, and this probability declines with the respondent’s age as a result of the lower probability of having an alive mother. Conditional on the mother being alive, the probability of female respondents aged 30 and up residing with the mother is relatively constant around 35%.18 Coresidence with fathers
is less common, which is to a substantial extent related to the lower probability of fathers being alive, but is also the case for respondents whose father is alive. For example, around age 30, only 10% of female respondents coreside with their fathers in the same household or compound, and this probability declines with age; conditional on the father being alive, around 17–19% of female respondents aged 30–40 coreside with their fathers.
18There are marked regional differences in the probability of co-residing with the mother or father due to
Figure 2: Survival of respondent’s parents, by respondent age and gender: Probability of mother being alive, father being alive, both parents being alive, at least one parent being alive, biological mother being alive, and biological father being alive
(a) Female Respondents (b) Male Respondents
20 30 40 50 60
0.0
0.2
0.4
0.6
0.8
1.0
Age
Probability of mother/f
ather being aliv
e
●
●
● ●
●
●
● ● ●
●
● ●
●
●
● ●
●
● Mother alive
Father alive Both parents alive
at least one parent alive Biolog. mother alive Biolog. father alive
20 30 40 50 60
0.0
0.2
0.4
0.6
0.8
1.0
Age
Probability of mother/f
ather being aliv
e
●
●
● ● ●
●
●
● ●
●
● ● ●
●
●
●
●
● Mother alive
Father alive Both parents alive
at least one parent alive Biolog. mother alive Biolog. father alive
ages 30–40, and decreases substantially with age because of high parental mortality in rural Malawi.
Figure 3: Parental health, by respondent’s age and gender: Probability that mother or father is in (1) excellent health or in (2) very poor/ poor/good health, conditional on mother or father being alive and in the overall sample
(a) Female respondents: Mother health (b) Female respondents: Father health
20 30 40 50 60
0.0
0.2
0.4
0.6
0.8
Age
Probability
●
● ●
●
● ●
● ● ●
●
● ●
● ●
● ●
● ●
Moth in excelent health Moth in (very) poor/good health
Moth in excelent health | alive Moth in (very) poor/good health | alive
20 30 40 50 60
0.0
0.2
0.4
0.6
0.8
Age
Probability
● ●
●
● ●
● ● ●
●
● ●
●
● ●
● ●
● ●
Fath in excelent health Fath in (very) poor/good health
Fath in excelent health | alive Fath in (very) poor/good health | alive
(c) Male respondents: Mother health (d) Male respondents: Father health
20 30 40 50 60
0.0
0.2
0.4
0.6
0.8
Age
Probability
●
●
●
● ●
● ●
● ●
● ●
● ●
●
●
●
● ●
Moth in excelent health Moth in (very) poor/good health
Moth in excelent health | alive Moth in (very) poor/good health | alive
20 30 40 50 60
0.0
0.2
0.4
0.6
0.8
Age
Probability
● ●
●
●
● ● ● ●
●
● ●
● ●
●
●
●
● ●
Fath in excelent health Fath in (very) poor/good health
Fath in excelent health | alive Fath in (very) poor/good health | alive
20 30 40 50 60
0.0
0.2
0.4
0.6
0.8
Age
Probability
●
●
●
●
● ● ● ●
●
● ●
●
●
●
●
●
● ●
Mother/Father in excelent health Mother/Father in very poor/poor/good health
3.2 Age patterns of given and received transfers between respondents and their parents
We begin our analyses of intergenerational transfers by investigating the age profile of transfer flows between respondents and their parents. In particular, we draw on the re-sponses to the household/family roster questions on financial and non-financial transfers (see above) that list a parent as a recipient or provider of transfers. Since we are primarily interested in regular—rather than occasional—transfers among respondents and parents, we focus on the indicator of whether the respondent has given or receiveda substantial
amountof financial or non-financial transfers in the two years prior to the survey. Because
the survival of parents is an important determinant of whether the respondent can receive from, or give transfers to his or her mother or father, we show in the subsequent figures
(i)the transfer patterns conditional on the respondent’s mother or father being alive (in the text, we refer to this type of transfers as ’conditional transfers’), and(ii)the transfer patterns for the entire sample, unconditional on parental survival (in the text, we refer to this type of transfers as ’unconditional transfers’). The latter is useful to assess the contribution of parental survival to transfers with parents at different stages of a respon-dent’s life-course. For example, the fact that a respondent did not receive transfers from his or her mother can be due to the fact the respondent’s mother is deceased, or that the respondent did not receive transfers from the mother despite the fact that the mother is alive.
The comparison between the conditional and unconditional transfers is important since it reflects the contribution of parental survival to the observed transfer patterns.
Figure 4: Financial and non-financial transferstomother and father, by respondent’s age and gender: Probability that respondent has given “substantial amount” of financial/non-financial transfers to mother or father, conditional on mother/father being alive (broken lines) and in the overall sample (full lines)
(a) Female resp: Transfers to mother (b) Female resp: Transfers to father
20 30 40 50 60
0.0
0.1
0.2
0.3
0.4
0.5
0.6
0.7
Age
Probability of pro
viding tr
ansf
ers
● ●
● ●
● ●
● ●
●
● ●
●
●
●
● ●
●
●
Financial transfers to mother (total sample) Financial transfers to mother | moth alive) Non−financial transfers to mother (total sample) Non−financial transfers to mother | mother alive)
20 30 40 50 60
0.0
0.1
0.2
0.3
0.4
0.5
0.6
0.7
Age
Probability of pro
viding tr
ansf
ers
● ●
● ●
●
●
● ● ●
●
●
● ●
● ● ●
●
●
Financial transfers to father (total sample) Financial transfers to father | moth alive) Non−financial transfers to father (total sample) Non−financial transfers to father | father alive)
(c) Male resp: Transfers to mother (d) Male resp: Transfers to father
20 30 40 50 60
0.0
0.1
0.2
0.3
0.4
0.5
0.6
0.7
Age
Probability of pro
viding tr
ansf
ers
● ●
● ●
●
● ●
● ●
●
● ●
●
● ●
●
●
●
Financial transfers to mother (total sample) Financial transfers to mother | moth alive) Non−financial transfers to mother (total sample) Non−financial transfers to mother | mother alive)
20 30 40 50 60
0.0
0.1
0.2
0.3
0.4
0.5
0.6
0.7
Age
Probability of pro
viding tr
ansf
ers
● ●
●
● ●
●
●
● ●
●
● ●
● ●
●
●
●
●
Financial transfers to father (total sample) Financial transfers to father | moth alive) Non−financial transfers to father (total sample) Non−financial transfers to father | father alive)
20 30 40 50 60
0.0
0.1
0.2
0.3
0.4
0.5
0.6
0.7
Age ●
●
●
●
●
●
●
● ●
●
● ●
●
●
●
●
●
●
Conditional on the mother being alive, male respondents were fairly likely (at most ages, between 50–70%) of having given financial help to their mothers (Figure 4c). Un-conditional on parental survival, the fraction of respondents who do so declines strongly with age, especially after age 35, due to reduced probability of having a living mother. Male respondents are less likely to have given non-financial help than financial assistance to their mothers, and they are less likely to have done so as compared to female respon-dents. Male respondents’ transfers to their fathers (Figure 4d) are also characterized by relatively high probabilities of having made financial transfers, conditional on the father being alive, and a declining proportion of male respondents at older ages who have given financial help to fathers due to the reduced paternal survival probabilities. Male respon-dents are also less likely to have given non-financial help to their fathers as compared to financial help.
An important dimension of Figure 4 is the large discrepancy between conditional and unconditional transfers to parents. In particular, the unconditional probabilities for trans-fers of both types to parents are substantially lower than the ones observed conditional on having alive parents. Due to the lower probabilities of having living parents for older re-spondents, the fraction of respondents giving any type of help to elderly parents decreases with age, especially after age 40. For instance, about 27–29% of female respondents aged 30–40 gave substantial amounts of financial assistance to their mothers, a probability that declines to less than 10% at age 60.
Because respondents, particularly at older ages, are less likely to have a surviving father as compared to a surviving mother, only 11–15% of female respondents aged 30– 40 gave substantial amounts of financial assistance to their fathers, and at age 60, less than 5% of female respondents did so. These broad age-patterns of financial transfers to parents for male respondents are similar to those for female respondents, although the level—both conditional on parents being alive and unconditional—tend to have been higher for male respondents than for female respondents. Also, at almost all ages and both conditional on parental survival and not, male respondents provided less non-financial help to their parents than female respondents.
respon-dent’s age range, the probability of having received financial assistance from mother or father declines with age even among respondents whose mother or father is still alive. This is also true for non-financial help from parents to female respondents, whereas the conditional transfer pattern to parents for male respondents is less regular (potentially due to the small number of observations). In summary, therefore, financial and non-financial transfers from parents to respondents occurred primarily at relatively young adult ages, and they became less common for older respondents. Respondents older than 40 years received only very limited financial/non-financial support from their parents, which is a function of both survival probabilities of parents and transfer behaviors conditional on parents being alive.
In Figure 6 we estimate the age pattern ofnet transfersto the respondent’s parents. Under the assumption that the categorical description “a substantial amount of financial assistance” reflects an approximately equal amount of transfers when a respondent de-scribes the transfers given to and received from one particular parent,19 we can use it to approximate the net transfers between the respondent and a particular parent. For this purpose, we construct a variablenet transfer to mother(orfather) as follows: it equals one (1) if the respondent has given a substantial amount of financial assistance to his or her mother (father) and received from her (him) little or no financial assistance in the last two years; it equals zero (0) if the respondent has given a substantial amount of finan-cial assistance to his or her mother (father) and has also received a substantial amount of financial assistance from his or her mother (father), and it equals also zero (0) if the respondent has given no or only little financial assistance to his or her mother (father) and has also received little financial transfer from his or her mother (father); and it equals minus one (-1) if the respondent has given no or only a little financial assistance to his or her mother (father), but has received a substantial amount of financial assistance from his or her mother (father). Moreover, to reflect the net resource flows unconditional on the respondent’s parents survival, we assign the net transfer variable a value of zero (0) if the respondent’s mother or father has deceased. An analogous calculation to approx-imate thenet transfersto a respondent’s mother or father is performed for non-financial transfers, using the binary indicator that the respondents has given to, or received from a parent a substantial amount non-financial help (i.e, help with a frequency of “at least once a month/at least once per week”). It is easiest to interpret the resulting measure of net transfers in terms of a net resource flow that is measured in units ofsubstantial amounts
of non-financial transfers.
19As long as the transferstoandfroma particular parent are comparable, it is not problematic for this calculation
Figure 5: Financial and non-financial transfersfrommother or father, by respondent’s age and gender: Probability that respondent has received “substantial amount” of financial/non-financial transfers from mother or father, conditional on mother/father being alive (broken lines) and in the overall sample (full lines)
(a) Female resp: Transfers from mother (b) Female resp: Transfers from father
20 30 40 50 60
0.0
0.1
0.2
0.3
0.4
0.5
Age
Probability of receiving tr
ansf
ers
●
● ●
●
● ●
●
● ●
● ●
●
● ●
●
●
●
●
Financial transfers from mother (total sample) Financial transfers to mother | mother alive) Non−financial transfers from mother (total sample) Non−financial transfers from mother | mother alive)
20 30 40 50 60
0.0
0.1
0.2
0.3
0.4
0.5
Age
Probability of receiving tr
ansf
ers
●
●
●
● ● ●
● ● ●
●
●
● ● ● ● ●
●
●
Financial transfers from father (total sample) Financial transfers from father | father alive) Non−financial transfers from father (total sample) Non−financial transfers from father | father alive)
(c) Male resp: Transfers from mother (d) Male resp: Transfers from father
20 30 40 50 60
0.0
0.1
0.2
0.3
0.4
0.5
Age
Probability of receiving tr
ansf
ers
●
●
●
● ●
● ●
● ●
● ●
● ●
●
●
●
●
●
Financial transfers from mother (total sample) Financial transfers from mother | mother alive) Non−financial transfers from mother (total sample) Non−financial transfers from mother | mother alive)
20 30 40 50 60
0.0
0.1
0.2
0.3
0.4
0.5
Age
Probability of receiving tr
ansf
ers
●
●
●
● ●
●
● ●
●
●
●
● ●
●
●
●
●
●
Financial transfers from father (total sample) Financial transfers from father | father alive) Non−financial transfers from father (total sample) Non−financial transfers from father | father alive)
20 30 40 50 60
0.0
0.1
0.2
0.3
0.4
0.5
0.6
0.7
Age
Probability of receiving tr
ansf
ers
●
●
●
●
●
●
● ●
●
●
● ●
●
●
●
●
●
●
Figure 6: Net financial and non-financial transferstomother or father, by respondent’s age and gender, conditional on mother/father being alive (broken lines) and in the overall sample (full lines)
(a) Female resp: Net-transfers to mother (b) Female resp: Net-transfers to father
20 30 40 50 60
−0.1
0.0
0.1
0.2
0.3
0.4
Age
Net tr
ansf
ers (in units of "lots of tr
ansf
ers")
● ●
● ●
● ●
● ●
● Financial net transfers to mother (total sample)
Non−financial net transfers to mother (total sample)
20 30 40 50 60
−0.1
0.0
0.1
0.2
0.3
0.4
Age
Net tr
ansf
ers (in units of "lots of tr
ansf
ers")
● ●
● ●
●
●
● ●
● Financial net transfers to father (total sample)
Non−financial net transfers to father (total sample)
(c) Male resp: Net-transfers to mother (d) Male resp: Net-transfers to father
20 30 40 50 60
−0.1
0.0
0.1
0.2
0.3
0.4
Age
Net tr
ansf
ers (in units of "lots of tr
ansf
ers")
● ●
● ●
●
● ●
●
● Financial net transfers to mother (total sample)
Non−financial net transfers from mother (total sample)
20 30 40 50 60
−0.1
0.0
0.1
0.2
0.3
0.4
Age
Net tr
ansf
ers (in units of "lots of tr
ansf
ers")
● ●
●
● ●
● ●
●
● Financial net transfers to father (total sample)
Non−financial net transfers to father (total sample)
20 30 40 50 60
−0.1
0.0
0.1
0.2
0.3
0.4
Age
Net tr
ansf
ers (in units of "lots of tr
ansf
ers")
●
●
●
●
●
●
●
●
● Net financial transfers to mother/father (total sample) Net non−financial transfers to mother/father (total sample)
Figure 6 then plots the average net transfers (financial and non-financial) by respon-dent’s age. Several aspects of these net transfers to mothers or fathers are worth noting. First, as shown in the previous figures, while there are clear age patterns for the gross non-financial transfers (non-financial transfers help given or non-financial transfers help received) for females and to a slightly lesser extent for males, the average non-financial
nettransfers are relatively low and without any strong age pattern. For example, for fe-male respondents between ages 20–40, there is a net resource flow of .09–.12 of such units from the respondents to her mother and of .06–.10 such unites to her father. At older ages this net resource flow further diminishes, in part because the frequency of trans-fers declines (see Figures 4–5) and because parents are less likely to be alive. For male respondents, the net non-financial resource flow across all ages are very small.
For financial transfers, the net resource flow in Figure 6 follows a marked age pat-tern and is not as balanced as for non-financial help. Between female respondents and their mothers, the net financial flow are fairly balanced around age 20, and then rises to a net upward flow—of an average of .16 units of “a substantial amount” of financial assistance—when respondents are in their mid to late 30s. After age 30, the net financial resource flow remains towards the parents, with some marked decline that is only the re-sult of a declining probability of the respondent’s mother being alive (Figures 4–5). The net financial transfers between female respondents and their fathers are negative when re-spondents are in their 20s, indicating an average net resource flow of about .05–.1 units of “a substantial amount” of financial assistance from the father to the respondent; after age 30, the average net resource flow between female respondents and their fathers is very close to zero. This decline of the net resource flow with age is initially the result of a declining probability of fathers making financial transfers to their daughters, and at older ages the result of a declining probability of respondents having a living father (see Figure 5b).
flow is towards the father for respondents age 25 and higher, and peaks also in the mid to late 30s at about .18 units of “a substantial amount” of financial assistance; this increase is primarily driven by a declining probability of receiving downward transfers from the father, while male respondents maintain a fairly constant probability of making upward financial transfers conditional on the father being alive (see Figure 4d). The decline of the net transfer towards zero above age 40 is again importantly driven by the declining probability of a respondent having a living father.
In summary, while recognizing the limitations of this approach due to the lack a de-tailed quantitative measurement of transfers, our analyses in Figure 6 suggest that net non-financial transfers are relatively insignificant across all ages for both male and female respondents. At the respondent’s early adult ages, when parents are likely to be alive, there is a fair extent of mutual assistance between respondents and their parents (see Figures 4–5), but in terms of net flows the help given and received are approximately balanced and results in a relatively insignificant re-allocation of resources between generations. In con-trast, the net resource flows are both significant and strongly age patterned—following an inverted U-shape—for financial assistance. In particular, male respondents provide significant net upward transfers to their parents (mother and father) in their primary adult ages (30–50 years of age). The increase in the net upward resource flow between male respondents and their parents at young ages is primarily the result of a declining proba-bility of receiving financial assistance from parents, while the decline in the net upward flow after age 40 is primarily the result of declining parental survival (Figures 4–5). The transfers between female respondents and their mothers follow a similar pattern, albeit with a smaller net resource reallocation, while the transfers between female respondents and their fathers are the only ones that are characterized by a net downward transfers to the respondent from their fathers at ages 20–30 that is not followed by a significant net upward transfer at older ages.
3.3 Age patterns of transfers between respondents and their children
re-spondents, but the transfer patterns between male respondents and their children are very similar and we summarize them later in this section.
The upper left panel of Figure 7 shows the flow of transfers between respondents and their adult children conditional on a respondent having at least one child 15 and over years old. When in their early 30s, about 50% of female respondents who have at least one living adult child provide substantial amount of financial help to at least one adult child. This fraction increases to more than 60% among respondents age 50, and declines sharply afterward to 40% for respondents around age 60. Non-financial help from respondents to children follows a very similar inverted U-shaped age pattern, and this inverted U-shape of giving financial/non-financial help differs markedly from the age-pattern of receiving financial help.
In particular, while very few respondents receive financial help from their adult chil-dren at younger ages, even in the presence of an alive adult child, around 80% of women who have living adult children receive financial transfers from at least one adult child af-ter age 50. In contrast, the fraction of respondents with living adult children who receive non-financial support from at least one adult child is substantially lower. For example, at age 50 and above, on average only 50–57% of female respondents who have living adult children receive substantial non-financial help from at least one of their adult children.
Figure 7: Transfers to and fromliving adultchildren (LAC) (female respondents)
(a) Conditional on having at least one LAC: (b) Total sample: Prob of having at least one Prob of giving to/receiving from LAC and prob of giving to/receiving from
at least one adult living child: at least one adult living child:
30 35 40 45 50 55 60
0.0
0.2
0.4
0.6
0.8
1.0
Age
Probability of giv
en/receiv
ed substantial tr
ansf
ers
● ●
● ●
●
●
●
● Given substantial financial assist.
Given substantial non−financial help
Received substantial financial assist. Received substantial non−financial help
30 35 40 45 50 55 60
0.0
0.2
0.4
0.6
0.8
1.0
Age
Probability of giv
en/receiv
ed substantial tr
ansf
ers
● ●
● ●
●
●
●
● Given substantial financial assist.
Given substantial non−financial help Adult living child (ALC)
Received substantial financial assist. Received substantial non−financial help
(c) Conditional on having at least one LAC: (d) Total sample: Number of LAC Number of LAC and number of LAC to and number of LAC to whom
whom the respondent has given transfers the respondent has given transfers to, to, or has received transfers from or has received transfers from
30 35 40 45 50 55 60
0
1
2
3
4
5
Age
# of children
● ●
● ●
●
●
●
● Given substantial financial assist.
Given substantial non−financial help Adult living child/children (ALC)
Received substantial financial assist. Received substantial non−financial help
30 35 40 45 50 55 60
0
1
2
3
4
5
Age
# of children
● ●
● ●
●
● ●
● Given substantial financial assist.
Given substantial non−financial help Adult living child/children (ALC)
Received substantial financial assist. Received substantial non−financial help
30
35
40
45
50
55
60
0
1
2
3
4
5
Age
# of children
● ●
●
●
●
●
●
● Given substantial financial assist.
Given substantial non−financial help Adult living child/children (ALC)
The bottom two panels of Figure 7 show the transfer patterns depending on the number of children respondents have. Conditional on having at least one child 15 and over years old, female respondents have on average close to five alive adult children by age 55– 60 (lower left panel). The most striking feature revealed in this graph is that although respondents have high numbers of adult children at age 45–50, which is the peak age when transfers to children occur, financial help is given to only a small number of these adult children, on average to only 1.4–1.5 children. By age 55, when the peak for received financial help from children occurs, respondents received on average transfers from 2.2 adult children. Hence, there is a sizable gap between a respondent’s number of living adult children, and the number of children to whom a respondent has given, or from whom he/she has received financial transfers during the past two years. This asymmetry between the number of potential transfer partners (number of living adult children) and the number of actual transfer partners also occurs for non-financial transfers, where respondents aged 40–55 gave help to, or received help from about .9–1.3 children on average.
The bottom right panel shows the above transfer patterns unconditional on having at least one alive adult child. The primary difference between this graph and the bottom left panel occurs below age 40, when very few respondents have children age 15 and above and thus almost no transfers are observed.
With few exceptions, the patterns of intergenerational transfers between male respon-dents and their adult children are very similar to the ones for female responrespon-dents. For male respondents we estimate a slightly older age pattern for providing financial help to adult children, the peak of which occurs around respondent’s age 55. The peak of received transfers from adult children occurs also at older age, and by age 55-60 male respondents receive help on average from one child which is in contrast to the estimates for female respondents who on average received help from a larger number of children.
transfers even around age 30; see Figure 7a). At somewhat older ages, for both male and female respondents, a net financial transfer towards children arises. For female respon-dents, the net financial transfers to children peak at an age around 40 years, and decline thereafter; after age 50, the direction of net transfers changes and female respondents be-come net recipients of transfers from their children. This net resource flow from children to their mothers (female respondents) is relatively substantial, allocating up 1-unit of “a substantial amount of financial assistance” from children to their mothers at ages 55 and over. For men, we estimate an inverted U-shape with a peak of the net financial trans-fer flow to children when respondents are about 50 years old. Moreover, in contrast to female respondents, adult children remain recipients of net financial transfers from male respondents until about respondent’s age of 60.
Figure 8: Net transfers (financial and non-financial) to living adult children (LAC)
(a) Females: (b) Males:
Net transfers to children Net transfers to children
30 35 40 45 50 55 60
−1.0
−0.5
0.0
0.5
Age
Net tr
ansf
ers ●
● ●
●
●
●
●
● ●
● ●
●
● ●
● ●
Net financial transfer to ALC Net non−financial assistance to ALC
30 35 40 45 50 55 60
−1.0
−0.5
0.0
0.5
Age
Net tr
ansf
ers
●
● ●
●
● ●
●
● ●
●
● ●
●
●
● ●
Net financial transfer to ALC Net non−financial assistance to ALC
30 35 40 45 50 55 60
−1.0
−0.5
0.0
0.5
Age
Net tr
ansf
ers ●
●
●
●
●
●
●
● ●
●
●
●
●
●
● ●
Net financial transfer to ALC Net non−financial assistance to ALC
unimportant despite the fact that there is extensive—and also sometimes age-patterned— mutual non-financial help across the generations. Second, financial transfers to both chil-dren and parents are strongly age-patterned and peak in mid-to-late adult ages: both male and female respondents age 40–45 provide substantial upward transfers to their parents (possibly more extensive for female than for male respondents), and at the same time, they make substantial downward transfers to their LAC (possibly more extensive for male than for female respondents).
4.
Correlates of transfer patterns to/with parents
In this section, we investigate the correlates of financial and non-financial transfer patterns between respondents and their parents. Because of the limited information about intergen-erational transfer patterns in the sub-Saharan African context we focus here on descriptive analyses that identify the main correlates of intergenerational transfers in the context of rural Malawi, and we do not attempt to identify causal relationships. The regression analy-ses summarized below are also conditional on the potential transfer partner—respondent’s mother or father—being alive, and the analyses thus do not consider the correlates of parental survival or the potential selective nature of respondents whose mother or father was alive in 2008. Despite these limitations, the analyses are useful because they provide for the first time in a sub-Saharan context evidence about the extent to which transfers between individuals and their parents are correlated with respondent’s demographic, so-cioeconomic and health conditions, and with the health of their parents.