DEMOGRAPHIC RESEARCH
VOLUME 28, ARTICLE 8, PAGES 229-258
PUBLISHED 8 FEBRUARY 2013
http://www.demographic-research.org/Volumes/Vol28/8/ DOI: 10.4054/DemRes.2013.28.8
Research Article
How do immigrants fare during the downturn?
Evidence from matching comparable natives
Adriano Paggiaro
© 2013 Adriano Paggiaro.
This open-access work is published under the terms of the Creative Commons Attribution NonCommercial License 2.0 Germany, which permits use, reproduction & distribution in any medium for non-commercial purposes, provided the original author(s) and source are given credit.
1 Introduction 230
2 The empirical strategy 233
3 Data and descriptive statistics 235
3.1 Transitions from employment 236
3.2 Observed characteristics and outcomes 237
4 Propensity score matching 238
5 Stratification by propensity score 241
6 Robustness checks 245
6.1 Different definitions of immigrants 246
6.2 Exits from the sample 247
6.3 Methodological issues 248
7 Conclusions and discussion 249
8 Acknowledgements 251
References 252
How do immigrants fare during the downturn?
Evidence from matching comparable natives
Adriano Paggiaro1
Abstract
BACKGROUND
This paper provides empirical evidence regarding the supposed vulnerability of immigrants to the recent economic downturn.
OBJECTIVE
Our purpose is to understand whether immigrant workers are suffering more from the downturn and, if so, to disentangle whether this is related to being an immigrant or to specific characteristics that make immigrants different from natives.
METHODS
We use longitudinal data from the Italian Labour Force Survey to compare immigrant and native workers, matched for observable personal, household, and job characteristics by propensity score methods.
RESULTS
Immigrant workers face a higher probability of ending an ongoing employment spell because their characteristics are more likely associated with higher separation rates, while, when comparing similar workers, differences with natives disappear. In 2009 job separations increased for all male workers, but the impact was stronger for immigrants, mainly because of their characteristics. On the contrary, both groups of female workers showed a slightly lower probability of losing a job in 2009, so that observed differences remained the same before and after the downturn.
CONCLUSIONS
The impact of the downturn differs markedly by gender, with only male workers being affected. Among these, immigrants suffer more than natives, as their observable characteristics are more associated with losing a job. When comparing only comparable workers, immigrant status itself has no impact on separation rates.
1
1. Introduction
During recent decades immigrants have represented a growing share of the labour forces in most developed countries. Although several studies have explored different aspects of the effects of immigration on labour markets, few analyses have been dedicated to the relationship between the behaviour of migrant workers and the economic cycle. Nevertheless, this has turned out to be an important issue after the 2008/09 financial crisis, as "immigrants have been hard hit, and almost immediately, by the economic downturn" (OECD 2011: 74).
Before the advent of the downturn, several studies analysed the impact of immigrants on natives and national labour markets, with a strong boost at the beginning of this century (Card and Di Nardo 2000, Borjas 2001, Card 2001) and some recent contributions of interest (Okkerse 2008, Card 2009, D‟Amuri, Ottaviano, and Peri 2010, Manacorda, Manning, and Wadsworth 2012, Ottaviano and Peri 2012). The general conclusion was that immigrants (typically defined as "foreign-born") affect the native labour market only slightly: the effects on unemployment are very low, while immigration negatively affects the wages of less-skilled workers. There have also been an increasing number of studies on the condition of immigrants and their performance in the host labour market (Husted et al. 2001, Wheatley Price 2001, Dustmann and Weiss 2007, Schmitt and Wadsworth 2007), showing that immigrants undergo a clear process of assimilation but without reaching the performance of natives, and are often involved in risky jobs (Orrenius and Zavodny 2009a).
There has been less research conducted on the effect of downturns on immigrants. Dustmann, Glitz, and Vogel (2010) analysed data from past economic crises (from the 1970s to early 1990s) for the UK and Germany, in order to analyse differences in the cyclical pattern of employment and wages between immigrants and natives. Conditional on education, age, and location, they found significantly larger unemployment responses to economic shocks for immigrants, but little evidence of differential wage responses. Chiswick, Cohen, and Zach (1997) found similar results for the US in the 1980s but showed that short-term effects on employment status are not reflected in long-term "scarring" effects. More recently, Bratsberg, Barth, and Raaum (2006) used Current Population Survey data from 1979 to 2003 to show that the process of wage assimilation depends on the economic cycle, and the native/immigrant wage gap widens during economic downturns. An important consequence is that the widely held assumption of a common effect of the cycle for the two groups leads to biased estimates about differences between immigrants and natives.
rates. This is especially true for male workers who "were overrepresented in sectors which have been affected the most (construction, manufacturing [...])", while "for migrant women, employment is concentrated in sectors (e.g. social and domestic services) which did not suffer much from the economic crisis" (OECD 2011: 78, 37). As an example, Orrenius and Zavodny (2010) show for male Mexican immigrants in the US a stronger sensitivity to the business cycle when compared to natives, as they are mostly involved in "heavily cyclical sectors" such as construction and manufacturing. By contrast, they show no difference between immigrant and native women.
According to the Migration Policy Institute (Papademetriou, Sumption, and Somerville 2009) the main questions about the impact of economic downturns on immigration and immigrants‟ performance are the following: (1) Does the economic cycle affect immigration flows? (2) How will immigrants fare during the downturn? (3) How does the impact of immigration on natives change during a recession? This paper focuses on the second question by adopting a longitudinal perspective in the Italian context. The goal is to understand whether it is true that immigrants are more vulnerable than natives and are thus suffering more from the recent downturn. Moreover, if so, we aim to disentangle whether this is related to being an immigrant or to specific characteristics that make immigrants different from natives.
In 2010 the Migration Policy Institute proposed a more specific theoretical analysis of the potential effects of the downturn on immigrant labour forces, with the following conclusions (Papademetriou, Sumption, and Terrazas 2010: 9): "Immigrants‟ greater vulnerability to unemployment is typically attributed to a variety of interrelated factors:
Immigrants disproportionately share the demographic characteristics of the groups most likely to lose jobs during economic downturns.
Immigrants are more likely to work in cyclical industries and occupations.
Immigrants are more likely to work as a contingent labour force.
„Last-hired, first-fired‟ approaches tend to disadvantage immigrants."
are no causal effects to estimate, and we do not face the typical identification problems in causal inference.
The main difference with traditional regression approaches is that observed characteristics are used to match immigrant and native workers who are similar at a specific moment in time, without any reference to outcomes observed at subsequent times. Only once the groups are defined are differences in longitudinal outcomes estimated, without the need to specify parametric models. This allows for a clear distinction between the "effects" of the immigrant/native status, and the differences in subsequent behaviours which are only related to observable characteristics of immigrants and natives, independent of their status. Moreover, the comparison is carried out in the "common support"; thus, immigrants are only compared to natives who are close to them with respect to observable characteristics. This leads to consistent estimates of mean "effects" under less restrictive assumptions when compared to regression methods, even if the latter are more efficient when standard assumptions are met.
Using longitudinal data from the Italian Labour Force Survey, we exploit information about many potential sources of vulnerability described so far: typical individual demographics (age, education, region, marital status), household characteristics (by age, education, employment status), employment status (type of job and contract, sector, firm size, tenure) and some information about past work histories (previous employment status, total work experience). The goal is to compare immigrant and native workers in the Italian labour market with respect to their subsequent employment performance, in order to disentangle whether (i) immigrant workers have different characteristics when compared to natives; (ii) these characteristics are related to a different subsequent behaviour, such as transitions among labour force states; (iii) there are still differences between immigrants and natives even when comparing workers with the same characteristics.
The history of migration in Italy is similar to that in many Southern European countries and Ireland, former countries of emigration that have only recently witnessed strong immigration (see Del Boca and Venturini 2005, for a historical review). At the beginning of 2011 there were 4,570,000 resident immigrants in Italy, with a 7.5% incidence over the whole Italian population, while the same figures were 2,402,000 and 4.1% in 2005 and 356,000 and 0.6% in 1991. Thus, both in absolute and relative terms, immigrants have almost doubled their presence during the last six years, and there are 12 times more immigrants than just twenty years ago.
2006). Faini et al. (2009) analysed the process of assimilation of foreign immigrants in Italy and compared them to the internal mobility of natives. They found that the wage gap for foreign immigrants is about 20%, while workers born in other macro-areas of Italy have on average higher wages than local natives. Brucker, Fachin, and Venturini (2011) showed that the share of foreign workers in an area discourages internal mobility: foreign workers may be complementary to local natives in the destination areas, but they compete with potential workers from other areas of the country. Mocetti and Porello (2010) showed that this is also related to education: immigration is positively associated with inflows of highly educated natives, while there is a potential displacement of less educated ones. More specifically, for women, Barone and Mocetti (2011) showed that the inflow of immigrants specialised in household services (such as housekeeping and caring for children and the elderly) affects the labour supply of native women, with a positive impact on hours worked by highly skilled ones.
The structure of this paper is as follows: Section 2 presents the empirical strategy to address the main issue of interest. Section 3 presents available data and some descriptive statistics about employment status, transitions, and observable characteristics. Sections 4 and 5 respectively describe the main results of the two adopted strategies, matching and stratification by propensity score. Finally, Section 6 discusses robustness checks for the main results, while Section 7 provides conclusions.
2. The empirical strategy
A reduced-form approach is used to address the issue of the different short-term labour market behaviour of immigrants when compared to natives in Italy. The final goal is to show whether these differences are changing with the economic downturn.
We initially compare the two groups within a descriptive approach in order to look at "marginal" differences in some dynamic outcomes of interest, by using longitudinal data. The basic idea is to compare these results with "conditional" ones, obtained by using a control group2 made of native workers with the same characteristics observed for immigrants.
We use propensity score methods (Rosenbaum and Rubin 1983) in order to estimate the behaviour of workers whose only (observable) difference is the native-immigrant status I. The propensity score is defined as the probability of being an immigrant given some observed characteristics X:
2 We stress again that we use terms and methods from the impact evaluation literature, but there are no
r( 1 ), where { immigrants
natives (1)
It is important to note that strategies based on the propensity score do not need any access to longitudinal outcomes of interest Y. Only once the two groups are balanced with respect to X does the computation of mean outcomes become feasible. In the following, we use propensity score estimates in two ways.
1. Matching: We only consider matched immigrant-native pairs who share
the same (or a very close) propensity score. Thus the analysis is restricted to the "common support", as only units sharing the same characteristics with at least one member of the other group enter the analysis.
2. Stratification: We separately analyse different groups based on specific values of the propensity score distribution. In this way it is possible to compare the mean outcomes for immigrants and natives when the characteristics of both of them are more associated with immigrants (in the following, immigrant-like) or natives (native-like).
Among the many outcomes of interest that might be analysed, we mainly focus on job separations. The population of interest is the stock of 25-54-year-old workers who are employed during a specific reference week t0, and the outcomes refer to different aspects of the working status at a subsequent time t1, specifically during a three-month period after t0. The interest is on differences in the outcomes between natives and immigrants, both marginally and conditional on characteristics X observed at t0. The main focus is on how these results change with different choices for t0, specifically during the years 2007 and 2009, representing periods before and after the beginning of the downturn3.
There are different good reasons for some choices, which may appear restrictive. First, the definition of the population "at risk" of losing employment is clear both for immigrants and natives, while it is more difficult to define the set of people likely to enter employment, especially for immigrants who potentially come from the whole global labour market. Second, conditioning on prime-age workers allows us to use information about the current job spell as an additional indicator of skills and human capital4, together with other individual and household information. Third, we limit our
3 The first effects of the downturn in the Italian labour market were observed at the end of 2008: as an
example, for immigrants, the employment rate was 67.1% in both 2007 and 2008 and 64.5% in 2009, while in the same years their unemployment rate was 8.3%, 8.4%, and 11.2%, respectively.
4 As an example, Dustmann, Glitz, and Vogel (2010) are not able to explain all observed differences in
analysis to prime-age classes where employment is the more common status, especially for men5, so that sample sizes are sufficient for many analyses of interest, while this is not true for other initial conditions such as unemployment. Finally, the characteristics of recent migration in Italy ensure that in this framework immigrants are well defined as those born outside Italy, as there are very few prime-age second-generation immigrants6.
3. Data and descriptive statistics
In order to analyse the changes observed with the downturn, we exploit the longitudinal feature of the labour force survey Rilevazione Continua delle Forze di Lavoro (RCFL) by Istat, the Italian National Statistical Agency. The continuous rotating sample structure of the survey allows us to obtain three-month panels for the whole years 2007 and 20097. We focus on the employment status at t1 of individuals who were observed to work three months before. The analysis is limited to workers aged 25-54 and always stratified by gender, as the main evidence is markedly different.
Some descriptive statistics are useful in understanding how the labour market conditions of our groups of interest changed during the downturn8. In 2007 more prime-age male immigrants were employed than natives (91% vs. 87%), but they suffered a greater reduction in the employment rate in 2009 (86% vs. 85%). This is also associated with an inverted ranking for the unemployment rate (in 2007, 4.0% vs. 4.1%; in 2009, 7.1% vs. 5.2%). Unlike what was observed for men, prime-age women faced only minor changes during the period analysed here: female immigrants were always employed less than native women (55% vs. 59%), and their unemployment rates were much higher (12% vs. 7%).
the unemployed included in the analysis. The same applies to all papers using employment status as an outcome (e.g., Chiswick, Cohen, and Zach 1997, Wheatley Price 2001).
5 According to Husted et al. (2001), for men, this also has the advantage of interpreting all results from a
demand point of view, as the supply side should be positive for almost all prime-age men.
6 On the other hand there are also very few Italian citizens who were born abroad and then returned to Italy. A
more general discussion about possible alternative definitions of immigrants is provided in Section 6.
7 Each week, on average, about 6000 households are interviewed for the first time. Then each household is
potentially interviewed 3, 12, and 15 months after the first wave. As preliminary analyses showed no rotating sample bias, we pool all 52 weekly three-month panels for each year: for half of them we use waves 1 and 2; for the other half we use waves 3 and 4, depending on which of them occur in either 2007 or 2009. The exclusion of 2008 prevents us from using the same household twice in the analysis.
8 The main characteristics of immigrants from RCFL are essentially the same observed in literature from
3.1 Transitions from employment
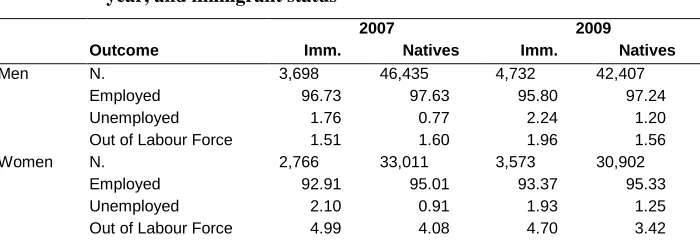
By restricting our attention to prime-age workers who are employed at t0, the first interesting descriptive evidence is their employment status at t1, i.e., three months after
t0 (Table 1)9. For men, in 2007, immigrants were more likely to lose their employed status, with a difference of 0.9 pp10. This was entirely due to higher transitions to unemployment (1 pp), while the difference between probabilities of getting out of the labour force was not significant. After the downturn conditions worsened for both natives and immigrants, but to a higher extent for the latter, with the difference rising to 1.4. Specifically, the probability of moving to unemployment was about 0.5 higher for both groups, while exits from the labour force only increased for immigrants.
Table 1: Transition rates from employment after three months by gender,
year, and immigrant status
2007 2009
Outcome Imm. Natives Imm. Natives
Men N. 3,698 46,435 4,732 42,407
Employed 96.73 97.63 95.80 97.24
Unemployed 1.76 0.77 2.24 1.20
Out of Labour Force 1.51 1.60 1.96 1.56
Women N. 2,766 33,011 3,573 30,902
Employed 92.91 95.01 93.37 95.33
Unemployed 2.10 0.91 1.93 1.25
Out of Labour Force 4.99 4.08 4.70 3.42
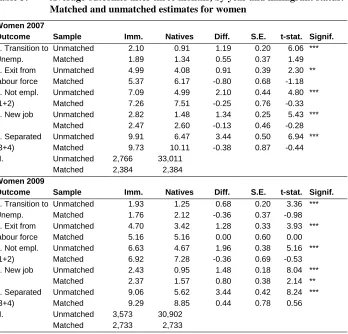
The evidence is again different for women. First, overall transition rates were much higher than those observed for men, but this was almost exclusively due to exits from the labour force, which were more than double for female workers. Turning to differences by immigrant status, in 2007 native women were about 2.1 pp more stable than immigrant women, with lower transitions both to unemployment (1.2) and out of the labour force (0.9). These figures were similar after the downturn, having the only sizeable effect of a lower exit rate out of the labour force for native women11.
9 All evidence is essentially the same regardless of whether we use sampling weights. Thus, for the sake of
clarity and simplicity, results in the following are always presented unweighted.
10 Here and after, all estimated differences are expressed in percentage points (pp), even when they are more
easily referred to as probabilities.
11 According to Papademetriou, Sumption, and Terrazas (2010) and OECD (2011), these gender differences
3.2 Observed characteristics and outcomes
Together with the immigrant/native status, transition probabilities depend on many characteristics of the job, of the workers themselves, of their households, and of working histories, which may be used as a proxy for human capital. Observed variables useful for the following analysis are provided in Tables A1 to A5 in Appendix A. The following is a summary list:
individual demographics (age, region, education, marital status);
household characteristics (number of members by age brackets, number of employed and unemployed, education levels);
characteristics of the job held at t0 (type of job and contract, sector, firm size, tenure);
labour market condition one year before t0 and overall lifetime
experience.
Tables A1 to A4 show the distribution of most variables by immigrant status and gender. Almost all differences between immigrants and natives are statistically significant at the 1% level. Here we just outline the differences by immigrant status that will be useful as examples for a substantial interpretation of our main results.
Compared to natives, immigrant prime-age workers were more concentrated in the Northeast of Italy and less in the South. They were younger and slightly less educated12. As for the household structure, they more often lived alone (or, for men, in large households with young children), they were much more often widowed or divorced and they much less frequently were son (or descendent) of the head of the household. In immigrant households there were also fewer elders, fewer educated and employed members, and more unemployed people.
Regarding job characteristics, immigrants were strongly concentrated in blue-collar employment; they were much less frequently engaged in white-blue-collar and self-employment than their native counterparts. They were more often employed in small firms involved in specific sectors (construction for men, private and domestic services for women) and much less frequently employed in the public sector. They had less tenure and total work experience when compared to natives, and they were also less employed one year before the survey.
As outcomes of interest at t1 we primarily use transitions already described in Section 3.1 (unemployment and being out of the labour force) but with some additional
12 As education is difficult to compare for immigrants, Istat reconstructs it essentially by means of years of
details. First, we define "Not employed" as the sum of the previous ones (thus, this is the complement of "Employed" in Table 1). As almost all of them declared the separation to be involuntary (thus excluding voluntary resignations), and the age range chosen limits direct transitions to pension, we may expect this outcome to have a "negative" connotation.
Additionally, we also look at separations that took to (at least) a new employment spell during the three-month window. We define "New job" as an employment spell observed at t1 that began during the last three months, thus after the previous interview: the worker is still employed, but there has been (at least) a separation. Finally, we obtain a "Separation rate" by adding workers who are no longer employed to workers who have a new job. Obviously this has to be analysed more as a "mobility" outcome, which does not necessarily have a negative connotation, as many job changes might be voluntary. The combination of these outcomes may help to elucidate the dynamics at play.
4. Propensity score matching
The results in Section 3.1 roughly compared some outcomes of interest between immigrants and natives. We now turn to the estimation of conditional differences using the first strategy outlined in Section 2: we balance the two groups with respect to the set of observable characteristics presented in Section 3.2, using also the additional outcomes there described. For each outcome average differences between immigrants and natives are estimated before and after the matching procedure, and the same strategy is applied before and after the downturn. Here we only outline the main results; robustness checks and more detail on the matching method are presented in Section 6.
Tables 2 and 3 show the results of the propensity score matching for men and women, respectively13. The overall evidence is that matching strongly reduces the average differences between immigrants and natives, and in almost all cases these turn out not to be significant. Thus the significant differences observed in the unmatched samples (or equivalently in Table 1) are only related to different observable characteristics of the two groups of workers, while if we only consider native workers who are similar to immigrant workers the average differences disappear.
13 Propensity score estimates and distributions are not presented here for the sake of brevity. The substantial
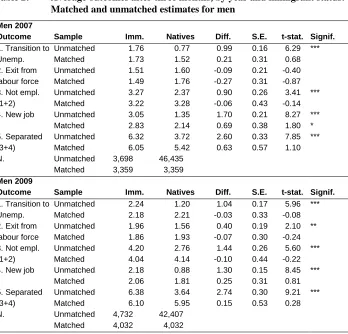
Going into more detail, Table 2 confirms for male workers the highly significant difference between the probabilities of transition to the "Not employed" status for the two unmatched groups (0.90 in 2007, 1.44 in 2009). However, after the matching procedure the difference turns out to be negligible (and even slightly negative) in both years. This evidence also applies to transitions both to unemployment and out of the labour force.
Table 2: Average outcomes after three months, by year and immigrant status:
Matched and unmatched estimates for men
Men 2007
Outcome Sample Imm. Natives Diff. S.E. t-stat. Signif. 1. Transition to
Unemp.
Unmatched 1.76 0.77 0.99 0.16 6.29 ***
Matched 1.73 1.52 0.21 0.31 0.68
2. Exit from labour force
Unmatched 1.51 1.60 -0.09 0.21 -0.40
Matched 1.49 1.76 -0.27 0.31 -0.87
3. Not empl. (1+2)
Unmatched 3.27 2.37 0.90 0.26 3.41 ***
Matched 3.22 3.28 -0.06 0.43 -0.14
4. New job Unmatched 3.05 1.35 1.70 0.21 8.27 ***
Matched 2.83 2.14 0.69 0.38 1.80 *
5. Separated (3+4)
Unmatched 6.32 3.72 2.60 0.33 7.85 ***
Matched 6.05 5.42 0.63 0.57 1.10
N. Unmatched 3,698 46,435
Matched 3,359 3,359
Men 2009
Outcome Sample Imm. Natives Diff. S.E. t-stat. Signif. 1. Transition to
Unemp.
Unmatched 2.24 1.20 1.04 0.17 5.96 ***
Matched 2.18 2.21 -0.03 0.33 -0.08
2. Exit from labour force
Unmatched 1.96 1.56 0.40 0.19 2.10 **
Matched 1.86 1.93 -0.07 0.30 -0.24
3. Not empl. (1+2)
Unmatched 4.20 2.76 1.44 0.26 5.60 ***
Matched 4.04 4.14 -0.10 0.44 -0.22
4. New job Unmatched 2.18 0.88 1.30 0.15 8.45 ***
Matched 2.06 1.81 0.25 0.31 0.81
5. Separated (3+4)
Unmatched 6.38 3.64 2.74 0.30 9.21 ***
Matched 6.10 5.95 0.15 0.53 0.28
N. Unmatched 4,732 42,407
Matched 4,032 4,032
In order to better understand why this happens, sticking to the 2009 example, among the 42,407 natives involved in the analysis the average transition rate is 2.76%, but this figure jumps to 4.14% when we limit our attention to the 4,032 natives who are closer to their immigrant counterparts with respect to all observable characteristics. A selection works for immigrants too, but here the difference between matched and unmatched samples is much smaller (4.20 vs. 4.04), as more than 85% of immigrants find a close match among natives.
Adding new evidence, we now look at job-to-job transitions and total separations. In 2007 the probability of leaving a job and finding a different one ("New job" in Table 2) was more than double for immigrants when compared to natives. After the matching the difference was much smaller and only significant at the 10% level. In 2009, both groups were affected by the downturn, but the reduction in job mobility was stronger for immigrants, so that the differences were smaller and became not significant for the matched samples.
Finally, we obtain separation rates after adding all types of transitions. The more interesting evidence is that separation rates changed very little from 2007 to 2009 for both immigrants and natives. Thus, the probability of ending an ongoing job spell during the following three months did not change with the downturn. The actual change reflects the probability of immediately finding a new job once the previous one has ended. Despite some differences, this evidence is consistent in both groups: as for all other outcomes, both in 2007 and 2009, the differences in total separation rates were significant for the whole sample but not significant after matching.
Table 3: Average outcomes after three months, by year and immigrant status: Matched and unmatched estimates for women
Women 2007
Outcome Sample Imm. Natives Diff. S.E. t-stat. Signif. 1. Transition to
Unemp.
Unmatched 2.10 0.91 1.19 0.20 6.06 ***
Matched 1.89 1.34 0.55 0.37 1.49
2. Exit from labour force
Unmatched 4.99 4.08 0.91 0.39 2.30 **
Matched 5.37 6.17 -0.80 0.68 -1.18
3. Not empl. (1+2)
Unmatched 7.09 4.99 2.10 0.44 4.80 ***
Matched 7.26 7.51 -0.25 0.76 -0.33
4. New job Unmatched 2.82 1.48 1.34 0.25 5.43 ***
Matched 2.47 2.60 -0.13 0.46 -0.28
5. Separated (3+4)
Unmatched 9.91 6.47 3.44 0.50 6.94 ***
Matched 9.73 10.11 -0.38 0.87 -0.44
N. Unmatched 2,766 33,011
Matched 2,384 2,384
Women 2009
Outcome Sample Imm. Natives Diff. S.E. t-stat. Signif. 1. Transition to
Unemp.
Unmatched 1.93 1.25 0.68 0.20 3.36 ***
Matched 1.76 2.12 -0.36 0.37 -0.98
2. Exit from labour force
Unmatched 4.70 3.42 1.28 0.33 3.93 ***
Matched 5.16 5.16 0.00 0.60 0.00
3. Not empl. (1+2)
Unmatched 6.63 4.67 1.96 0.38 5.16 ***
Matched 6.92 7.28 -0.36 0.69 -0.53
4. New job Unmatched 2.43 0.95 1.48 0.18 8.04 ***
Matched 2.37 1.57 0.80 0.38 2.14 **
5. Separated (3+4)
Unmatched 9.06 5.62 3.44 0.42 8.24 ***
Matched 9.29 8.85 0.44 0.78 0.56
N. Unmatched 3,573 30,902
Matched 2,733 2,733
Note: *** 1%; ** 5%; *10%.
5. Stratification by propensity score
As seen in Section 2, the basic idea of the paper is to concentrate all the different characteristics of immigrants and natives in a single number, the propensity score, which represents the "propensity" to be an immigrant given the observed variables. A simple way to show how these variables are related to transition probabilities is to stratify the samples by groups sharing similar propensity scores.
As an example, in the following we divide each group into three classes characterised by the following levels of the propensity score p: (a) native-like (p<.1), made of mostly natives and of those immigrants who are native-like with regard to observed characteristics X; (b) intermediate (.1<p<.3), sharing characteristics of both immigrants and natives; (c) immigrant-like (p>.3), made of mostly immigrants and those natives who are immigrant-like with regard to observed characteristics X.
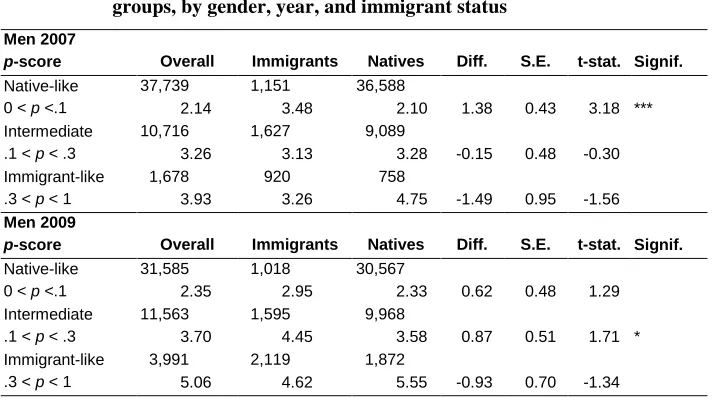
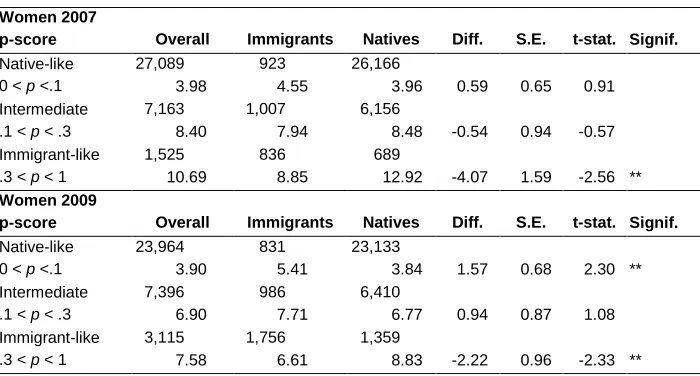
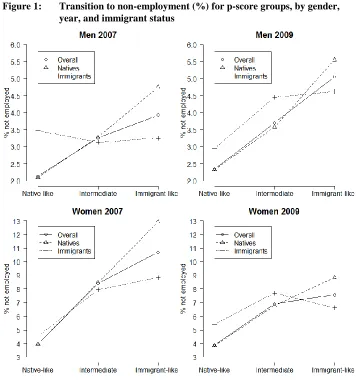
Table 4 and Figure 1 show the probability of transition out of employment ("Not empl." in Tables 2 and 3) stratified by p-score class. The first interesting results emerge if we look at the "Overall" column in Table 4 and the related solid lines in Figure 1, where transition rates are estimated without taking into account the true immigrant/native status of each worker. The clear evidence is that immigrant-like workers always have higher probabilities of losing their job than native-like ones, independent of their true immigrant status.
Table 4: Sample size and transition to non-employment (%) for p-score
groups, by gender, year, and immigrant status
Men 2007
p-score Overall Immigrants Natives Diff. S.E. t-stat. Signif.
Native-like 0 < p <.1
37,739 1,151 36,588
2.14 3.48 2.10 1.38 0.43 3.18 ***
Intermediate .1 < p < .3
10,716 1,627 9,089
3.26 3.13 3.28 -0.15 0.48 -0.30
Immigrant-like .3 < p < 1
1,678 920 758
3.93 3.26 4.75 -1.49 0.95 -1.56
Men 2009
p-score Overall Immigrants Natives Diff. S.E. t-stat. Signif. Native-like
0 < p <.1
31,585 1,018 30,567
2.35 2.95 2.33 0.62 0.48 1.29
Intermediate .1 < p < .3
11,563 1,595 9,968
3.70 4.45 3.58 0.87 0.51 1.71 *
Immigrant-like .3 < p < 1
3,991 2,119 1,872
Table 4: (continued)
Women 2007
p-score Overall Immigrants Natives Diff. S.E. t-stat. Signif. Native-like
0 < p <.1
27,089 923 26,166
3.98 4.55 3.96 0.59 0.65 0.91
Intermediate .1 < p < .3
7,163 1,007 6,156
8.40 7.94 8.48 -0.54 0.94 -0.57
Immigrant-like .3 < p < 1
1,525 836 689
10.69 8.85 12.92 -4.07 1.59 -2.56 **
Women 2009
p-score Overall Immigrants Natives Diff. S.E. t-stat. Signif. Native-like
0 < p <.1
23,964 831 23,133
3.90 5.41 3.84 1.57 0.68 2.30 **
Intermediate .1 < p < .3
7,396 986 6,410
6.90 7.71 6.77 0.94 0.87 1.08
Immigrant-like .3 < p < 1
3,115 1,756 1,359
7.58 6.61 8.83 -2.22 0.96 -2.33 **
Note: *** 1%; ** 5%; *10%.
Figure 1: Transition to non-employment (%) for p-score groups, by gender, year, and immigrant status
Finally, jointly considering propensity scores and true immigrant status enables us to examine possible heterogeneous effects of the downturn14. Common evidence from
14 Note that propensity score-related estimators usually have good properties to estimate average “effects”,
Table 4 and Figure 1 is that the observed relationship between transition rates and propensity scores is stronger for natives than for immigrants. Specifically, immigrant-like natives are always much more involved in transitions than other workers, even when compared to immigrants themselves. By contrast, differences between the groups of immigrants are smaller, so that their transition probability is less related to observable characteristics.
This evidence is particularly clear for men before the downturn, with negligible differences among transition rates of immigrants from the three p-score classes. By contrast their native counterparts showed an increase from 2.10% for the native-like class to 4.75% for the immigrant-like class. This also points to a significant difference by immigrant status for small values of the p-score, indicating that male native-like immigrants faced worse conditions than their native counterparts. This effect disappears after the downturn, when also for immigrants we begin to observe different conditions by p-score classes: native-like immigrants showed diminishing transition probabilities, while all immigrant-like workers had worse probabilities, and this was stronger for immigrants.
As already seen, the situation is very different for women. In 2007 the strong overall difference by p-score classes also affected immigrants but it was stronger for natives, pointing to significantly worse conditions for immigrant-like native women when compared to their immigrant counterparts15. As before, the effect of the downturn was opposite to that observed for men. Within the lowest p-score class transition rates increased for immigrants and slightly decreased for natives, pointing to a significantly worse condition for female native-like immigrants. For the higher p-score categories the impact of the downturn was positive and stronger for natives, so that the observed differences were lower than in 2007 despite being still significant for the immigrant-like class.
6. Robustness checks
The results obtained thus far might be, in principle, very sensitive to choices about how immigrants are defined, how the longitudinal sample is built, and which method is used to estimate the differences of interest. Nevertheless, our analyses show a general robustness of the main evidence of the paper to different combinations of these choices.
For the sake of brevity in this section we only show a few examples of robustness checks related to male workers in 2009. The main substantial evidence is the same for the other groups of interest.
15 This could be consistent with the findings of Barone and Mocetti (2011) on the substitution effect of female
6.1 Different definitions of immigrants
An important point from the literature review is to check whether the results presented thus far are different with regard to certain important characteristics of immigrants. As an example, immigrants born in different areas of the world typically show different behaviours and might react differently to the downturn. From another perspective, the length of stay in Italy might play an important role in terms of integration, language barriers, citizenship, and other important features leading to potential differences between immigrants and natives.
Our overall evidence indicates that the main results are robust to different definitions of the populations of interest. Similar results are obtained when considering Italian (or EU16) citizenship in order to define immigrants, instead of place of birth or different lengths of stay in Italy17. Moreover, stratification by area of birth shows different levels of marginal outcomes, but differences always disappear after the matching procedures: this seems to be, again, a composition effect, with immigrants from different areas of the world having specific observable characteristics that explain their different transition probabilities.
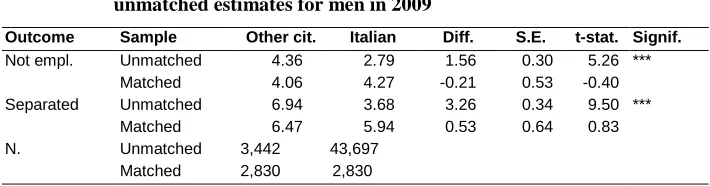
As an example, here we only show some results related to citizenship, as this is sometimes used in the literature to define the immigrant population and is readily available from administrative data. Moreover, immigrants may obtain Italian citizenship only after maintaining residence for a certain length of time, so citizenship is also related to the length of stay in the country.
Sticking to male workers, among the 42,407 natives in the 2009 sample only eight did not have Italian citizenship, while the composition of the 4,732 immigrants was more heterogeneous: 28% were Italian citizens, 16% were EU citizens, and the remaining 56% were from non-EU countries. Our analyses show that there were some differences in transition probabilities among these immigrant groups and between them and Italian natives, but on average they always disappear when taking into account observable characteristics. Table 5 shows the estimates for two specific outcomes when comparing Italian citizens to citizens of other countries, and even with this different definition of the groups of interest the main evidence remains unchanged.
16 Our observation window is later than the last EU enlargement; thus, all analyses regarding EU citizenship
are comparable over time.
17 This analysis is only descriptive here, as for each sample it is not possible to disentangle the effect of the
Table 5: Average outcomes after three months, by citizenship: matched and unmatched estimates for men in 2009
Outcome Sample Other cit. Italian Diff. S.E. t-stat. Signif.
Not empl. Unmatched 4.36 2.79 1.56 0.30 5.26 ***
Matched 4.06 4.27 -0.21 0.53 -0.40
Separated Unmatched 6.94 3.68 3.26 0.34 9.50 ***
Matched 6.47 5.94 0.53 0.64 0.83
N. Unmatched 3,442 43,697
Matched 2,830 2,830
Note: *** 1%; ** 5%; *10%.
6.2 Exits from the sample
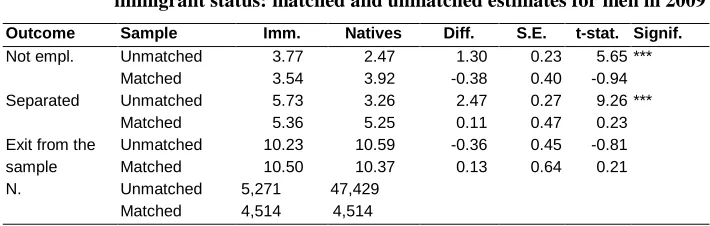
Non-random attrition could be a potential source of bias if exits from the sample are different for immigrants and natives (e.g., in the presence of selective return migration, Dustmann and Weiss 2007).
While thus far we have only considered units observed in both selected waves, it is possible to apply the same empirical strategy to the whole sample of workers at t0, considering attrition at t1as an additional outcome. The main result is that overall exit rates are about 10% for both immigrants and natives, and these figures do not change after the matching procedure. Thus, on average, there is no composition effect from exiting the panel. Consequently the main evidence on the other outcomes does not change qualitatively when compared to Tables 2 and 3.
Table 6: Average outcomes after three months with exits from the sample, by immigrant status: matched and unmatched estimates for men in 2009
Outcome Sample Imm. Natives Diff. S.E. t-stat. Signif.
Not empl. Unmatched 3.77 2.47 1.30 0.23 5.65 ***
Matched 3.54 3.92 -0.38 0.40 -0.94
Separated Unmatched 5.73 3.26 2.47 0.27 9.26 ***
Matched 5.36 5.25 0.11 0.47 0.23
Exit from the sample
Unmatched 10.23 10.59 -0.36 0.45 -0.81
Matched 10.50 10.37 0.13 0.64 0.21
N. Unmatched 5,271 47,429
Matched 4,514 4,514
Note: *** 1%; ** 5%; *10%.
6.3 Methodological issues
Many other robustness checks consider sensitivity analyses to methodological choices. Here we only outline the main ones regarding propensity score methods and the choice of observed variables.
Regarding propensity score estimates and matching, we used the psmatch2 Stata program (Leuven and Sianesi 2003), trying with different matching methods for a sensitivity analysis. The results presented in the paper use probit propensity scores and caliper matching with .001 bandwidth, including in the analysis only units within the common support. Different methods show similar results, so that again the main evidence is robust.
Turning to observed covariates, the RCFL rotating sample scheme allows us to observe information before t0 for half of the sample for additional robustness checks by looking at retrospective items18. As an example, two years before t0, immigrants were significantly less employed and self-employed and had more temporary contracts than their native counterparts. Nevertheless, after balancing for observed characteristics X, all these differences become non-significant, thus strengthening our strategy to control for past histories when comparing the future behaviour of the two groups.
18 Paggiaro, Rettore, and Trivellato (2009) used a similar strategy to obtain over-identification tests in an
7. Conclusions and discussion
This paper analyses the differences between immigrants and natives in Italy during the recent economic downturn. Data before the downturn show that immigrant workers have a higher probability of ending their job spell and of becoming unemployed when compared to natives, but the average differences disappear when we only consider natives sharing the same observed characteristics X with immigrants, with respect to individual demographics, household characteristics, and job characteristics.
How is this evidence changing after the downturn? First, on average, the probability of exiting from employment is increasing for men, but it is decreasing for women, and the sign of the effect is the same for immigrants and natives. Thus, the analysis of the downturn and its interpretation has to be stratified by gender.
Regarding men, the negative effect is stronger for immigrants than for natives, so that the observed differences by immigrant status are higher after the downturn. Nevertheless, when considering only similar workers with respect to X, the average differences still disappear. Why is this happening? Clear evidence is obtained by stratifying by propensity score (the probability of being an immigrant given X): immigrant-like workers face the worst effects of the downturn, independent of their true immigrant status, while among native-like workers the average effect is negligible, and even positive for immigrants. As an example, an intuitive interpretation of this would be that industries more characterised by male immigrant labour forces, such as construction, are more hit by the recent downturn. This confirms, from a longitudinal point of view and under a more robust methodological approach, the descriptive findings of OECD (2010, 2011) and Orrenius and Zavodny (2010).
The evidence for women is the opposite. The overall reduction in separation rates is stronger for immigrants, so that differences to natives are slightly lower after the downturn. However, again, differences by immigrant status become not significant after matching on X. Looking at the stratification by p-score, as observed for men the stronger effects are for immigrant-like workers, but in this case this goes in the direction of a lower probability of losing a job. Thus, again as an example, sectors more characterised by immigrant female labour forces, such as private and domestic services, are faring better during the downturn.
groups is mostly due to their characteristics, while there does not seem to be any kind of "discrimination" once we compare workers who are exactly the same with the only exception being their immigrant status. This is true both before and after the downturn and for men and women.
Clearly, this evidence does not allow us to conclude that there is no discrimination at all, but only that there are no differences by immigrant status between comparable workers once we condition on the observed characteristics X at an initial time t0. This is a very important result, as we may explain all differences between separation rates by means of observable variables, without having to guess which unobservables might be at play. Still, within our proposed strategy, we may not take into account the process leading to observe X for a specific worker, which might include different kinds of discrimination19. As an example, when considering the probability of finding a job with specific characteristics it would be important to understand why male immigrant workers are more involved in blue-collar work, sectors like construction, or jobs which are more prone to be hit by downturns. According to the literature review by Pichler (2011), among the reasons for immigrants‟ different occupational attainment are deficiencies in language skills, limited international transferability of skills, lower social status, and ethnic and cultural attributes, while a general discrimination against immigrants is never relevant. A careful analysis of this topic requires a clear definition of the population likely to take on a specific job, together with the specification of a structural job search model allowing for immigration, discrimination, and potentially for a dual labour market involving differently immigrant and native workers. Thus it is beyond the goals of this paper, and is left to future research.
Finally, admittedly, these results only reflect one part of the tale, as they limit their attention to regular immigrants who are already employed in Italy. A more comprehensive analysis is needed that examines the overall flows in and out of Italy and its labour market and the impact of downturns on irregular workers. In a period in which immigrants in many developed countries are seen as one of the main reasons for the worsening conditions of natives20, political restrictions on their immigration or regularisation may have long-term effects on the overall presence of immigrants and their impact on local labour markets. Unfortunately this analysis demands a much better comprehension of the dynamics of worldwide labour forces. Specifically, flows in and out of the Italian labour market may potentially involve the whole global market, especially regarding the definition of the set of (even potential) workers "at risk" of
19
We thank an anonymous referee for underlying this point.
20 According to Okkerse (2008), data from the Eurobarometer 2000 show that about half of EU citizens were
entering the national market. As data and theoretical models covering all these aspects are currently not available, the strategy of this paper is to reduce the questions of interest to those which may be empirically answered without strong and untestable assumptions.
8. Acknowledgements
References
Barone, G. and Mocetti, S. (2011). With a little help from abroad: The effect of low-skilled immigration on the female labour supply. Labour Economics 18(5): 664-675. doi:10.1016/j.labeco.2011.01.010.
Borjas, G.J. (2001). Does immigration grease the wheels of the labor market?
Brookings Papers on Economic Activity 1: 69-119. doi:10.1353/eca.2001.0011.
Bratsberg, B., Barth, E., and Raaum, O. (2006). Local unemployment and the relative wages of immigrants: Evidence from the Current Population Surveys. The Review of Economics and Statistics 88(2): 243-263. doi:10.1162/rest.88.2.243.
Brucker, H., Fachin, S., and Venturini, A. (2011). Do foreigners replace native immigrants? A panel cointegration analysis of internal migration in Italy.
Economic Modelling 28(3): 1078-1089. doi:10.1016/j.econmod.2010.11.020.
Card, D. (2001). Immigrant inflows, native outflows and the local labor market impacts
of higher immigration. Journal of Labour Economics 19(1): 22-64.
doi:10.1086/209979.
Card, D. (2009). Immigration and inequality. American Economic Review 99(2): 1-21.
doi:10.1257/aer.99.2.1.
Card, D. and Di Nardo, J.E. (2000). Do immigrant inflows lead to native outflows?
American Economic Review 90(2): 360-73(367). doi:10.1257/aer.90.2.360.
Chiswick, B., Cohen, Y., and Zach, T. (1997). The labor market status of immigrants: Effects of the unemployment rate at arrival and duration of residence. Industrial and Labor Relations Review 50(2): 289-303. doi:10.2307/2525087.
D‟Amuri, F., Ottaviano, G., and Peri, G. (2010). The labor market impact of
immigration in Western Germany in the 1990s. European Economic Review
54(4): 550-570. doi:10.1016/j.euroecorev.2009.10.002.
Del Boca, D. and Venturini, A. (2005). Italian migration. In: Zimmermann, K.F. (ed.).
European migration: What do we know? Oxford: Oxford University Press: 303-336.
Dustmann, C., Glitz, A., and Vogel, T. (2010). Employment, wages, and the economic
cycle: Differences between immigrants and natives. European Economic Review
Dustmann, C. and Weiss, Y. (2007). Return migration: Theory and empirical evidence
from the UK. British Journal of Industrial Economics 45(2): 236-256.
doi:10.1111/j.1467-8543.2007.00613.x.
Faini, R., Strom, S., Venturini, A., and Villosio, C. (2009). Are foreign migrants more assimilated than native ones? Bonn: Institute for the Study of Labor. (IZA Discussion Paper; 4639).
Gavosto, A., Venturini, A., and Villosio, C. (1999). Do immigrants compete with natives? Labour 13(3): 603-621. doi:10.1111/1467-9914.00108.
Heckman, J., Lalonde, R., and Smith, J. (1999). The economics and econometrics of active labor market programs. In: Ashenfelter, O. and Card, D. (eds.). Handbook of Labor Economics, Vol. III, Part A. Amsterdam: Elsevier: 1865-2097. doi:10.1016/S1573-4463(99)03012-6.
Heckman, J., Urzua, S., and Vytlacil, E. (2006). Understanding instrumental variables in models with essential heterogeneity. Review of Economics and Statistics
88(3): 389-432. doi:10.1162/rest.88.3.389.
Husted, L., Skyt Nielsen, H., Rosholm, M., and Smith, N. (2001). Employment and wage assimilation of male first-generation immigrants in Denmark. International Journal of Manpower 22(1/2): 39-71. doi:10.1108/01437720110386377.
Leuven, E. and Sianesi, B. (2003). PSMATCH2: Stata module to perform full Mahalanobis and propensity score matching, common support graphing, and covariate imbalance testing. Boston: Boston College Department of Economics. (Statistical software components; S432001).
Manacorda, M., Manning, A., and Wadsworth, J. (2012). The impact of immigration on the structure of wages: Theory and evidence from Britain. Journal of the European Economic Association 10(1): 120-151. doi:10.1111/j.1542-4774.2011.01049.x.
Mocetti, S. and Porello, C. (2010). How does immigration affect native internal mobility? New evidence from Italy. Regional Science and Urban Economics
40(6): 427-439. doi:10.1016/j.regsciurbeco.2010.05.004.
OECD (2010). International Migration Outlook. Paris: OECD.
OECD (2011). International Migration Outlook. Paris: OECD.
Okkerse, L. (2008). How to measure labour market effects of immigration: A review.
Orrenius, P.M. and Zavodny, M. (2009a). Do immigrants work in riskier jobs?
Demography 46(3): 535-551. doi:10.1353/dem.0.0064.
Orrenius, P.M. and Zavodny, M. (2009b). Tied to the business cycle: How immigrants fare in good and bad economic times. Washington, DC: Migration Policy Institute.
Orrenius, P.M. and Zavodny, M. (2010). Mexican immigrant employment outcomes
over the business cycle. American Economic Review 100(2): 316-20.
doi:10.1257/aer.100.2.316.
Ottaviano, G. and Peri, G. (2012). Rethinking the effect of immigration on wages.
Journal of the European Economic Association 10(1): 152-197. doi:10.1111/j.1542-4774.2011.01052.x.
Paggiaro, A., Rettore, E., and Trivellato, U. (2009). The effect of experiencing a spell of temporary employment vs. a spell of unemployment on short-term labour market outcomes. Trento: IRVAPP (IRVAPP PR; 2009-03).
Papademetriou, D.G., Sumption, M., and Somerville, W. (2009). Migration and the economic downturn: What to expect in the European Union. Washington, DC: Migration Policy Institute.
Papademetriou, D.G., Sumption, M., and Terrazas, A. (2010). Migration and immigrants two years after the financial collapse: Where do we stand? Washington, DC: Migration Policy Institute.
Pichler, F. (2011). Success on European labor markets: A cross-national comparison of
attainment between immigrant and majority populations. International
Migration Review 45(4): 938-978. doi:10.1111/j.1747-7379.2011.00873.x.
Rosenbaum, P. and Rubin, D. (1983). The central role of the propensity score in
observational studies for causal effects. Biometrika 70(1): 41-55.
doi:10.1093/biomet/70.1.41.
Schmitt, J. and Wadsworth, J. (2007). Changes in the relative economic performance of immigrants to Great Britain and the United States, 1980-2000. British Journal of Industrial Relations 45(4): 659-686. doi:10.1111/j.1467-8543.2007.00646.x.
Venturini, A. and Villosio, C. (2006). Labour market effects of immigration into Italy:
An empirical analysis. International Labour Review 145(1/2): 91-118.
doi:10.1111/j.1564-913X.2006.tb00011.x.
Wheatley Price, S. (2001). The employment adjustment of male immigrants in England.
Appendix A: covariates for propensity score estimation
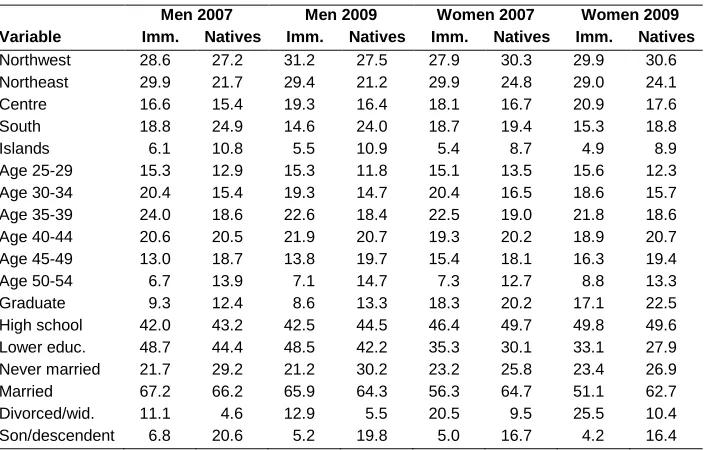
Table A1: Distribution of personal characteristics by gender, year, and
immigrant status
Men 2007 Men 2009 Women 2007 Women 2009 Variable Imm. Natives Imm. Natives Imm. Natives Imm. Natives
Northwest 28.6 27.2 31.2 27.5 27.9 30.3 29.9 30.6
Northeast 29.9 21.7 29.4 21.2 29.9 24.8 29.0 24.1
Centre 16.6 15.4 19.3 16.4 18.1 16.7 20.9 17.6
South 18.8 24.9 14.6 24.0 18.7 19.4 15.3 18.8
Islands 6.1 10.8 5.5 10.9 5.4 8.7 4.9 8.9
Age 25-29 15.3 12.9 15.3 11.8 15.1 13.5 15.6 12.3
Age 30-34 20.4 15.4 19.3 14.7 20.4 16.5 18.6 15.7
Age 35-39 24.0 18.6 22.6 18.4 22.5 19.0 21.8 18.6
Age 40-44 20.6 20.5 21.9 20.7 19.3 20.2 18.9 20.7
Age 45-49 13.0 18.7 13.8 19.7 15.4 18.1 16.3 19.4
Age 50-54 6.7 13.9 7.1 14.7 7.3 12.7 8.8 13.3
Graduate 9.3 12.4 8.6 13.3 18.3 20.2 17.1 22.5
High school 42.0 43.2 42.5 44.5 46.4 49.7 49.8 49.6
Lower educ. 48.7 44.4 48.5 42.2 35.3 30.1 33.1 27.9
Never married 21.7 29.2 21.2 30.2 23.2 25.8 23.4 26.9
Married 67.2 66.2 65.9 64.3 56.3 64.7 51.1 62.7
Divorced/wid. 11.1 4.6 12.9 5.5 20.5 9.5 25.5 10.4
Son/descendent 6.8 20.6 5.2 19.8 5.0 16.7 4.2 16.4
Table A2: Distribution of household characteristics by gender, year, and
immigrant status
Men 2007 Men 2009 Women 2007 Women 2009 Variable Imm. Natives Imm. Natives Imm. Natives Imm. Natives
1 member 16.9 7.7 18.4 9.2 18.2 6.9 22.4 7.6
2 members 14.2 13.6 14.1 14.2 21.6 18.3 21.8 19.4
3 members 24.0 30.2 24.2 30.1 25.3 31.9 24.0 32.0
4 members 29.9 37.0 28.2 35.8 25.3 33.7 23.3 32.5
5 + members 15.0 11.5 15.1 10.7 9.6 9.2 8.5 8.5
Age <15 y/n 52.9 45.5 52.0 45.0 44.5 42.1 41.5 42.0
Age >64 y/n 5.0 12.4 4.4 12.0 5.8 10.8 5.9 10.9
1 more empl. 37.7 47.4 36.4 47.4 55.9 63.2 51.6 62.9
2+ more empl. 8.1 10.4 7.8 9.1 9.8 13.3 9.1 11.4
Unemp. y/n. 7.6 5.6 8.0 5.9 4.1 4.0 6.3 4.8
Other grad. y/n 9.3 13.6 9.5 14.9 9.3 15.1 9.2 15.5
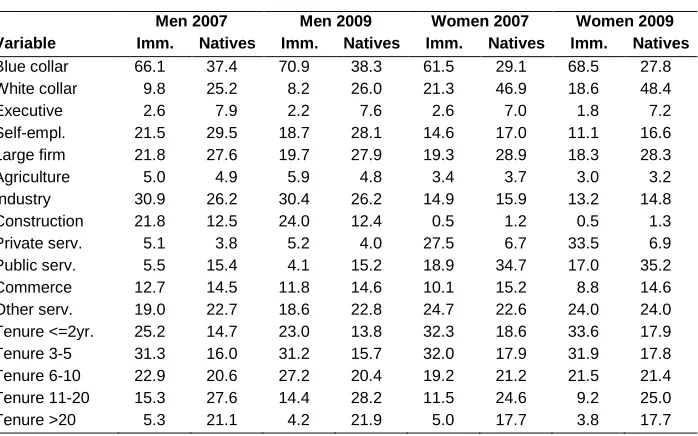
Table A3: Distribution of job characteristics by gender, year, and immigrant status
Men 2007 Men 2009 Women 2007 Women 2009 Variable Imm. Natives Imm. Natives Imm. Natives Imm. Natives
Blue collar 66.1 37.4 70.9 38.3 61.5 29.1 68.5 27.8
White collar 9.8 25.2 8.2 26.0 21.3 46.9 18.6 48.4
Executive 2.6 7.9 2.2 7.6 2.6 7.0 1.8 7.2
Self-empl. 21.5 29.5 18.7 28.1 14.6 17.0 11.1 16.6
Large firm 21.8 27.6 19.7 27.9 19.3 28.9 18.3 28.3
Agriculture 5.0 4.9 5.9 4.8 3.4 3.7 3.0 3.2
Industry 30.9 26.2 30.4 26.2 14.9 15.9 13.2 14.8
Construction 21.8 12.5 24.0 12.4 0.5 1.2 0.5 1.3
Private serv. 5.1 3.8 5.2 4.0 27.5 6.7 33.5 6.9
Public serv. 5.5 15.4 4.1 15.2 18.9 34.7 17.0 35.2
Commerce 12.7 14.5 11.8 14.6 10.1 15.2 8.8 14.6
Other serv. 19.0 22.7 18.6 22.8 24.7 22.6 24.0 24.0
Tenure <=2yr. 25.2 14.7 23.0 13.8 32.3 18.6 33.6 17.9
Tenure 3-5 31.3 16.0 31.2 15.7 32.0 17.9 31.9 17.8
Tenure 6-10 22.9 20.6 27.2 20.4 19.2 21.2 21.5 21.4
Tenure 11-20 15.3 27.6 14.4 28.2 11.5 24.6 9.2 25.0
Tenure >20 5.3 21.1 4.2 21.9 5.0 17.7 3.8 17.7
Table A4: Distribution of past work history characteristics by gender, year, and
immigrant status
Men 2007 Men 2009 Women 2007 Women 2009 Variable Imm. Natives Imm. Natives Imm. Natives Imm. Natives
Worked <=5 yr. 8.5 5.7 6.1 5.1 16.0 9.5 14.0 8.9
Worked 6-10 14.5 10.3 15.8 10.0 18.2 13.5 20.7 12.9
Worked 11-20 38.0 29.4 38.2 28.5 32.0 31.1 29.9 30.9
Worked 21-30 29.7 35.2 29.3 35.8 24.6 30.7 25.3 31.6
Worked >30 9.3 19.4 10.6 20.6 9.2 15.2 10.1 15.7
Last yr. empl. 94.2 95.3 94.8 96.3 88.0 91.6 89.3 93.1
Last yr. slf-em. 19.1 27.1 17.3 27.2 12.1 15.4 9.7 15.6
Table A5: Other variables included in the propensity score specification
Description Quarter of the year
Student condition (still student, ended studies recently) Type of contract (temporary, part-time)
On-the-job search
More detailed industry classification