University of New Orleans University of New Orleans
ScholarWorks@UNO
ScholarWorks@UNO
University of New Orleans Theses and
Dissertations Dissertations and Theses
5-20-2005
Development of Mass Spectrometric Methods for the Analysis of
Development of Mass Spectrometric Methods for the Analysis of
Components and Complex Interactions in Biological Systems
Components and Complex Interactions in Biological Systems
Bryan Melvin Ham
University of New Orleans
Follow this and additional works at: https://scholarworks.uno.edu/td
Recommended Citation Recommended Citation
Ham, Bryan Melvin, "Development of Mass Spectrometric Methods for the Analysis of Components and Complex Interactions in Biological Systems" (2005). University of New Orleans Theses and Dissertations. 263.
https://scholarworks.uno.edu/td/263
This Dissertation is protected by copyright and/or related rights. It has been brought to you by ScholarWorks@UNO with permission from the rights-holder(s). You are free to use this Dissertation in any way that is permitted by the copyright and related rights legislation that applies to your use. For other uses you need to obtain permission from the rights-holder(s) directly, unless additional rights are indicated by a Creative Commons license in the record and/ or on the work itself.
DEVELOPMENT OF MASS SPECTROMETRIC METHODS FOR THE ANALYSIS OF COMPONENTS AND COMPLEX INTERACTIONS IN BIOLOGICAL SYSTEMS
A Dissertation
Submitted to the Graduate Faculty of the University of New Orleans in partial fulfillment of the requirements for the degree of
Doctor of Philosophy in
The Department of Chemistry
by
Bryan Melvin Ham
B.A., University of New Orleans, 1989
ACKNOWLEDGEMENTS
This dissertation is dedicated to my wonderful and lovely wife whose love and support
helped me through uncountable times of trials and testing to get to this final point. I also want to
dedicate this dissertation to my parents who have always been there for me through the many
years of my work and studies.
I would like to thank my advisor, Professor Richard Cole for his help, support, advice,
and his sense of student freedom to pursue directions and interest without which I could not have
achieved what I have.
I want to thank Professor Matthew Tarr, Professor Ronald Evilia, and Professor Zeev
Rosenzweig for being on my graduate committee and giving me helpful advice and very
insightful discussions concerning my projects. I also want to thank Professor Kevin Boyd for our
productive discussions concerning my work, Professor Guijun Wang for advice, Professor Edwin
Stevens for consultation and guidance, and finally Harry Reese for his time and expertise in
instrumental troubleshooting and repair.
I want to thank Professor Jean Jacob from the Louisiana State University Health Sciences
Center Department of Ophthalmology for being on my committee, for samples pertaining to my
research projects, and for extensive advice, guidance, and contributions to the interpretation of
the studies that I completed.
I would like to thank my friends Lingu Du for very helpful discussions concerning my
work, and Dr. Yuguang Ma for helpful discussions and friendship.
Finally, I would like to thank the group members I have worked with in my
Financial support was provided by The Louisiana Board of Regents through grant no.
TABLE OF CONTENTS
List of Tables………viii
List of Figures………..……….………...x
Abstract……….……….…xx
CHAPTER I: INTRODUCTION……….1
1.1 Objectives and aims………...1
1.2 Significance and impact……….1
1.3 Overview of high performance liquid chromatography (HPLC) and capillary zone electrophoresis (CZE)………4
1.4 Overview of electrospray triple quadrupole mass spectrometry (ES-MS-MS)……….6
1.5 Overview of matrix-assisted laser desorption ionization (MALDI) time-of-flight (TOF) mass spectrometry……….10
1.6 References………12
CHAPTER II: DETERMINATION OF RELATIVE BINDING CONSTANTS BETWEEN π -DELOCALIZED LYMPHANGITIC DYES AND AN ANTI-CANCER AGENT BY CATION EXCHANGE LIQUID CHROMATOGRAPHY AND AFFINITY CAPILLARY ELECTROPHORESIS………14
2.1 Introduction………..14
2.2 Experimental………16
2.3 Results and Discussion………17
2.4 Conclusions………..28
2.5 References………28
CHAPTER III: DETERMINATION OF BOND DISSOCIATION ENERGIES USING ELECTROSPRAY TANDEM MASS SPECTROMETRY AND A NOVEL DERIVED EFFECTIVE PATH LENGTH APPROACH………30
3,1 Introduction………..30
3.2 Experimental………32
3.3 Results and Discussion………32
3.4 Conclusions………..56
3.5 References………59
CHAPTER IV: DETERMINATION OF APPARENT THRESHOLD ENERGIES OF LITHIATED ACYLGLYCEROLS USING TANDEM MASS SPECTROMETRY AND A NOVEL DERIVED EFFECTIVE REACTION PATH LENGTH
APPROACH……….……….62
4.1 Introduction………..62
4.2 Experimental………63
4.3 Results and Discussion………65
4.4 Conclusions………..85
4.5 References………87
CHAPTER V: IDENTIFICATION, QUANTITATION AND COMPARISON OF MAJOR NON-POLAR LIPIDS IN NORMAL AND DRY EYE TEAR LIPIDOMES BY ES-MS-MS……….……….…91
5.1 Introduction………..91
5.2 Experimental………93
5.3 Results and Discussion………95
5.4 Conclusions………120
5.5 References………..122
CHAPTER VI: MALDI-TOF MS OF PHOSPHORYLATED LIPIDS IN BIOLOGICAL FLUIDS USING IMMOBILIZED METAL AFFINITY CHROMATOGRAPHY AND A SOLID IONIC CRYSTAL MATRIX………..126
6.1 Introduction………126
6.2 Experimental………..127
6.3 Results and Discussion………..129
6.4 Conclusions………153
6.5 References………..154
CHAPTER VII: IDENTIFICATION AND COMPARISON OF PHOSPHORYLATED LIPIDS IN NORMAL AND DRY EYE RABBIT TEARS BY MALDI-TOF MASS SPECTROMETRY………..156
7.1 Introduction………156
7.2 Experimental………..158
7.3 Results and Discussion………..161
7.4 Conclusions………179
7.5 References………..180
CHAPTER VIII: IDENTIFICATION AND COMPARISON OF RABBIT TEAR PROTEINS OF NORMAL VERSUS A DRY EYE MODEL BY MALDI-TOF MS………183
8.2 Experimental………..185
8.3 Results and Discussion………..188
8.4 Conclusions………212
8.5 References………..212
CHAPTER IX SUMMARY………216
LIST OF TABLES
Table 2.1 Binding constant values for the methylene green, methylene blue, and toluidine blue complexes with A007 by affinity capillary electrophoresis (ACE), and cation exchange chromatography (CEC)………..25
Table 3.1 Calculated (theoretical) BDE values, charges on Li+ or Cl-, and distances were obtained using the Becke-style 3-Parameter Density Functional Theory. The measured BDE values were extracted from the plotted results of cross sections versus center of mass energies, obtained by tandem mass spectrometry……….………53
Table 3.2 Comparison of the model fitted results for the low molecular weight lithium adduct standards versus the measured BDE calculated from growth curve multivariate regression models from the plotted results of cross sections versus center of mass energies, obtained by ES triple quadrupole tandem mass spectrometry. Parentheses represent uncertainties in the BDE values, in eV………...54
Table 4.1. % Total Ion Abundances, apparent threshold energies, and cross sections of high molecular weight product ions for the lithium adduct of 1-stearin,2-palmitin diacylglycerol ………72
Table 4.2. % Total Ion Abundance and apparent threshold energy for the lithium adduct of mono-pentadecanoin acylglycerol, 1-stearin,2-palmitin diacylglycerol, and 1,3-dipentadecanoin……….76
Table 4.3. % Total Ion Abundances, apparent threshold energy, and cross sections of high molecular weight product ions for the lithium adduct of 1,3-dipentadecanoin……….79
Table 5.1 Comparison of Quantitative Results of Normal and Dry Eye Tear Lipid
Extracts………120
Table 6.1 Comparative Study of the Major Phosphorylated Lipid Spectra Ions Observed for Six Different MALDI Matrices……….134
Table 6.2. Comparative Study of the Anionic Phosphorylated Lipids’ Major Spectral Molecular Ions Observed for the Six Different MALDI Matrixes (for abbreviations, see text. HG = head group)………...140
Table 7.1 A comparison of the phosphorylated lipids observed in normal and dry eye tears………..…………173
Table 7.2Lacrimal gland phosphorylated lipids………..175
LIST OF FIGURES
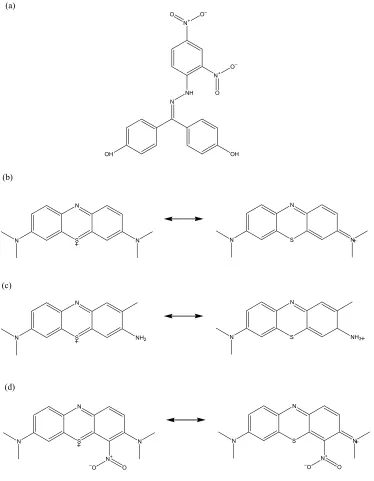
Figure 2.1 Structures of (a) 4,4’-Dihydroxybenzophenone-2,4-dinitrophenylhydrazone (A007), (b) methylene blue (MEB) double salt, (c) toluidine blue (TB) double salt, and (d) methylene green (MEG) double salt………15
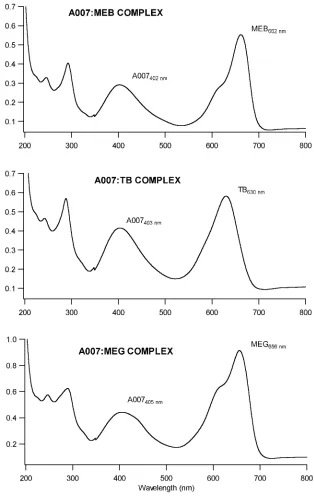
Figure 2.2 UV/Vis absorbance spectrums of A007:Dye complexes illustrating absorbance maximums of (a) 405 nm for A007, 662 nm for MEB, (b) 630 nm for TB, and (c) 656 nm for MEG………...19
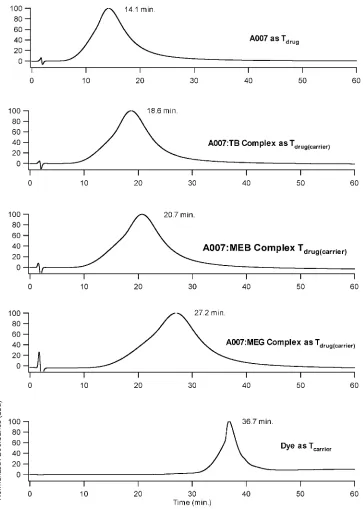
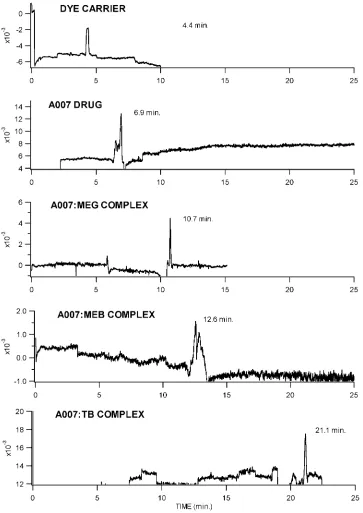
Figure 2.3 Typical CELC chromatograms of A007 (Tdrug) at 5x10⁻⁵ M A007, A007:TB Complex
(Tdrug(carrier)) at 5x10⁻⁵ M TB and A007, A007:MEB Complex (Tdrug(carrier)) at 5x10⁻⁵ M MEB and
A007, A007:MEG Complex (Tdrug(carrier)) at 5x10⁻⁵ M MEG and A007, and Dye
(Tcarrier)………...21
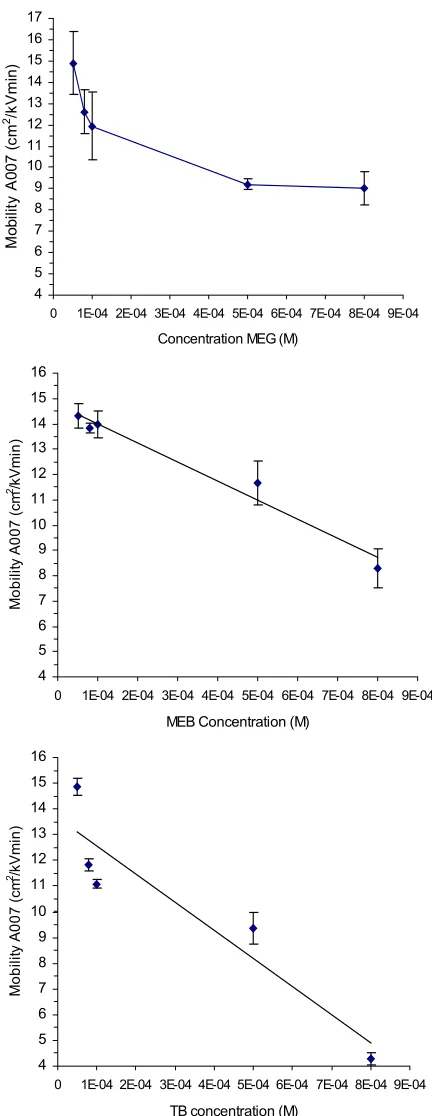
Figure 2.4 Plots of the mobility of A007 in increasing concentrations of methylene green, methylene blue, and toluidine blue………23
Figure 2.5 Electropherograms of (a) the three dyes (co-migration), (b) the anti-cancer agent A007, (c) A007:MEG complex, (d) A007:MEB complex, and (e) A007:TB complex……….26
Figure 3.1. CID product ion mass spectra of the lithium adduct of methanol (m/z 39) illustrating the appearance of the dissociation of the lithium cation (m/z 7, BDE = 1.596 eV12). (a) 0 eV, no detection of lithium, (b) emergence of the dissociated lithium cation at 0.50 eV (ECOM), and (c)
1.01 eV (ECOM).………..………35
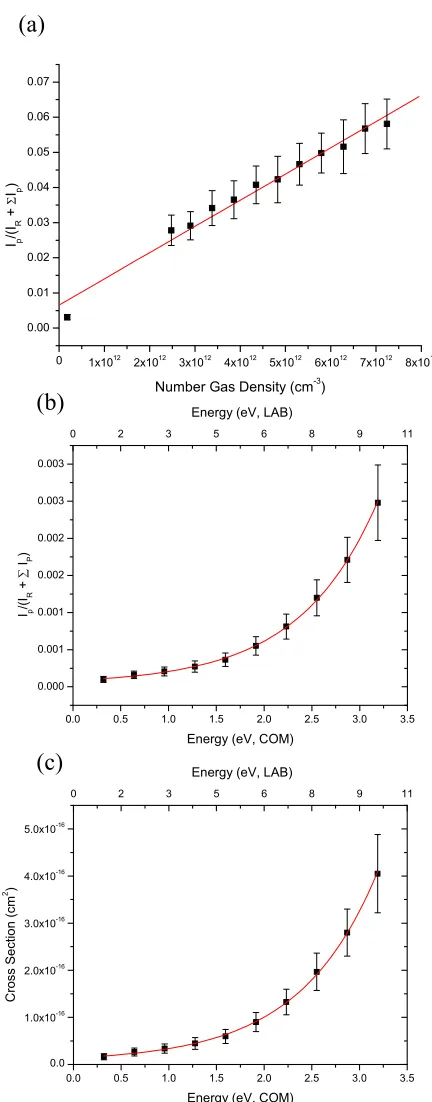
Figure 3.2. (a) Ratio of product ion abundances to incident ion abundances (the latter is approximated by (IR + ∑ IP)), versus number gas density for the lithium adduct of DMSO at
constant collision energy (ELAB = 10 eV). The slope of the curve is related to the product cross
section (σP) of the lithium-DMSO cationic complex according to the thin target limit as σP =
slope/l, (b) plotted results of IP/(IR + ∑ IP) ratio versus collision energy (ELAB, top) (ECOM,
bottom) for the dissociation of the DMSO-lithium adduct. The best fit gives an IP/(IR + ∑ IP)
ratio of 1.879 x 10⁻³,at 2.36 eV42, and a number gas density of 3.14 x 10¹², used in calculating a derived effective reaction path length, and (c) calculated cross sections for the DMSO-lithium cationic adduct employing the σP = slope/l relationship from Figure 3.2a and the proportional
changes of the IP/(IR + ∑ IP) ratios with collision energy in Figure 3.2b. Using the 2.36 eV BDE
value, the best fit of Fig. 3.2c gives a cross section value of 2.878 x 10⁻¹⁶ cm2 and, by the thin
target limit relationship, a path length of l = 2.08 cm.………...38
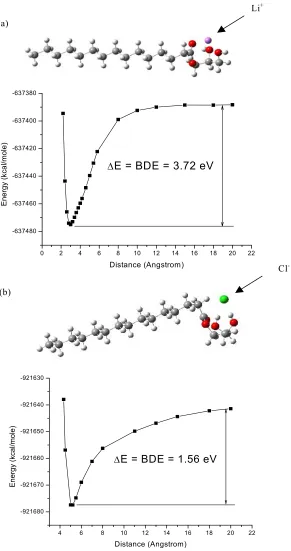
distance where the charge has reached unity for the adducted ion. The BDE was calculated to be 3.72 eV. (b) The monopentadecanoin chloride adduct. The chloride anion is between the 1-position and 2-1-position hydoxyl hydrogens, each at a distance of 2.18 angstroms. The BDE was calculated to be 1.56 eV.………40
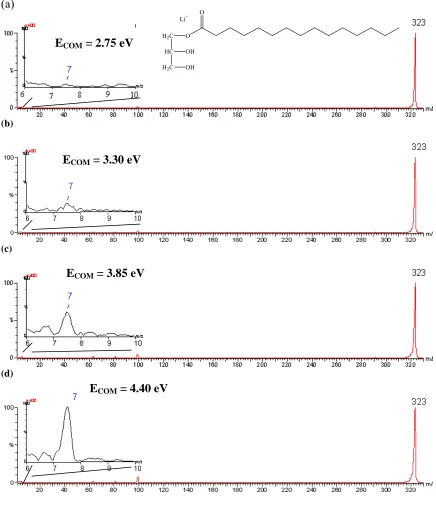
Figure 3.4. Product ion mass spectra illustrating the appearance of the lithium cation upon CID of the lithium-monopentadecanoin adduct near the threshold energy for dissociation. ECOM
energies: (a) 2.75 eV, (b) 3.30 eV, (c) 3.85 eV, threshold area, and (d) 4.40 eV……….……….43
Figure 3.5. Competitive fragmentation reactions in CID of product ion mass spectra of lithium-lipid adducts illustrating a contribution to error in the measurement of BDE’s. (a) Lithium adduct of monopentadecanoin in the reaction threshold range (3.85 eV ECOM). (b) Lithium adduct of
1-stearin,2-palmitin diacylglycerol at 3.10 eV (ECOM). (c) Lithium adduct of 1,3-dipentadeacoin at
3.74 eV (ECOM). All three show a considerable array of fragmentation
products………..45
Figure 3.6. (a) Plot of the ratio of abundances of the dissociated lithium cation to the total product ions (IP/(IR + ∑ IP), left y-axis) in an energy range that is approximately 3 times greater
than the expected dissociation threshold energy of 3.72 eV predicted by computer modeling. The reaction cross sections for the lithium adduct of monopentadecanoin, illustrated on the right y-axis, are calculated from the experimentally obtained ratios according to eq 1. The solid line is the best-fit of the experimental data using eq 6. The bond dissociation energy for CID of the lithium cation was experimentally determined to be 3.69 ± 0.29 eV (ECOM). The theoretical value
was calculated to be 3.72 eV. (b) Cross sections of the chloride adduct of monopentadecanoin. The bond dissociation energy was experimentally determined to be 1.65 ± 0.05 eV (ECOM) for
CID of the chloride anion. The theoretical value was calculated to be 1.56 eV………...………48
Figure 3.7. Cross section vs collision energy for: (a) the lithium adduct of 1-stearin,2-palmitin diacylglycerol, with a growth curve model predicted BDE of 3.59 ± 0.18 eV (theoretical predicted value: 3.98 eV), (b) the chloride adduct of 1-stearin,2-palmitin diacylglycerol, with a
growth curve predicted BDE of 1.26 ± 0.03 eV (theoretical predicted value: 1.37
eV)……….………49
Figure 3.8. Cross section vs collision energy for: (a) the lithium adduct of 1,3-dipentadecanoin diacylglycerol, with a growth curve model predicted BDE of 3.78 ± 0.39 eV (theoretical predicted value: 3.52 eV), (b) the chloride adduct of 1,3-dipentadecanoin diacylglycerol, with a
growth curve predicted BDE of 1.63 ± 0.23 eV (theoretical predicted value: 1.48
eV)……….……….50
Figure 3.9. Cross section vs collision energy for: (a) the lithium-bound monopentadecanoin dimer. The BDE of 1.43 ± 0.04 eV (ECOM), for dimer dissociation was obtained from the
curve model yielded a dissociation energy of 1.43 ± 0.01 eV, (c) the lithium-bound
1-stearin,2-palmitin diacylglycerol dimer, yielding a BDE value of 1.38 ± 0.01 eV.……….57
Figure 3.10. Ratio of MLi+ to (MLi+ + M2Li+) for the CID of lithium-bound dimers of: (a)
monopentadecanoin. The BDE extracted from the point of 50% dissociation gives a value of 1.31 ± 0.32 eV ECOM (exponential growth curve model predicted 1.43 ± 0.04 eV). (b)
1,3-dipentadecanoin. At 50% dissociation, the BDE was measured to be 0.90 ± 0.09 eV (growth curve model predicted 1.43 ± 0.01 eV). (c) 1-stearin,2-palmitin diacylglycerol with a 50% dissociation energy value of 1.16 ± 0.07 eV (growth curve model predicted 1.38 ± 0.01 eV).………..………..58
Figure 4.1. (a) Product ion spectrum of the collision activated monopentadecanoin lithium adduct, collected at 40 eV (Lab). Major fragments produced: (1) m/z 99 from the neutral loss of C15 fatty acyl chain as ketene, producing lithiated glycerol, (2) m/z 81 produced by water loss from m/z 99, (3) m/z 63 produced by two water losses from m/z 99, and (4) m/z 57 formed by loss of LiOH from m/z 81, and from part of the CnH2n+1+ hydrocarbon series from the fatty acid
acyl chain. (b) Fragmentation pathways, structures, apparent threshold energies, and % Total Ion Abundance for the four major product ions formed from CID of lithiated mono-pentadecanoin. The m/z 99 ion is the result of the neutral loss of C15 fatty acyl chain as ketene from the precursor ion, and is the most abundant ion in the spectrum, at an apparent threshold energy of 2.87 ± 0.14 eV (ECOM). The m/z 81 and m/z 63 ions are produced from one water loss, then two
water losses, respectively. The m/z 81 ion has the lowest threshold energy at 1.74 ± 0.27 eV (ECOM). The m/z 57 ion is formed primarily by LiOH loss from the m/z 81 ion………..67
Figure 4.2. Energy-resolved breakdown graph for the dissociation of the lithiated mono-pentadecanoin diacylglycerol. The % Total Ion Abundances are very low due to collection under single collision conditions. The precursor % Total Ion Abundance is included in the plot to illustrate the small percentage losses during these experiments. % Total Ion Abundances appears to follow the trend of m/z 99 > m/z 81 > m/z 63 > m/z 57………69
Figure 4.3. (a) Product ion spectrum of the collision induced dissociation of lithiated 1-stearin,2-palmitin diacylglycerol, at collision energy of 50 eV (Lab). Lower molecular weight fragment ions appear from approximately m/z 43 to m/z 123, primarily representing the hydrocarbon series CnH2n+1+ from σ-bond fatty acyl chain cleavage. Higher molecular weight product ions
ranging from m/z 257 to m/z 365 produced from single cleavage reactions of fatty acyl loss in several forms (fatty acyl chain as ketene, lithium fatty acetate, and fatty acid). (b) Fragmentation pathways, structures, apparent threshold energies, and % Total Ion Abundance for the high molecular weight range product ions produced from the CID of 1-stearin,2-palmitin, ranging from m/z 257 to m/z 365. Paired products include the neutral loss of C18 and C16 lithium fatty acetate at m/z 313 and m/z 341, and neutral loss of C18 and C16 fatty acid at m/z 319 and m/z 347. M/z 365 is formed by the neutral loss of C16 fatty acyl chain as ketene. Fragmentation ranking of: loss of lithium fatty acetate > loss of fatty acid > loss of fatty acyl ketene…………71
product ion intensity in a similar pattern for increasing collision energy. (b) The lower molecular weight product ions from CID of 1-stearin,2-palmitin. Peak series m/z 43, m/z 57, m/z 71, m/z 85, m/z 99 result from alkyl chain fragmentation through σ-bond cleavage of the fatty
acid hydrocarbon chains producing the series CnH2n+1+………74
Figure 4.5. (a) Product ion spectrum of the collision induced dissociation of lithiated 1,3-dipentadecanoin, collected at 60 eV (ELAB). Low molecular weight product ions ranging from
m/z 29 to m/z 99 expressed by the hydrocarbon series CnH2n+1+ produced from σ-bond fatty acyl
chain cleavage. Higher molecular weight range of m/z 249 to m/z 323 produced from single cleavage reactions of fatty acyl loss in several forms (fatty acyl chain as ketene, lithium fatty acetate, and fatty acid). (b) Fragmentation pathways, structures, apparent threshold energies, and % Total Ion Abundance for the high molecular weight range product ions produced from the CID of 1,3-dipentadecanoin, ranging from m/z 249 to m/z 323. Neutral loss of fatty acyl chain as ketene at m/z 323 contains the highest abundance, and lowest threshold energy. This is followed by neutral loss of lithium fatty acetate at m/z 299, then neutral loss of the fatty acid at m/z 305. Fragmentation ranking of: loss of fatty acyl ketene > loss of lithium fatty acetate > loss of fatty acid. The m/z 289 product ion is produced from the consecutive neutral losses of H2O followed
by C15:1 alpha-beta unsaturated fatty acid………77
Figure 4.6. Breakdown graphs for: (a) high molecular weight product ions produced from CID of dipentadecanoin, and (b) low molecular weight product ions produced from CID of 1,3-dipentadecanoin. M/z 57 product ion is the favored fragmentation pathway due to joint production by glycerol backbone water loss, and fatty acyl chain hydrocarbon cleavage. M/z 43 product ion rapidly increases, as the collision energy is increased, produced from σ-bond cleavage of the fatty acyl hydrocarbon chain and the glycerol backbone [C2H3O]+, appearing to
be a favored pathway at increasing collision energies………...80
Figure 4.7. Energy diagrams for: (a) production of the m/z 63, 81, and 99 product ions for the monopentadecanoin lithium adduct, (b) production of the m/z 323 product ion (-0.42 eV, ECOM)
from the 1,3-dipentadecanoin lithium adduct. Included in the diagram is the further production of the m/z 63, 81, and 99 product ions from the m/z 323 precursor ion, where energy values have been normalized setting –0.42 eV to a zero energy ground state……….82
Figure 4.8. Proposed pathway for the direct production of the m/z 81 product ion from the m/z 323 precursor ion………...84
Figure 4.9. Ratio plots of m/z 57, 63, and 81 to m/z 99 for: (a) monopentadecanoin lithium adduct, (b) 1-stearin,2-palmitin diacylglycerol lithium adduct, and (c) 1,3-dipentadecanoin lithium adduct……….………...86
step-wise initial “in-source” loss of ketene, followed by LiOH, in addition to production of m/z 299 from the loss of the lithium fatty acetate from m/z 547. Positive mode ES-MS/MS product ion spectra of: (d) monopentadecanoin m/z 323, and (e) palmityl behenate m/z 571……….…98
Figure 5.2 Major fragment ions produced from the collisionally induced dissociation of triheptadecanoin m/z 855 [MLi]+: the C17:0 acylium ion at m/z 253 [C17H33O]+, the lithium
adduct of heptadecanoic acid at m/z 277 [C17H34O2Li]+, the neutral loss of heptadecanoic acid,
then the neutral loss of a C17:1 alpha-beta unsaturated fatty acid, to give the m/z 317 product ion [MLi - C17H34O2 - C17H32O2]+, the parent ion minus lithiated heptadecanoate at m/z 579 [MLi –
C17H33O2Li]+, and the parent ion minus the neutral loss of heptadecanoic acid at m/z 585 [MLi –
C17H34O2]+………101
Figure 5.3 Major fragment ions produced from the collisionally induced dissociation of 1,3-dipentadecanoin m/z 547 [MLi]+: the parent ion peak minus the neutral loss of C15:0 fatty acyl chain as ketene at m/z 323 [MLi – C15H28O]+, the neutral loss of C15:0 lithium fatty acetate at
m/z 299 [MLi – C15H29O2Li]+ (major path), or the loss of C15:0 fatty acyl chain as ketene from
the parent ion followed by LiOH at m/z 299 [MLi - C15H28O - LiOH]+ (minor path), the neutral
loss of C15:0 fatty acid at m/z 305 [MLi - C15H30O2]+, the consecutive losses of H2O followed by
C15:1 alpha-beta unsaturated fatty acid at m/z 289 [MLi - H2O - C15H28O2]+, and the lithiated
fatty acid ion, pentadecanoic acid, at m/z 249 [C15H30O2Li]+……….102
Figure 5.4 Major fragment ions produced from the collisionally induced dissociation of monopentadecanoin m/z 323 [MLi]+: the major ion at m/z 99 is the glycerol backbone derived from the neutral loss of the C15:0 fatty acyl chain as a ketene from the parent ion [MLi – C15H28O]+, and the m/z 81 and m/z 63 are the subsequent losses of one, and then two H2O
molecules from the lithiated glycerol backbone………..103
Figure 5.5 (a) Product ion spectrum of 1-stearin-2-palmitin standard at m/z 603. The greater intensity of the m/z 313 vs. m/z 341 allows the identification of the 1- position of the 1,2-diglyceride. (b) Major fragment ions produced from the collisionally induced dissociation of 1-stearin-2-palmitin diacylglycerol m/z 603 [MLi]+: the m/z 313 ion from the neutral loss of C18:0
lithium fatty acetate (1- position), [MLi – C18H35O2Li]+, the ion at m/z 341 from the neutral loss
of C16:0 lithium fatty acetate (2- position), [MLi – C16H31O2Li]+, the m/z 365 ion from the loss
of the C16:0 fatty acyl chain as ketene [MLi - C16H30O]+, the neutral loss of C16:0 fatty acid at
m/z 347 [MLi - C16H32O2]+, the neutral loss of the C18:0 fatty acid at m/z 319 [MLi -
C18H36O2]+, the lithium adducts of stearic acid at m/z 291 [C18H36O2Li]+, the lithium adduct of
palmitic acid at m/z 263 [C16H32O2Li]+, and protonated stearic and palmitic acids at m/z 285
[C18H36O2H]+, and m/z 257 [C16H32O2H]+, respectively……….105
Figure 5.7 General scheme for distinguishing asymmetric 1,2-diglycerides, and 1,2-diglycerides from 1,3-diglycerides based upon MS/MS decompositions of lithium adducts. (a) Illustrates the usage of product ion abundances for determining substituent location within an asymmetric 1,2-diglyceride. Loss of R1 substituent as lithium fatty acetate is greater than the R2 loss. Indicative of 1,2-diglycerides is that neutral losses of lithium fatty acetates are the predominant product ions. Bottom half of panel (a) shows that losses of fatty acyl ketenes are minor product ions. Top half of panel (b) illustrates that the neutral losses of the R1 or the R3 substituent as fatty acyl ketenes are observed for the 1,3-diglyceride isomer, and these are the major product ions. Bottom part of panel (b) illustrates that the 1,3-diglyceride has a fragmentation pathway which results in the neutral loss of H2O with subsequent loss of an alpha-beta unsaturated fatty acid.
This fragmentation pathway is not observed for the 1,2-diglycerides……….108
Figure 5.8 Typical single stage MS positive mode ES scans of the lithium adducts of extracted compounds, including the spiked internal standards (IS) of: (a) normal rabbit tear extract, and (b) dry eye rabbit model tear extract. The internal standards include: 3.65x10⁻⁵ mg/µL
monopentadecanoin at m/z 323, 4.35x10⁻⁵ mg/µL dipentadecanoin at m/z 547, 4.8x10⁻⁵ mg/µL palmityl behenate at m/z 571, and 5.2x10⁻⁵ mg/µL triheptadecanoin at m/z 855………110
Figure 5.9 Positive mode ES tandem mass spectra illustrating informative fragment ions used for identification of: (a) the m/z 365 lipid lithium adduct, identified as monostearyl glyceride, (b) the m/z 575 lipid lithium adduct, identified as 1,3-dipalmitin diglyceride being the major component, with a minor 1-stearin,3-myristin constituent, and a minor 1-myristin,2-stearin constituent, (c) the m/z 603 lithium adduct identified as 1-stearyl,3-palmityl diglyceride, and (d) the m/z 631 lithium adduct identified as 1,3-distearin acylglyceride………..114
Figure 5.10 (a) Expanded mass axis of the triester spectral region (m/z 850 to m/z 970) of normal tear extract lithium adducts illustrating the occurrence of mixed dimers, and low concentrations of triacylglycerols present in the extract. (b) Product ion spectrum with peak assignments of informative product ions of the m/z 897 precursor identified as an isomeric mixture of tristearin and 1-arachidin,2-stearin,3-palmitin………116
Scheme 6.1. Synthesis of the solid ionic crystal matrix for MALDI………..………….128
Figure 6.1. Structures of the main phosphorylated lipids included in this study. The left side lists the neutral, polar, zwitterionic phosphorylated lipids. The right side lists the anionic phosphorylated lipids as their neutral sodium adducts……….………...130
Figure 6.2. Ionic liquid matrixes used for improved shot-to-shot reproducibility, and a reduction in fragmentation induced by MALDI. (a) 2,5-dihydroxybenzoic acid butylamine, (b) alpha-cyano-4-hydroxycinnamic acid butylamine, and (c) 3,5-dimethoxy-4-hydroxycinnamic acid triethylamine………132
Figure 6.3. Comparison of the six MALDI matrixes for the analysis of phosphatidylethanolamine in positive ion mode. (a) DHB matrix showing predominant sodium adduct peak [PE+Na]+ at
adduct at m/z 714, but significant head group loss at m/z 551 observed, and a minor [PE+H]+ peak at m/z 692. (c) PNA matrix shows no appreciable signals for sodium adducts or protonated molecules. (d) PNA plus TFA producing [PE+H]+ at m/z 692, but major peaks for neutral losses of head group components at m/z 551, and m/z 605 are also observed. (e) PNA-butyric acid solid ionic crystal matrix producing predominantly the [PE+H]+ ion at m/z 692 with only very minor amounts of the sodium adduct at m/z 714, and few fragment ions. (f) PNA-butyric acid plus TFA matrix producing the [PE+H]+ ion at m/z 692 as a major spectral peak, but also significant head group loss ions at m/z 551 and m/z 565………136
Figure 6.4. (a) MALDI-TOF mass spectrum of the para-nitroaniline/butyric acid matrix preparation illustrating the low mass region of the mass spectrum and showing background peaks originating from the matrix. (b) MALDI-TOF mass spectrum of a two-component mixture of lyso PC and DMPC standards showing protonated lyso PC at m/z 496, and protonated DMPC at m/z 678, using the PNA-butyric acid matrix………...138
Figure 6.5. (a) MALDI-TOF mass spectra acquired using the PNA-butyric acid matrix: (a) PG showing [PG+Na]+ at m/z 771, and [PG+2Na-H]+ at m/z 793, (b) PS displaying [PS+Na]+ at m/z 784, and [PS+2Na-H]+ at m/z 806, and (c) PA showing [PA+Na]+ at m/z 697, and [PA+2Na-H]+
at m/z 719……….142
Figure 6.6. PSD spectra of: (a) phosphatidylserine [PS+NA]+ precursor ion at m/z 784, and (b)
phosphatidylserine [PS+2Na-H]+ precursor ion at m/z 806………144
Figure 6.7. PSD spectra of: (a) phosphatidic acid [PA+NA]+ precursor ion at m/z 697, (b)
phosphatidic acid [PA+2Na-H]+ precursor ion at m/z 719………..146
Figure 6.8.PSD spectra of: (a) lyso 1-palmitoyl choline (lyso-PC) [LysoPC+H]+ precursor ion at m/z 496, and (b) dimyristyl phosphatidylcholine (DMPC) [DMPC+H]+ precursor ion at m/z 678………147
Figure 6.9. PSD spectra of: (a) 1-palmitoyl-2-oleoyl-sn-glycero-3-[phospho-rac-(1-glycerol)]
(POPG) [POPG+Na]+ precursor ion at m/z 771, and (b) [POPG+2Na-H]+ precursor ion at m/z 793………...149
Figure 6.10. Recovery of a four-component phosphorylated lipid standard mixture using the
IMAC ZipTipMC. Protonated lyso phosphatidylcholine at m/z 496, protonated dimyristyl
phosphatidylcholine at m/z 678, protonated dipalmitoyl phosphatidylethanolamine at m/z 692, and protonated sphingomyelin at m/z 731………...151
Figure 6.11. MALDI-TOF mass spectra of the tear total chloroform extractables collected: (a) without the use of the IMAC ZipTipMC cleanup method, and (b) with the use of the IMAC
ZipTipMC cleanup prior to spectral acquisition………152
second series is comprised of sphingomyelins, and appears to play a role in dry eye response. The m/z 577 lipid is a 16:0-7:1 SM, the m/z 605 lipid is a 16:0-9:1 SM, the m/z 621 lipid is an oxidized 16:0-9:1 SM, the m/z 637 lipid is an oxidized 16:0-9:1 SM, and the m/z 659 lipid is a 16:0-13:2 SM………...163
Figure 7.2. Assigned structures of the major phosphorylated lipids observed in the tear extracts: (a) oxidized phosphatidylcholine, (b) platelet activation factor, (c) sphingomyelin, (d) phosphatidylserine, and dimyristyl phosphatidylcholine……….165
Figure 7.3. MALDI-TOF spectra of (a) normal eye tear, and (b) dry eye tear phosphorylated lipids. Some tear samples can contain very low levels of the polar phosphorylated lipids, as is illustrated in the normal eye spectrum (a). Note that the dry eye model expression spectrum in (b) contains the sphingomyelin series m/z 605, 621, 637, and 659. Also observed in the dry eye spectrum (b) is dimyristoyl phosphatidylcholine at m/z 678………...166
Figure 7.4. MALDI-TOF spectra of (a) normal eye tear, and (b) dry eye tear phosphorylated lipids. Both spectra contain the PAF series m/z 494, 522, and 550. Also observed in both spectra are the 16:0-5:0 oxidized PC m/z 610 and m/z 642 species. The expression of the m/z 610 and 642 species is slightly more pronounced in the dry eye spectrum………...168
Figure 7.5. MALDI-TOF spectra of (a) normal eye tear, and (b) dry eye tear phosphorylated lipids. The normal tear is observed to have a more pronounced expression of the PAF m/z 522, and 550 species. Two serine lipids are observed in the dry eye model tear: m/z 828 (16:0-20:4 phosphatidylserine), and m/z 886 (18:0-22:3 phosphatidylserine)………..169
Figure 7.6. MALDI-TOF spectra of (a) normal eye tear, and (b) dry eye tear phosphorylated lipids. The normal eye spectrum (a) contains a small amount of the m/z 637, and 659 sphingomyelin lipid species. The dry eye model in spectrum (b) shows an increased expression in this series, possibly indicating involvement in the dry eye model tear expression. A previously unobserved envelope of peaks ranging from m/z 720 to m/z 1086 is illustrated in the dry eye model spectrum (b), but have not been identified….………..170
Figure 7.7. MALDI-TOF spectra of (a) normal eye tear, and (b) dry eye tear phosphorylated lipids. Expression of the m/z 494, 522 and 550 PAF lipid species, and the sphingomyelin related species, are observed in the dry eye model spectrum of 6b. The normal eye’s expression illustrated in the 6(a) spectrum is quite different from that of the dry eye spectrum. DMPC lipid at m/z 678 expressed greater in the normal eye spectrum than in the dry………171
Figure 7.8. MALDI-TOF spectrum of the lacrimal gland phosphorylated lipids………174
Figure 8.1. 1D SGS-PAGE gel results of a comparison of rabbit normal eye tear versus the dry eye model tear proteins………189
Figure 8.2. Calibration plot used for the molecular weight determinations constructed from the
Figure 8.3. Calibration curve illustrating the linear working range used to quantitate the proteins in both the normal, and the dry eye model tear fluid………...193
Figure 8.4. (a) MALDI-TOF spectrum of a lysozyme (14376 Da) standard collected using a standard, non-coated Voyager plate with a S/N ratio of 7:1. (b) Lysozyme protein standard spectrum collected using a wax coated plate with a S/N ratio of 65:1. A decrease in dimmerization is observed at m/z 28.8 kDa……….196
Figure 8.5. (a) MALDI-TOF spectrum of carbonic anhydrase (29024 Da) standard collected using a non-coated plate with a S/N ratio of 12:1. (b) Carbonic anhydrase protein standard spectrum collected using a wax coated plate with S/N ratio of 135:1……….197
Figure 8.6. (a) MALDI-TOF spectrum of BSA (33216 Da and 66431 Da) standard collected using a non-coated plate. The S/N ratio for the 33 kDa peak is 10:1 and S/N ratio for 66 kDa peak is 15:1. (b) BSA spectrum collected using wax coated plate. The S/N ratio for the 33 kDa peak is 39:1 and S/N ratio for 66 kDa peak is 158:1……….………..198
Figure 8.7. Comparison of tear protein MALDI-TOF spectral response enhancement using a wax coated Voyager plate. (a) Tear protein spectrum collected using an un-coated plate. (b) Tear protein spectrum collected using a wax coated plate……….………..200
Figure 8.8. MALDI-TOF spectra of: (a) normal eye tear proteins, and (b) dry eye tear proteins. The bottom dry eye MS spectrum shows an increase in the 10 kDa lipophilin CL2 protein, and a decrease in both the 14 kDa protein, and the 16 kDa lipophilin protein……….202
Figure 8.9. PSD spectrum of an m/z 1756 peptide obtained from band 1 in the 1D SDS-PAGE gel, identified as the lipophilin CL2 protein at 10,456 Da………..203
Figure 8.10. MALDI-TOF spectra of: (a) normal eye tear proteins, and (b) dry eye tear proteins. The top normal eye spectrum contains a strong peak at 17 kDa which is probably lipocalin. The bottom dry eye tear protein spectrum shows a predominant peak at 29 kDa which may be an apo protein such as apoD, or something related to the VDAC-1 30.7 kDa protein that was identified in the tear fluid……….204
Figure 8.11. MALDI-TOF spectra of: (a) normal eye tear proteins, and (b) dry eye tear proteins. The bottom dry eye MS spectrum shows an increase in the 17 kDa lipocalin protein, and a decrease in both the 11 kDa lipophilin protein, and the 30 kDa apoD or VDAC-1 protein………..205
Figure 8.12. MALDI-TOF spectra of: (a) normal eye tear proteins, and (b) dry eye tear proteins. The bottom dry eye MS spectrum shows an increase in the 14 kDa protein………..207
Figure 8.14. MALDI-TOF spectra of: (a) normal eye tear proteins, and (b) dry eye tear proteins. The bottom dry eye MS spectrum shows an increase in both the 10 kDa lipophilin CL2 protein, and the 17 kDa lipocalin protein……….209
Figure 8.15. (a) Single stage spectrum of the normal eye peptides. (b) Single stage spectrum of the dry eye peptides……….210
ABSTRACT
The anti-cancer agent 4,4-dihydroxybenzophenone-2,4-dinitrophenylhydrazone (A007)
forms complexes with π-delocalized lymphangitic dyes that allow its penetration through the
skin effectively delivering it to a meta-stable type cancerous site. Previous in vitro studies,
combined with gas phase mass spectrometry studies, have shown that a stronger binding affinity
equates to a greater efficacy of the drug. For the determination of drug:dye complex binding
strength coefficients in solution, two methods have been developed by affinity capillary
electrophoresis (ACE), and cation exchange liquid chromatography (CELC). The methods
demonstrated that A007 non-covalent binding strength was greatest for methylene green,
followed by methylene blue, and lastly toluidine blue.
Bond dissociation energies and apparent reaction enthalpies for the fragmentation
pathways of lithiated acylglycerols were experimentally determined by collision activation in a
triple quadrupole mass spectrometer. A developed novel derived effective path length approach
for predicting bond dissociation energies (BDE) for electrostatic complex’s alkali metal adducts
(Li+), and halide adducts (Cl-) of acylglycerols was applied to the major fragmentation product
ions of a lithiated mono-acylglycerol, a 1,2-diacylglycerol, and a 1,3-diacylglycerol, to predict
the covalent bond dissociation energies involved in fragmentation pathways. The model’s
calculated apparent reaction enthalpies are used in conjunction with the energy-resolved mass
spectrometry method of breakdown graphs to give a more complete quantitative aspect to the
interpretation of the fragmentation processes.
The dry eye condition affects millions of individuals world wide. The symptoms can be a
using rabbits in order to study the compositional makeup of the tear components in hopes of
identifying an underlying cause, or expressed effect of the dry eye condition. The major
non-polar lipids of the tear were identified by mass spectrometry as mono and diacylglycerols, with a
smaller extent of triacylglycerols. The major polar phosphorylated lipids were identified in the
tear extract revealing that sphingomyelin based species were being expressed in the dry eye
condition. The major proteins were determined to be the lower molecular weight lipid binding
proteins where two specific species were found to increase in expression for the dry eye
CHAPTER I: INTRODUCTION
1.1 Objectives and Aims
Previous work in measuring and identifying biological compounds from complicated
extracts has had difficulty in the ability to achieve detection, identification and quantitation of
the low nano to picogram levels that are found in tears. Also, specialized mass spectrometers that
are not readily available to most laboratories are typically used for complex biological compound
interactions. Therefore, the main objective of my work was to develop new and improved mass
spectrometric methods for the measurement of biological compounds and their complex
interactions using common mass spectrometer instrumentation. The specific aims of my work
were to develop advanced mass spectrometric methodology for: a) the measurement of complex
biological interactions in the solution-phase, b) the measurement of complex biological
interactions in the gas-phase c) the identity and comparison of nonpolar and polar lipids in a
rabbit dry eye tear model, and d) the identity and comparison of the major proteins in a rabbit dry
eye tear model.
1.2 Significance and Impact
The use of mass spectrometry has become a powerful analytical tool for gas phase
thermochemistry studies, for structural elucidation of organic compounds, and for composition
studies of complex biological samples. The high sensitivity of mass spectrometers has also
allowed the measurement of biological extracts that contain very low levels of the analytes of
interest such as tear film extracts. Previous investigations into molecular changes in tear film
undergo analytical methods such as one- or two-dimensional electrophoresis. Another problem is
the requirement that the tear components be derivatized before they are subjected to gas
chromatography, mass spectrometry, or both. Finally, the total chloroform extract of the tear
layer constitutes a complex mixture of biological compounds that includes non-polar and polar
lipids and some lipoproteins. The polar lipid components make up a very small fraction of the
total extract, rendering their analysis difficult by mass spectrometry alone. Therefore, there is a
need to develop new methodology that combines optimized sample pretreatment in conjunction
with mass spectral instrumental analysis. In response to this, we have developed methodologies
for enhanced lipid and protein analysis that includes sample pretreatment such as clean-up
chromatography, cationizing agents, washing solutions, wax plating MALDI Voyager plates, and
enhanced MALDI matrices. The methodologies that have been developed have generated
significant improvements such as increased sensitivities, enhanced signal responses, and lower
detection limits.
The study of noncovalent bond dissociation energies by mass spectrometry has been
investigated for well over 25 years, generating very accurate and reliable values. However, the
type of mass spectrometer used is highly specialized and not readily accessible to most research
laboratories, and is primarily limited to small molecular weight systems such as solvent/metal
adducts. In response to this, we have developed a mass spectrometric method for the
measurement of bond dissociation energies for both small molecular weight systems such as
solvent/metal adducts, and larger molecular weight systems such as lipid/metal adducts. We have
also extended the method to calculate “covalent” bond dissociation energies as well as
methodology in effect enables a broader scope to the measurement of dissociation energies by
mass spectrometry that is more accessible to researchers.
The analysis of the components of tears has been reported upon for more than 40 years
primarily using methods that required compositing samples, special pretreatment of samples, and
were not as sensitive as that needed for very low levels of analytes. With the advancements in
mass spectrometric instrumentation, ionization sources, and preparation techniques, there has
been a tremendous growth in applications towards the analysis of complex biological samples.
However, there are still many obstacles that are encountered when analyzing these complex
biological samples. For the tear composition studies, these included very low levels of lipids in
the nano to picogram levels that were suffering from suppression from other analytes present,
and proteins that have been challenging to compare a normal to a diseased state expression. The
developed methodology presented here shows for the first time the observance of single lipid
species in the tear thus allowing the observance of an expression differential. The developed
methodology has also allowed an expression study differential to be observed with the tear
proteins. These studies may be able to identify causes to, or signaling agents of the dry eye
diseased state.
In order to fully understand the results presented in Chapters III through VIII, it is
necessary to be familiar with some of the basic concepts of the applied methodologies used in
each study. Therefore, the following sections provide a brief introduction and overview of the
1.3 Overview of High Performance Liquid Chromatography (HPLC) and Capillary Zone
Electrophoresis (CZE)
High performance liquid chromatography (HPLC), and capillary zone electrophoresis
(CZE) are two analytical separation techniques that have been used as individual approaches for
compound separations, and as complimentary approaches. HPLC is a separation technique that
utilizes a compound’s affinities for either a stationary phase, or a mobile phase, in order to
perform a chromatographic separation. In reverse phase HPLC (RP-HPLC), typically the
stationary phase is composed of a long chain non-aromatic, aliphatic hydrocarbon (e.g. C18, for
an 18-carbon chain) that is covalently bound to silica or polymer beads packed into a cylinder
stainless steel tube. The mobile phase typically consists of mixtures of H2O, methanol (MeOH),
and acetonitrile (ACN) that are all three completely miscible in all molar fraction ratios. The
sample is loaded onto the C18 column with a high H2O ratio in the mobile phase where the
affinity of organic compounds are greatest for the C18 stationary phase. The mobile phase is
changed in a gradient fashion where the organic solvent (MeOH or ACN) is gradually increased.
The affinity for the organic molecules now increases in the mobile phase which helps to carry
them along through the column. The separation of the individual organic constituents now takes
place due to their different affinities for the stationary and mobile phases.
Strong ion exchange high performance liquid chromatography works upon similar
principles as RP-HPLC, except that the compound of interest now has a strong ionic,
electrostatic, non-covalent affinity for the stationary phase. This approach works well for
compound that posses a permanent charge such as an acid in basic solution, or a base in acidic
solution. Strong cation exchange high performance liquid chromatography (SCEX-HPLC) uses
permanent positive charges. Due to the aromatic backbone of strong cation exchange stationary
phases, there is also a slight reverse phase interaction that can also take place. For the
chromatographic elution of the compound of interest from the strong cation exchange column,
typically a salt gradient is used which displaces the analyte from the poly-sulfonic acid stationary
phase.
Capillary zone electrophoresis (CZE) is another very useful separation technique which
has traditionally been applied primarily to analytes of interest which also posses a permanent
charge, just as is the case with strong ion exchange chromatography. Unlike liquid
chromatography, capillary zone electrophoresis does not separate analytes according to their
respective affinities for mobile and stationary phases, rather the separation is achieved based off
of analytes electrophoretic mobilities in an electric field. In positive mode electrophoresis,
positively charged analytes move from the anodic (positive electrode) region of the separation
phase, to a cathodic (negative electrode) region of the separation phase, through a narrow bore,
short fused silica tube. In general, small highly charged analytes have the greatest mobilities,
followed by higher molecular weight similarly charged analytes, followed by neutrals, which
travel through the separation capillary due to a phenomenon known as electroosmotic flow
(EOF), and lastly, oppositely charged ions. The forces acting upon the analytes are vectors,
therefore they are additive, and result in the separation of analytes based upon their mass to
charge ratios. Electroosmotic flow results from bulk movement of the separation phase through
the fused silica capillary due to the charged silano groups of the fused silica wall. EOF can be
influenced through pH changes (high pH produces deprotonated, charged silano groups resulting
in higher EOF, while low pH results in protonated silano groups thus decreasing EOF), organic
also through neutral coating of the fused silica wall such as with polymers, which can reduce or
eliminate EOF.
Since its early introduction(1-4), capillary zone electrophoresis is an analytical technique
that has become an indispensable tool in many modern laboratories, especially in the
pharmaceutical industry(5). The application of capillary electrophoresis to the study of
complexes, known as affinity capillary electrophoresis (ACE), has recently experienced a large
growth. This methodology has been used to study the electrophoretic mobility and separation of
various complexes(6), complex electrostatic interactions(7), complex binding and disassociation
constants(8,9), and complex stoichiometry(10). In most studies, affinity CE ideally involves the
measurement of a complex that stays bound throughout the electrophoretic separation(11). The
complexes that were evaluated by this study involve a purely electrostatic binding between the
dye carrier compound, and the anti-cancer agent A007, which have estimated high disassociation
constants.
1.4 Overview of Electrospray Triple Quadrupole Mass Spectrometry
Electrospray ionization (ESI) is a process that enables the transfer of compounds in
solution phase to the gas phase in an ionized state thus allowing their measurement by mass
spectrometry. The use of ESI coupled to mass spectrometry was pioneered by Fenn et al.(12,13),
in 1985, by extending the work of Dole et al.(14) who demonstrated the production of gas phase
ions by spraying macromolecules through a steel capillary that was electrically charged, and
subsequently monitoring the ions with an ion-drift spectrometer. The process by which ESI
works has received much theorization, study, and debate(15-21), in the scientific community,
electrospray process is achieved by placing a potential difference between the capillary and a flat
counter electrode. The generated electric field will penetrate into the liquid meniscus and create
an excess abundance of charge at the surface. The meniscus becomes unstable and protrudes out
forming a Taylor cone. At the end of the Taylor cone a jet of emitting droplets (number of drops
estimated at 51,250 with radius of 1.5 µm) will form that contain an excess of charge. As the
droplets move towards the counter electrode, a few processes take place. The drop shrinks due
to evaporation thus increasing the surface charge until columbic repulsion is great enough that
offspring droplets are produced. This is known as the Rayleigh limit producing a columbic
explosion. The produced offspring droplets have 2% of the parent droplets mass and 15% of the
parent droplets charge. This process will continue until the drop contains one molecule of
analyte and charges that are associated with basic sites (positive mode). This is referred to as the
“charged residue model” that is most important for large molecules such as proteins. As the
droplets move towards the counter electrode a second process also take place known as the “ion
evaporation model.” In this process the offspring droplet will allow evaporation of an analyte
molecule from its surface along with charge when the charge repulsion of the analyte with the
solution is great enough to allow it to leave the surface of the drop. This usually takes place for
droplets with a radius that is less than 10 nm. This type of ion formation is most important for
small molecules.
In the ensuring years since its introduction, electrospray mass spectrometry has been used
for structural elucidation and fragment information(23-25), and non-covalent complex studies(26,27),
just to name a few recent examples of its overwhelmingly wide range of applications.
Electrospray(28-31) is an ionization method that is now well known to produce intact gas
process. In the transfer process of the ions from the condensed phase to the gas phase, several
types of “cooling” processes of the ions are taking place in the source: (1) cooling during the
desolvation process through vibrational energy transfer from the ion to the departing solvent
molecules, (2) adiabatic expansion of the electrospray as it enters the first vacuum stage, (3)
evaporative cooling, and (4) cooling due to low energy dampening collisions with ambient gas
molecules. The combination of these effects, and the fact that electrospray can effectively
transfer a solution phase complex to the gas phase with minimal interruption of the complex,
makes the study of non-covalent complexes from solution by electrospray ionization mass
spectrometry attractive.
The ESI source is coupled to a triple quadrupole mass spectrometer for detection of the
ions produced from the electrospray process. The triple quadrupole mass spectrometer is a
versatile tool in structural analysis of components of complex matrices. The instrument is
comprised of three quadrupoles, in tandem, which two (the first and third) have individual
detectors, while the middle quadrupole (actually a hexapole), known as the collision gas cell, is
RF only with no detector. Figure 1.2.4 shows the arrangement in space of the quadrupoles.
Having the quadrupoles aligned in tandem allows approaches to compound isolation, and
subsequent identification by using the quadrupoles as mass filters(32). A quadrupole is made up
of four rods that are placed precisely parallel to each other. One set of opposite poles have a DC
voltage (U) supply connected while the other two have a radio frequency (rf) voltage (V)
connected(33). Ions are accelerated into the quadrupole by a small voltage of 5 V, and under the
influence of the combination of electric fields, the ions follow a complicated trajectory path. If
the oscillation of the ions in the quadrupole have finite amplitude it will be stable and pass
certain range of DC voltage U and radio frequency potential V, the ion of interest will have a
stable region. A plot of U versus V is used to scan mass to charge ratios (m/z) with the
quadrupoles allowing the measurement of a range of masses, typically up to 4000 Da. The slope
of the line is a fixed ratio of U to V. As U and V are varied, the scan follows the scan line and
subsequent m/z values are recorded. Due to this functionality the quadrupoles are called mass
filters, however, they are still dependent upon a mass to charge ratio. The mass spectrometry
methods used in the lipid analyses included single stage analysis (ESI-MS) where the first
quadrupole is scanned and the first detector is used. This is used for compound molecular mass.
A second method used was neutral loss scanning (NL). This is used to determine the initial
molecule that losses a certain neutral mass upon fragmentation induced in the central hexapole
collision cell. In this procedure the first and third quadrupoles are scanned at a differential equal
to the neutral loss value. For example, if the NL value is 50 then when Q1 is at 200 m/z, Q3 is
scanning at 150 m/z. When 150 m/z is registered by detector 2, the Q1 value is recorded along
with the intensity recorded with detector 2. A third method used was precursor ion scanning.
This is used to determine the initial molecule that produces a specific product ion. Here Q3 is
held static at the ion fragment m/z of interest and Q1 is scanned over an m/z range. When the ion
is detected by Q3 the m/z value in Q1 is recorded in conjunction with the intensity recorded by
detector 2. Finally, a fourth method used was product ion scanning(33). This is a scan for product
ions produced from a single precursor ion which is allowed to pass through Q1. This is used for
1.5 Overview of Matrix Assisted Laser Desorption Ionization (MALDI) Time-of-Flight
(TOF) Mass Spectrometry
Matrix assisted laser desorption ionization (MALDI) is a process that enables the transfer
of compounds in a solid, crystalline phase to the gas phase in an ionized state thus allowing their
measurement by mass spectrometry(34-36). The process involves mixing the analyte of interest
with a strongly ultra-violet absorbing organic compound, applying the mixture to a surface and
then allowing it to dry. Examples of typical organic matrix compounds used are
2,5-dihydroxybenzoic acid (DHB), 3,5-dimethoxy-4-hydroxy-trans-cinnamic acis (sinapic or
sinapinic acid), and α-cyano-4-hydroxy-trans-cinnamic acid (α-CHCA). There are many
techniques described for applying the matrix to the target such as the “dried droplet”
method(36,37), and the “thin film” method(38). The dried crystalline mixture “film” or “spot” is
then irradiated with a nitrogen laser (337 nm), or an Nd-YAG laser (266 nm). The strongly UV
absorbing species accepts energy from the laser and desorbs from the surface carrying along any
analyte that is mixed with it. The analyte is cationized in the plume above the crystalline surface
with, in the positive mode, either a hydrogen proton or a metal cation such as sodium.
The desorbed, ionized compounds from the matrix assisted laser desorption ionization
process are then introduced into a mass spectrometer for analysis. The most common mass
spectrometer that is coupled to MALDI is the time-of-flight mass spectrometer (TOF MS)(39,40).
The TOF mass spectrometer separates compounds according to their mass to charge ratios (m/z)
through a direct relationship between a compounds drift time through a predetermined drift
pathlength and its mass to charge ratio (m/z). Initially, all the ions have similar kinetic energies
imparted to them from the draw-out pulse (representing time zero) which accelerates them into
according to the relationship between kinetic energy and mass represented by: KE = eV =
1/2mv2. From this expression, the mass to charge ratio is related to the ions flight time by the
following expression: m/z = 2vt2/L2. There is a high transmission efficiency of the ions into and
through the drift tube which equates to very low levels of detection limits which are in the
femtamole to atamole ranges. Theoretically, the mass range of the spectrometer is unlimited due
to the relationship of drift time for mass measurement. In practice though, the sensitivity needed
to detect a very slow moving large molecular weight compound limits the TOF-MS to 1 to 2
million Daltons or so.
The early designs of time of flight mass spectrometers suffered from poor resolution
which is the ability of the mass spectrometer to separate ions. This is usually expressed as
resolution = m/∆m where m is the mass of the peak of interest and ∆m is the difference between
this mass and the next closest peak. The poor resolution was due to nonuniform initial spatial and
energy distributions of the formed ions in the mass spectrometer’s ionization source. Due to the
distribution spreads the mass resolution was directly dependant upon the initial velocity of the
formed ions. Early work reported by Wiley et al.(41) reported upon the correction for initial
velocity distributions using a technique they described as “time-lag energy focusing” where the
ions were produced in a field-free region, then after a preset time a pulse was applied to the
region to extract the formed ions. They also reported upon a way to correct for initial special
distributions through a two field pulsed ion source. They demonstrated though that correction
can only be made for one of the distributions at a time. In MALDI, the spatial distribution spread
is not a significant problem, therefore “delayed extraction” of the ions from the field free source
region should correct for the initial energy distribution spread of the formed ions(42). With this
error in the time measurement, thus an increase in the length of the flight path should equate to a
higher resolution. The resolution enhancement due to the delayed extraction initial energy
focusing and flight path was demonstrated in a study reported by Vestal et al.(42) using a
MALDI-TOF mass spectrometer.
A second modification of time of flight mass spectrometers involves time focusing of the
ions while they are in flight through the use of an electrostatic mirror at the end of the flight
tube(43,44). The electrostatic mirror focusing the ions with the same mass to charge ratio but
slightly different kinetic energies by allowing a slightly longer path for the higher KE containing
ion compared to a slightly lower KE ion thus allowing the ions to catch up to one another. The
electrostatic mirror also increases the flight path length of the mass spectrometer, thus providing
a double focusing effect. All recent TOF-mass spectrometers employ both delayed extraction and
the reflectron electrostatic mirror for analysis of compounds below 10 kDa. For compounds
greater than 10 kDa a linear mode is typically used where the electrostatic mirror is turned off.
1.6 References
1. Mikkers, F.E.P., Everaerts, F.M., and Verheggen, Th.P.E.M. . J. Chromatogr., 1979,169, 11.
2. Jorgenson, J. W.; Lukacs, K. D. Anal. Chem.1981, 53, 1298-1302.
3. Terabe, S., Otsuka, K., Ichikawa, K., Tsuchiya, A., and Ando, T. Anal. Chem.1984, 56, 111.
4. Hjerten, S. J. Chromatogr., 1985,347, 191.
5. Hadley, M.; Gilges, M.; Senior, J.; Shah, A.; Camilleri, P. J. Chromatogr., B2000, 745,
177-188.
6. Chu, Y. H.; Dunayevskiy, Y. M.; Kirby, D. P.; Vouros, P.; Karger, B. L. J. Am. Chem. Soc. 1996, 118, 7827-7835.
7. Rao, J.; Colton, I. J.; Whitesides, G. M. J. Am. Chem. Soc. 1997,119, 9336-9340.
8. Rundlett, K. L.; Armstrong, D. W. J. Chromatogr., A1996,721, 173-186.
9. Dunayevskiy, Y. M.; Lyubarskaya, Y. V.; Chu, Y. H.; Vouros, P.; Karger, B. L. J. Med. Chem. 1998,41, 1201-1204.
10. Okun, V. M.; Moser, R.; Blaas, D.; Kenndler, E. Anal. Chem. 2001,73, 3900-3906.
11. Wan, Q. H.; Le, X. C. Anal.Chem. 1999,71, 4183-4189.
12. Whitehouse, C.M., Dryer, R.N., Yamashita, M., and Fenn, J.B. Anal. Chem. 1985, 57, 675.
14. Dole, M., Hines, R.L., Mack, R.C., Mobley, R.C., Ferguson, L.D., and Alice, M.B. J. Chem. Phys. 1968, 49, 2240.
15. Kebarle, P., Ho, Y. In Electrospray Ionization Mass Spectrometry; Cole, R.B., Ed.; Wiley:
New York, 1997; p. 17.
16. Cole, R.B. J. Mass Spectrom. 2000, 35, 763-772.
17. Cech, N.B., and Enke, C.G. Mass Spectrometry Reviews, 2001, 20, 362-387.
18. Gaskell, S.J. J. Mass Spectrom., 1997, 32, 677-688.
19. Cech, N.B., and Enke, C.G. Anal. Chem., 2000, 72, 2717-2723.
20. Sterner, J.L., Johnston, M.V., Nicol, G.R., and Ridge, D.P. J. Mass Spectrom. 2000, 35,
385-391.
21. Cech, N.B., and Enke, C.G. Anal. Chem., 2001, 73, 4632-4639.
22. Taylor, G.I. Proc. R. Soc. London, Ser. A, 1964, 280, 383.
23. Cao, P., and Stults, J.T. Rapid Commun. Mass Spectrom. 2000, 14, 1600-1606.
24. Ho, Y.P., Huang, P.C., and Deng, K.H. Rapid Commun. Mass Spectrom. 2003, 17, 114-121.
25. Kocher, T., Allmaier, G., and Wilm, M. J. Mass Spectrom. 2003, 38, 131-137.
26. Lorenz, S.A., Maziarz, E.P., and Wood, T.D. J. Am Soc Mass Spectrom 2001, 12, 795-804.
27. Daniel, J.M., Friess, S.D., Rajagopalan, S., Wendt, S., and Zenobi, R. International Journal of Mass Spectrometry 2002, 216, 1-27.
28. C. M. Whitehouse, R. N. Dreyer, M. Yamashita and J. B. Fenn, Anal. Chem.57, 675 (1985).
29. J. B. Fenn, J Am Soc Mass Spectrom4, 524, (1993).
30. R. B. Cole, J. Mass Spectrom. 35, 763 (2000).
31. N. B. Cech and C. G. Enke, Mass Spec Rev20, 362 (2001).
32. Johnstone, R.A.W.; Rose, M.E. Mass Spectrometry for Chemists and Biochemists, 2nd ed.; Cambridge University Press: New York, 1996; Chapter 2.
33. Micromass Quattro II User’s Guide, Micromass UK Limited, March 1996, 19-26.
34. Karas, M.; Bachmann, D.; Bahr, U.; Hillenkamp, F. Int. J. Mass Spectrom. Ion Processes 1987, 78, 53.
35. Tanaka, K.; Waki, H.; Ido, Y.; Akita, S.; Yoshida, Y.; Yoshida, T. Rapid Commun. Mass Spectrom.1988, 2, 151-153.
36. Karas, M.; Hillenkamp, F. Anal Chem1988, 60, 2299.
37. Xiang, F,; Beavis, R. C. Org. Mass Spectrom.1993, 28, 1424.
38. Xiang, F,; Beavis, R. C. Rapid Commun. Mass Spectrom. 1994, 8, 199-204.
39. Hillenkamp, F.; Unsold, E.; Kaufmann, R.; Nitsche, R. Appl. Phys.1975, 8, 341-348.
40. Van Breemen, R. B.; Snow, M.; Cotter, R. J. Int. J. Mass Spectrom. Ion Phys.1983, 49,
35-50.
41. Wiley, W. C.; McLaren, I. H. Time-of-Flight Mass Spectrometer with Improved Resolution
Rev. Sci. Instrum.1955, 26, 1150-1156.
42. Vestal, M. L.; Juhasz, P.; Martic, S. A. Delayed Extraction Matrix-assisted Laser Desorption Time-of-Flight Mass Spectrometry Rapid Commun. Mass Spectrom. 1995, 9, 1044-1050.
43. Mamyrin, B. A.; Karateev, V. I.; Shmikk, D. V.; Zagulin, V. A. Sov. Phys. JETP 1973, 37,
45.
CHAPTER II: DETERMINATION OF RELATIVE BINDING CONSTANTS
BETWEEN π-DELOCALIZED LYMPHANGITIC DYES AND AN ANTI-CANCER AGENT
BY CATION EXCHANGE LIQUID CHROMATOGRAPHY AND AFFINITY CAPILLARY ZONE ELECTROPHORESIS
2.1 Introduction
One of the major problems with cancer therapy is the effective delivery of the
anti-cancer agent to the tumor site. Skin permeability studies have demonstrated that the coupling of
the anti-cancer agent A007 with a carrier dye molecule (methylene green, MEG, methylene blue,
MEB, and toluidine blue, TB, see Figure 2.1 for structures) increases A007’s therapeutic
activity(1), with a rating from most effective, to least, as MEG>MEB>TB. Electrospray
ionization tandem mass spectrometry(2-5) (ESI-MS/MS) has been used in our lab (results
unpublished) to study the characteristics and relative binding strengths of the three dyes MEG,
MEB, and TB, complexed with A007. The gas phase binding strengths of the three complexes,
determined by ESI-MS/MS, were ranked in the following order: MEG>MEB>TB, which
indicates that a stronger binding between the carrier and anti-cancer agent directly correlates to a
greater efficacy. A high performance liquid chromatography (HPLC) method has been
developed for the determination of A007 in plasma(6), but not for the complexes that are formed
between A007 and carrier compounds. A cation exchange chromatography (CEC) method has
been developed in our lab (results unpublished) in order to rank the binding strengths of
carrier:A007 complexes. The CEC method determined binding strengths with the same trend as
was determined by ESI-MS/MS, namely MEG>MEB>TB. This effectively gave a “solution
N
S
N N
N
S
N N
N
S
N NH2
N
S
N N 3
N
S
N N
N
S
N N
N+
–O O
N+
–O O
(b)
(c)
(d)
N+ O– O
N+ O–
O NH N
OH OH
(a)
H
Figure 2.1. Structures of (a) 4,4’-Dihydroxybenzophenone-2,4-dinitrophenylhydrazone
The ACE method developed ranked the binding strengths of the carrier:A007 complexes,
in the solution phase at an adjusted physiological pH (7.4), as MEG>MEB>TB. These results
are in agreement with the ESI-MS/MS, and cation exchange chromatography rankings that were
previously determined.
2.2 Experimental
The UV/VIS experiments were performed with a PC controlled CARY 500 Scan
UV-Vis-NIR Spectrophotometer (Varian Australia Pty. Ltd.).
The fluorescence experiments were performed with a PC controlled Photon Technology
International Fluorometer (PTI, Canada).
The CE experiments were performed with a BioFocus 2000 Capillary Electrophoresis
System (BIO-RAD, Hercules, California) with a UV/VIS variable wavelength detector.
Uncoated fused-silica capillaries were used with a total length of 56 cm, effective length 50 cm,
and 50 um i.d. The capillaries were maintained at a temperature of 25 oC. The injection time
was 30 psi*sec pressure. All runs were made in a constant voltage mode with a running voltage
of 30 kV. The polarity was + to – (positive polarity mode where the negative pole is at the
capillary outlet). Between runs, the CE capillary was conditioned through a series of washes
comprised of 13 min. 1 M NaOH, followed by 13 min. of separation phase. The separation
phase consisted of (1) 50% MeOH/50% H2O buffered with 25 mM mono and dibasic hydrogen
phosphate at a pH of 7.4 (adjusted), or (2) 50% MeOH/50% H2O, 25 mM phosphate buffer at 7.4
pH (adjusted) and spiked with either MEG, MEB, or TB.
The HPLC experiments were performed with an 1100 Series HPLC (Agilent
array detector. The column used was a 150 x 1.0 mm, 5 micrometer, 300-A,
PolySULFOETHYL A column (PolyLC, Columbia, MD). Instrumental parameters consisted of
a 0.1 ml per minute flow, 10 microliter injection loop, and ambient column temperature. Mobile
phases consisted of (1) 50% MeOH/50% H2O, buffered at 7.4 pH (adjusted) with 15 mM
triethylamine phosphate (TEAP), (2) 50% MeOH/50% H2O, buffered at 7.4 pH (adjusted) with
15 mM TEAP, and spiked with either 5x10⁻⁵ M MEG, 5x10⁻⁵ M MEB, or 5x10⁻⁵ M TB, or (3)
50% MeOH/50% H2O, buffered at 7.4 pH (adjusted) with 15 mM triethylamine phosphate and
0.5 M NaCl.
To mimic physiological conditions, all solutions are at a pH of 7.4, but adjusted due to
the change in H+ activity for a 50 % methanol and 50 % water mixture(18,19).
2.3 Results and Discussion
2.3.1 UV/Vis Study of the Compounds and Complexes
Figure 2.2 illustrates UV/Vis spectra of the complexes formed between the three dyes and
A007. What’s observed from the spectra is that each compound contains a unique absorbance
peak which can be used to detect and monitor the compounds and complexes without
interference. The three dyes used in the study, methylene green, methylene blue, and toluidine
blue, have unique absorbance maximums at 656 nm, 662 nm, and 630 nm, respectively. The
anti-cancer agent A007 has an absorbance maximum between 398 nm, and 405 nm. Both dye
and A007 peaks are found in the complexes, and the A007 max at 398 nm was used to detect the