A peer-reviewed, open-access journal of population sciences
DEMOGRAPHIC RESEARCH
VOLUME 29, ARTICLE 31, PAGES 837-864
PUBLISHED 18 OCTOBER 2013
http://www.demographic-research.org/Volumes/Vol29/31/ DOI: 10.4054/DemRes.2013.29.31
Research Article
Sex ratios at sexual maturity and longevity:
Evidence from Swedish register data
Kieron J. Barclay
c
2013 Kieron J. Barclay.
2. Data and methods 841
2.1 Sex ratio calculations 842
3. Results and analysis 844
4. Discussion and conclusion 848
5. Acknowledgements 850
References 852
Sex ratios at sexual maturity and longevity:
Evidence from Swedish register data
Kieron J. Barclay1
Abstract
BACKGROUND
This study tests the recently proposed hypothesis that the contextual sex ratio at sexual maturity is related to longevity. Previous empirical research in the United States has shown that a higher proportion of males at the age of sexual maturity increases the risk of mortality for males both before and after the age of 65.
METHODS
I use Swedish administrative register data, linking the 1960 census to individual-level mortality data over the period 1960 to 2007. I calculate the sex ratio at two geographic levels, municipalities and parishes. Two different specifications of the sex ratio are cal-culated: males aged 18 to 27 over females aged 15 to 24, and males aged 18 to 22 over females aged 16 to 20. I conduct piece-wise constant survival analyses over the period from 1960 to 2007 to analyze the risk of mortality before age 65. I run separate analyses for males and females, using cohorts born in 1941 and 1942.
RESULTS
For males, the results generally show that for both males and females a higher proportion of males was associated with a lower relative risk of mortality before age 65. The results were not statistically significant.
CONCLUSIONS
The lack of a consistent statistically significant association for either males or females, and the trend for males being in the opposite direction of what was hypothesized, sug-gests that support for the hypothesis in Sweden is very weak.
1.
Introduction
While previous research has indicated that imbalances in the human sex ratio can influ-ence patterns of marriage and divorce, fertility behaviour, and labour supply (Svarer 2007; Lloyd and South 1996; Angrist 2002), very little research has addressed the relationship between sex ratios and health. A small handful of studies have examined whether gender imbalances in the workplace are associated with morbidity and differences in sickness absenteeism rates for males and females, but the evidence is mixed (Bryngelson, Hertz-man, and Fritzell 2011; Mastekaasa 2005; Hensing and Alexanderson 2004; Svedberg et al. 2009). Even less research has been conducted on the relationship between sex ratios and mortality risk. A study published recently by Jin et al. (2010) was the first to pro-pose the hypothesis that imbalances in the contextual sex ratio at sexual maturity may be related to longevity. They found that a higher proportion of males in the local context, defined as schools and U.S. states, was associated with an increased risk of mortality for males, though not for females, both before and after the age of 65. The current study will attempt to replicate these analyses as closely as possible using Swedish administra-tive register data, investigating mortality before age 65. Jin et al. (2010) proposed three potential mechanisms by which such a relationship might operate. The first was that im-balances in the sex ratio may lead to delays in marriage, and that individuals would thus be less likely to gain from the cumulative health benefits associated with marriage. Sec-ondly, imbalances in the sex ratio might mean that individuals have to settle for a partner of a lower quality, meaning that even conditional upon entry into a long-term partnership, the cumulative benefits would be lower for members of the supernumerary sex. Finally, imbalances in the sex ratio should be related to higher levels of competition for sexual partners, and the psychosocial stress associated with this elevated level of competition at a relatively sensitive age might have a long-term impact upon health.
programme, and the final sample used for analysis totalled approximately 7.7 million males. All these men were aged over 65, and the average age was 71. The sex ratios at sexual maturity for these males were calculated at the U.S. state level, using census data from 1930, 1940 and 1950, and exponential interpolation to estimate the sex ratios for when each male in the sample was aged 20. A 10-year age range was used to calculate the sex ratio, using males aged 18 to 27 and females aged 15 to 24. The staggered age bands were used to reflect the average age difference between husbands and wives at that time. A Cox proportional hazards model was used to examine whether the sex ratio at sexual maturity was associated with mortality risk, and the follow-up period was from 1993 to 2002. The results were consistent with the first analysis using the WLS. The relative risk of mortality was approximately 1.6% higher for males who were sexually mature in states where the mean proportion of males in the aforementioned age ranges was 52% relative to states where the mean proportion of males was 47%.
When sex ratios at birth follow the naturally occurring ratio of between 103 to 105 boys born per 100 girls, adult sex ratios can only vary for three reasons. The first is migration, and particularly internal migration, leading to different proportions of males and females in different regions (Edlund 2005). It is also possible for a measure of the sex ratio to fluctuate due to changes in fertility rates over time, if it is calculated to reflect common patterns of age-differences in partnering and marriage observed in a society (Bergstrom and Lam 1994). It has been argued that using staggered age bands, such as a sex ratio calculated using males aged 18 to 27 and females aged 15 to 24, more accurately reflects the effective partner market for individuals in this context (Fossett and Kiecolt 1991). If the total fertility rate is increasing from year to year, for example, then using a staggered age band to calculate the sex ratio means that there will be, on average, a higher proportion of females per geographical unit. Finally, sex ratio imbalances can result from sex-differentials in mortality, although the importance of this factor is greater at older ages. To address potential confounding between the sex ratio and mortality, I will attempt to control for factors that should affect internal migration to the extent that the data permit (Morgan and Winship 2007).
(males 18-27 and females 15-24), and it should be pointed out that in 1960 most males lived in regions with a relatively large supply of females. The females in the 1941/1942 cohorts on the other hand have a smaller supply of potential partners because the cohorts preceding them, from which they would be most likely to source a potential partner, were considerably smaller. Nevertheless, the hypothesis being tested would still predict that men and women with fewer potential partners should have worse outcomes relative to those with more potential partners according to the mechanisms posited; there need not be an absolute shortage of potential partners.
Figure 1: Live births in Sweden, 1900-1960
80,000 100,000 120,000 140,000
90,000 110,000 130,000
Births
1900 1910 1920 1930 1940 1950 1960
Year
is likely to vary over time because of changes in nutrition. For females, the onset of sex-ual maturity is ussex-ually defined as the onset of menarche (Ljung, Bergsten-Brucefors, and Lindgren 1974). It is estimated that the average age for the onset of menarche for females in Sweden in 1960 was between 13 and 14. However, females aged 13 or 14 are not in the marriage market, and thus it is probably more reasonable to analyze females who are in their late teenage years and who could be said to be open to, and legally able to, enter relationships with members of the opposite sex. In males one way of defining the onset of sexual maturity is to look at cohort-specific mortality curves and identify the point at which the ‘accident hump’ amongst males is at its peak (Goldstein 2011). The ‘accident hump’ in early adult mortality amongst males reflects an increase in deaths attributable to accidents, violence, and disease, and there is evidence that this coincides with the peak of male hormone production (Parkes 1976). In Sweden in 1960 the peak of this ‘accident hump’ occurred at approximately the age of 18 (Goldstein 2011). Subsequently this study will focus upon males and females aged 18 and 19 in 1960.
2.
Data and methods
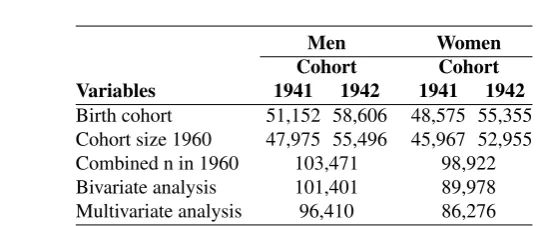
analyses for males and females. Table 1 shows how the study size for analysis changes as I include additional variables. The difference between the sample size for those aged 18 and 19 in 1960 is attributable to the difference in the size of the live birth cohorts born in 1941 and 1942 (SCB 1999), which can also be seen in Figure 1. The early 20th century baby boom in Sweden began in the early 1940s (Dahlberg and Nahum 2003). It can be seen that the study size decreases slightly for the bivariate analyses where only age, as the baseline hazard, and the sex ratio are included. However, there are some missing values even in the Swedish register data, and thus the study size decreases slightly more in the full multivariate analyses. As discussed earlier, the onset of female sexual maturity in Sweden in 1960 was estimated to be between the ages of 13 and 14 (Ljung, Bergsten-Brucefors, and Lindgren 1974). However, only those aged 18 in 1960 will have reached the age of 65 by the latest point in time for which I have data on mortality, which is 2007, and thus those aged 18 are the youngest group, in 1960, for whom I can reasonably conduct this analysis. I only analyze individuals who were unmarried at the age of exposure, as it seems likely that the proposed mechanisms in terms of competition for a partner would be most relevant to this group. This is also the strategy followed by Jin et al. (2010).
Table 1: Study size
Men Women
Cohort Cohort Variables 1941 1942 1941 1942
Birth cohort 51,152 58,606 48,575 55,355
Cohort size 1960 47,975 55,496 45,967 52,955
Combined n in 1960 103,471 98,922
Bivariate analysis 101,401 89,978
Multivariate analysis 96,410 86,276
Source: Swedish administrative register data, compiled by the author.
2.1 Sex ratio calculations
Kolk 2012). I will also test the hypothesis using a second, narrower definition of the sex ratio, specifying the ratio of males aged 18 to 22 and females aged 16 to 20. This may represent a more realistic partner market for males and females aged 18 and 19. The sex ratio is operationalized as the proportion of males, and divided into sextiles. I calculate these sex ratios at two different geographical levels: municipalities (kommun) and parishes (forsamling). The population of Sweden in 1960 was 7,497,967. In 1960 there were 1,029 municipalities, with an average population of 7,286, while there were also 2,658 parishes, with an average population of 2,820. The calculated sex ratio for any given individual reflects the sex ratio of the municipality or parish in which their residence is registered. In my models I also include variables for the absolute number of males and females in each of these geographical units. The sex ratio is essentially an interaction term derived from these two variables, and it is standard practice to include the variables from which an interaction term is derived (Kronmal 1993).
Figure 2: Sex ratio distribution by municipality and parish in Sweden, 1960
0
5
10
15
20
Percent
0 10 20 30 40 50 60 70 80 90 100 Percentage Male
(a) Municipality. Men 18-27 : Women 15-24
0
5
10
15
20
Percent
0 10 20 30 40 50 60 70 80 90 100 Percentage Male
(b) Municipality. Men 18-22 : Women 16-20
0
5
10
15
20
Percent
0 10 20 30 40 50 60 70 80 90 100 Percentage Male
(c) Parish. Men 18-27 : Women 15-24
0
5
10
15
20
Percent
0 10 20 30 40 50 60 70 80 90 100 Percentage Male
(d) Parish. Men 18-22 : Women 16-20
3.
Results and analysis
Figure 3: Multivariate analyses for males and females: Mortality risk by sex ratio calculated at municipality and parish levels. Sex ratio: Males aged 18-27, females aged 15-24
● ● ●
●
●
●
0.8 0.9 1.0 1.1
40 41 42 43 44 45 46 47 48 49 50 51 52 53 54
Population−weighted Mean of the Proportion of Males
Relativ
e Risks
Sex
●
Men Women
(a) Municipality
● ● ●
● ●
●
0.9 1.0 1.1
42 43 44 45 46 47 48 49 50 51 52 53 54 55 56
Population−weighted Mean of the Proportion of Males
Relativ
e Risks
Sex
●
Men Women
(b) Parish
municipality or parish level consistently show that a higher proportion of males at the age of sexual maturity is associated with higher mortality. Indeed, the more common pattern is that the parameter estimates for males show the relative risk of mortality is lower in regions with a higher proportion of males, though this is not statistically significant more often than could be expected according to chance. Figures 3(a) and 3(b) generally show that for females the relative risk does not change or is slightly elevated for sextiles 2 and 3, but there is a lower relative risk associated with a higher proportion of males for the upper three sextiles. This pattern is partially consistent with the hypothesis, but the lack of statistical significance despite relatively high statistical power suggests that the support is weak at best. Overall, the inconsistency of the results for males, and the weak support for females, suggests that the hypothesized mechanisms are not the predominant factors influencing the patterns observed.
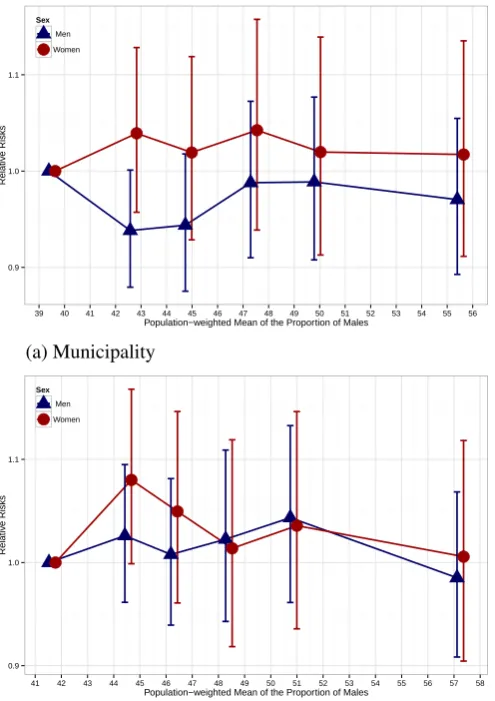
Figure 4: Multivariate analyses for males and females: Mortality risk by sex ratio calculated at municipality and parish levels. Sex ratio: Males aged 18-22, females aged 16-20
●
●
● ●
● ●
0.9 1.0 1.1
39 40 41 42 43 44 45 46 47 48 49 50 51 52 53 54 55 56
Population−weighted Mean of the Proportion of Males
Relativ
e Risks
Sex
●
Men Women
(a) Municipality
●
●
● ●
●
●
0.9 1.0 1.1
41 42 43 44 45 46 47 48 49 50 51 52 53 54 55 56 57 58
Population−weighted Mean of the Proportion of Males
Relativ
e Risks
Sex
●
Men Women
4.
Discussion and conclusion
In summary, this study found very limited support for the hypothesis that the contextual sex ratio at sexual maturity is linked to mortality risk for either males or females in Swe-den. The results generally showed that there was no statistically significant relationship between the contextual sex ratio at sexual maturity and the mortality risk for either males or females. While the direction of the pattern in the results for females often ran in the hypothesized direction, the results for males ran in quite the opposite direction of that predicted by the hypothesis. Nevertheless, it should be added that the parameter estimates are rather imprecise, and that the confidence intervals for the male analyses overlap with almost all of the confidence intervals from the original study presented by Jin et al. (2010). In this study I was not able to control extensively for variables that could influence the propensity of individuals to migrate from one region to another. Thus, there may still be confounding factors that are related both to the sex ratio to which the units in my analysis were exposed to at the age of sexual maturity and mortality risk. However, in light of the results of the analyses above, I suspect that the failure to fully account for these potential confounders is of secondary concern.
One of the inherent problems in conducting a study investigating the relative influence of marriage markets on a given outcome is the challenge inherent in attempting to accu-rately define the appropriate marriage market for the individuals under analysis. When using geographical units to calculate sex ratios, it is difficult to know the extent to which the marriage market for any given individual is being overbound or underbound. Indi-viduals may work or study in a different geographical unit from that in which they live, and this is particularly likely to be true in the case of parishes, which are rather small. It is likely that the sex ratio in the context in which an individual spends most of his or her day would be the most relevant unit for which to calculate the sex ratio, but of course it is not possible to know this. Municipalities in Sweden are larger, and thus it is more likely that the individuals in this study worked or studied in those unit areas in addition to living there. However, larger units lead to a decrease in the precision of the measure-ment of the sex ratio that an individual actually encounters on a day-to-day basis. It is impossible to assess the exact extent of the measurement error, so any interpretation of the municipality-level results should be accompanied with caution.
A further important point is that the validity of the sex ratio measure as an index of mate availability is problematic in the sense that the relevant sex ratio for any given individual is likely to be stratified by factors such as education, intelligence, and physical attractive-ness, which is evidenced by the strongly persistent pattern of homophilic partnering in humans (Fossett and Kiecolt 1991; McPherson, Smith-Lovin, and Cook 2001). The sex ratios calculated in this study do not reflect this stratification, and any attempt to capture this stratification would have to be somewhat speculative.
An additional limitation of this study was that the earliest point in time for which I could access data was 1960. This meant that it was not possible to examine the relation-ship between the contextual sex ratio at sexual maturity and mortality risk amongst those over the age of 65 as Jin et al. (2010) did in their study. Future research may corroborate the original findings for this older age group. Another limitation of this study was that for females the sex ratio was not calculated at what is defined as the onset of female sex-ual maturity, which is ussex-ually defined as the onset of menarche. However, given that the proposed mechanisms concern competition for partners in a marriage market, it can be argued that examining females exposed at ages 18 and 19 is still a reasonable approach. Indeed, it would have been more problematic had I calculated the contextual sex ratio at the age of 13 for females, as these individuals would not be seeking sexual partners.
Although the results of this analysis were not consistent with the results observed in the original study by Jin et al. (2010), this may be because of different patterns of mar-riage, cohabitation, and childbearing in Sweden and the United States in these cohorts. It could be that the sex ratio at sexual maturity, defined here as being 18 or 19 years old, was less salient a factor for individuals living in Sweden than the United States because the average age of marriage and childbearing in Sweden was higher. However, the age dif-ference at which these events occurred for cohorts born around 1940 in the United States and Sweden was not dramatically different. For the 1938-1942 cohorts in the United States, the mean age at first marriage was 23.3 for males, and 21.1 for females (Schoen et al. 1985). For the 1940 cohort in Sweden, the highest rate of first marriage formation amongst women occurred at the age of 22 (Coale 1971), and by the age of 27 over 80% of females in that cohort had married (Ohlsson-Wijk 2011). The mean age at first child-birth for women in Sweden born in cohorts 1940 to 1943 was approximately 23.8 (Hoem 1990). The mean age at first childbirth for women in the United States for the same co-horts was similar, at 22.2 (Bloom 1982). It seems unlikely that these relatively small age differences should dramatically alter the relative salience of competition for partners at what has been defined as the age of sexual maturity in this study.
(Lesthaeghe 2010). Less committed relationships, and a lower prevalence of marriages, would have meant that those who entered partnerships would have been less likely to have been permanently removed from the marriage market. While disadvantages would still have remained for members of the supernumerary sex, this tendency towards relationship turnover could have meant that the supply of potential partners would not have fallen so drastically and permanently as could otherwise have been the case. Thus the degree to which the potential mechanisms by which it has been posited that the sex ratio at sex-ual maturity might affect mortality risk may not have been so salient as they were for individuals in the United States at this same point in time.
Although it is difficult to find directly comparable figures for the two countries for spe-cific cohorts, 37% of first marriages in the 1938-1942 cohort in the United States ended in divorce for females (Schoen et al. 1985). In Sweden, the rate of dissolution of the first union by the age of 45 for females was substantially lower - 27.8% for the 1936-1940 co-hort, and 26.4% for the 1941-1945 cohort (Blanc 1987). In terms of remarriage, 80.8% of males from the 1938-1942 cohorts in the United States who had dissolved the first union remarried, with the average age of remarriage 39.7; 73.4% of females from the same co-hort remarried following dissolution of the first union, with the average age of remarriage being 37.3 (Schoen et al. 1985). In Sweden the cumulative proportion of females who en-tered a second union was approximately 50%, although the vast majority of these second unions were non-marital cohabitations (Blanc 1987). Of course, these figures do not tell the whole story because of the much higher rate of non-marital cohabitation in Sweden in comparison with the United States (Popenoe 1987). However, neither do they universally indicate that the marriage market in the United States had a considerably lower level of turnover relative to Sweden. An obvious explanation for the difference in the results test-ing the hypothesis for the relationship between sex ratios at sexual maturity and longevity between the United States and Sweden is not immediately clear. Given that it is difficult to find cohort specific mortality data where information is also available to calculate the contextual sex ratio at the time of sexual maturity for those individuals, it remains to be seen the extent to which it will be possible to test this hypothesis further.
5.
Acknowledgements
References
Angrist, J. (2002). How do sex ratios affect marriage and labor markets? Evidence from America’s second generation. Quarterly Journal of Economics 117(3): 997–1038.
doi:10.1162/003355302760193940.
Bergstrom, T. and Lam, D. (1994). The effects of cohort size on marriage markets in twentieth century Sweden. In: Ermisch, J. and Ogawa, N. (eds.)The Family, the
Mar-ket, and the State in Ageing Societies. Oxford: Oxford University Press: 46–63.
Blanc, A. (1987). The formation and dissolution of second unions: Marriage and cohab-itation in Sweden and Norway. Journal of Marriage and the Family49(2): 391–400.
doi:10.2307/352308.
Bloom, D. (1982). What’s happening to the age at first birth in the United States? A study of recent cohorts.Demography19(3): 351–370. doi:10.2307/2060976.
Bryngelson, A., Hertzman, J., and Fritzell, J. (2011). The relationship between gender segregation in the workplace and long-term sickness absence in Sweden.Scandinavian
Journal of Public Health39(6): 618–626.doi:10.1177/1403494811414242.
Coale, A. (1971). Age patterns of marriage. Population Studies 25(2): 193–214.
doi:10.2307/2173210.
Dahlberg, S. and Nahum, R.A. (2003). Cohort effects on earnings profiles: Evidence from Sweden. Uppsala University, Department of Economics. (Working Paper Series 2003:11).
Edlund, L. (2005). Sex and the city.Scandinavian Journal of Economics107(1): 25–44.
doi:10.1111/j.1467-9442.2005.00393.x.
Fossett, M. and Kiecolt, K. (1991). A methodological review of the sex ratio: Alterna-tives for comparative research. Journal of Marriage and the Family53(4): 941–957.
doi:10.2307/352999.
Goldstein, J. (2011). A secular trend toward earlier male sexual maturity: Evi-dence from shifting ages of male young adult mortality. PLoS ONE 6(8): e14826. doi:10.1371/journal.pone.0014826.
Hensing, G. and Alexanderson, K. (2004). The association between sex segregation, working conditions, and sickness absence among employed women.Occupational and
Environmental Medicine61(2): e7. doi:10.1136/oem.2002.005504.
Hoem, J. (1990). Social policy and recent fertility change in Sweden. Population and
Jin, L., Elwert, F., Freese, J., and Christakis, N. (2010). Preliminary evidence regard-ing the hypothesis that the sex ratio at sexual maturity may affect longevity in men.
Demography47(3): 579–586. doi:10.1353/dem.0.0121.
Kolk, M. (2012). Age differences in unions - continuity and divergence in Sweden be-tween 1932 and 2007.Stockholm Research Reports in Demography25.
Kronmal, R. (1993). Spurious correlation and the fallacy of the ratio standard re-visited. Journal of the Royal Statistical Society, Series A 156(3): 379–392.
doi:10.2307/2983064.
Lesthaeghe, R. (2010). The unfolding story of the second demographic transi-tion. Population and Development Review 36(2): 211–251.
doi:10.1111/j.1728-4457.2010.00328.x.
Ljung, B.O., Bergsten-Brucefors, A., and Lindgren, G. (1974). The secular trend
in physical growth in Sweden. Annals of Human Biology 1(3): 245–256.
doi:10.1080/03014467400000291.
Lloyd, K. and South, S. (1996). Contextual influences on young men’s transition to first marriage.Social Forces74(3): 1097–1119. doi:10.2307/2580394.
Mastekaasa, A. (2005). Sickness absence in female- and male-dominated oc-cupations and workplaces. Social Science and Medicine 60(10): 2261–2272.
doi:10.1016/j.socscimed.2004.10.003.
McPherson, M., Smith-Lovin, L., and Cook, J. (2001). Birds of a feather:
Homophily in social networks. Annual Review of Sociology 27: 415–444.
doi:10.1146/annurev.soc.27.1.415.
Morgan, S. and Winship, C. (2007).Counterfactuals and Causal Inference: Methods and
Principles for Social Research. Cambridge: Cambridge University Press.
Ohlsson-Wijk, S. (2011). Sweden’s marriage revival: An analysis of the new-millennium switch from long-term decline to increasing popularity.Population Studies65(2): 183–
200. doi:10.1080/00324728.2011.574724.
Parkes, A. (1976). Patterns of sexuality and reproduction. Oxford: Oxford University Press.
Popenoe, D. (1987). Beyond the nuclear family: A statistical portrait of the chang-ing family in Sweden. Journal of Marriage and the Family 49(1): 173–183.
doi:10.2307/352681.
the impact of state policies and institutions with mixed-level data. State Politics and
Policy Quarterly7(4): 446–459.
SCB (1999). Befolkningsutvecklingen under 250 år : Historisk statistik för sverige. Statis-tiska centralbyrån. (Demografiska rapporter 1999:2).
Schoen, R., Urton, W., Woodrow, K., and Baj, J. (1985). Marriage and divorce in twenti-eth century American cohorts.Demography22(1): 101–114. doi:10.2307/2060989.
Svarer, M. (2007). Working late: Do workplace sex ratios affect parternship formation and dissolution.The Journal of Human Resources42(3): 583–595.
Svedberg, P., Bildt, C., Lindelöw, M., and Alexanderson, K. (2009). Self-reported health among employees in relation to sex segregation at work sites.Journal of Occupational
Appendices
Figure A-1: Bivariate analyses for males and females: Mortality risk by sex ratio calculated at municipality and parish levels. Sex ratio: Males aged 18-27, females aged 15-24
●
● ●
●
● ●
0.9 1.0 1.1
40 41 42 43 44 45 46 47 48 49 50 51 52 53 54
Population−weighted Mean of the Proportion of Males
Relativ
e Risks
Sex
●
Men Women
(a) Municipality
● ●
●
●
●
●
0.9 1.0 1.1
42 43 44 45 46 47 48 49 50 51 52 53 54 55 56
Population−weighted Mean of the Proportion of Males
Relativ
e Risks
Sex
●
Men Women
Figure A-2: Bivariate analyses for males and females: Mortality risk by sex ratio calculated at municipality and parish levels. Sex ratio: Males aged 18-22, females aged 16-20
●
● ●
●
● ●
0.9 1.0 1.1
39 40 41 42 43 44 45 46 47 48 49 50 51 52 53 54 55 56
Population−weighted Mean of the Proportion of Males
Relativ
e Risks
Sex
●
Men Women
(a) Municipality
●
●
●
● ●
●
0.9 1.0 1.1
41 42 43 44 45 46 47 48 49 50 51 52 53 54 55 56 57 58
Population−weighted Mean of the Proportion of Males
Relativ
e Risks
Sex
●
Men Women
Table A-1: All-cause mortality results: Males and females, aged 18 and 19 in 1960, sex ratio (males: 18-27, females: 15-24) calculated within municipalities
Males
Covariates RR S.E. P-value 95% CI
Age 18-25 0.01 0.00 0.000 0.00 - 0.01
26-30 0.20 0.02 0.000 0.17 - 0.23
31-35 0.26 0.02 0.000 0.22 - 0.30
36-40 0.44 0.03 0.000 0.39 - 0.51
41-45 0.64 0.03 0.000 0.58 - 0.71
46-50 1.00
51-55 2.26 0.09 0.000 2.09 - 2.45
56-60 3.28 0.12 0.000 3.06 - 3.51
61-65 4.99 0.17 0.000 4.66 - 5.33
Socioeconomic Index Self-employed in Agriculture, Forestry 1.00
Semi-skilled Workers in Agriculture, Forestry 1.13 0.08 0.076 0.99 - 1.30 Self-employed in Industry, Trade, Service sectors 1.20 0.12 0.055 1.00 - 1.45
Professionals 1.01 0.32 0.985 0.54 - 1.87
Routine Non-manual Occupations 0.99 0.07 0.905 0.87 - 1.13
Semi-skilled Workers 1.08 0.07 0.210 0.96 - 1.22
Service Occupations 1.51 0.16 0.000 1.22 - 1.87
Military 0.91 0.14 0.526 0.66 - 1.23
No Identifiable Occupation 1.50 0.32 0.059 0.98 - 2.30
Students 0.80 0.05 0.001 0.71 - 0.91
Other 1.11 0.07 0.099 0.98 - 1.25
Parent Self-employed in Agriculture, Forestry 1.00
Socioeconomic Index Semi-skilled Workers in Agriculture, Forestry 1.35 0.07 0.000 1.22 - 1.50 Self-employed in Industry, Trade, Service sectors 1.15 0.05 0.002 1.05 - 1.26
Professionals 1.01 0.10 0.907 0.83 - 1.23
Executives/Managers 1.13 0.08 0.095 0.98 - 1.30
Routine Non-manual Occupations 1.17 0.05 0.000 1.08 - 1.27
Semi-skilled Workers 1.26 0.05 0.000 1.17 - 1.35
Service Occupations 1.66 0.09 0.000 1.49 - 1.85
Military 1.03 0.15 0.846 0.77 - 1.37
No Identifiable Occupation 2.70 0.68 0.000 1.64 - 4.43
Students 0.99 0.34 0.971 0.51 - 1.93
Other 1.43 0.07 0.000 1.30 - 1.57
Sextiles of Sex Ratio 1 1.00
2 0.99 0.04 0.852 0.92 - 1.07
3 0.91 0.04 0.026 0.83 - 0.99
4 0.94 0.04 0.125 0.86 - 1.02
5 0.94 0.05 0.233 0.86 - 1.04
6 0.93 0.04 0.112 0.85 - 1.02
N 96,410
Deaths 11,631
Table A-1: (Continued)
Females
Covariates RR S.E. P-value 95% CI
Age 18-25 0.01 0.00 0.000 0.00 - 0.02
26-30 0.11 0.01 0.000 0.09 - 0.14
31-35 0.20 0.02 0.000 0.16 - 0.24
36-40 0.26 0.02 0.000 0.23 - 0.31
41-45 0.54 0.03 0.000 0.48 - 0.60
46-50 1.00
51-55 1.93 0.11 0.000 1.73 - 2.15
56-60 2.98 0.14 0.000 2.71 - 3.27
61-65 4.37 0.19 0.000 4.02 - 4.75
Socioeconomic Index Self-employed in Agriculture, Forestry 1.00
Semi-skilled Workers in Agriculture, Forestry 1.10 0.26 0.685 0.69 - 1.75 Self-employed in Industry, Trade, Service sectors 0.90 0.19 0.616 0.60 - 1.35
Professionals 2.10 1.58 0.322 0.48 - 9.14
Routine Non-manual Occupations 0.93 0.13 0.607 0.71 - 1.22
Semi-skilled Workers 1.26 0.18 0.102 0.96 - 1.65
Service Occupations 1.14 0.16 0.358 0.86 - 1.50
Military
-No Identifiable Occupation 1.00 0.35 0.989 0.50 - 2.01
Students 0.87 0.12 0.326 0.66 - 1.15
Other 1.64 0.23 0.000 1.25 - 2.15
Parent Self-employed in Agriculture, Forestry 1.00
Socioeconomic Index Semi-skilled Workers in Agriculture, Forestry 1.16 0.08 0.024 1.02 - 1.33 Self-employed in Industry, Trade, Service sectors 1.13 0.07 0.040 1.01 - 1.27
Professionals 1.05 0.16 0.771 0.78 - 1.41
Executives/Managers 1.03 0.10 0.788 0.85 - 1.23
Routine Non-manual Occupations 1.20 0.06 0.000 1.09 - 1.33
Semi-skilled Workers 1.22 0.05 0.000 1.13 - 1.33
Service Occupations 1.46 0.10 0.000 1.28 - 1.68
Military 0.93 0.16 0.667 0.66 - 1.30
No Identifiable Occupation 0.89 0.46 0.818 0.32 - 2.47
Students 2.52 0.78 0.003 1.38 - 4.62
Other 1.33 0.07 0.000 1.19 - 1.48
Sextiles of Sex Ratio 1 1.00
2 1.00 0.05 0.988 0.91 - 1.10
3 1.01 0.06 0.894 0.90 - 1.13
4 0.96 0.05 0.508 0.87 - 1.07
5 0.93 0.06 0.281 0.83 - 1.06
6 0.91 0.06 0.117 0.81 - 1.02
N 86,276
Deaths 6,726
Table A-2: All-cause mortality results: Males and females, aged 18 and 19 in 1960, sex ratio (males: 18-27, females: 15-24) calculated within parishes
Males
Covariates RR S.E. P-value 95% CI
Age 18-25 0.01 0.00 0.000 0.00 - 0.01
26-30 0.20 0.02 0.000 0.17 - 0.23
31-35 0.26 0.02 0.000 0.22 - 0.30
36-40 0.44 0.03 0.000 0.40 - 0.50
41-45 0.64 0.03 0.000 0.58 - 0.71
46-50 1.00
51-55 2.26 0.09 0.000 2.10 - 2.44
56-60 3.28 0.13 0.000 3.04 - 3.53
61-65 4.99 0.19 0.000 4.63 - 5.37
Socieconomic Index Self-employed in Agriculture, Forestry 1.00
Semi-skilled Workers in Agriculture, Forestry 1.14 0.08 0.078 0.99 - 1.31 Self-employed in Industry, Trade, Service sectors 1.20 0.12 0.056 0.99 - 1.45
Professionals 1.00 0.32 0.994 0.53 - 1.88
Routine Non-manual Occupations 0.99 0.07 0.937 0.87 - 1.13
Semi-skilled Workers 1.08 0.07 0.212 0.96 - 1.22
Service Occupations 1.52 0.16 0.000 1.23 - 1.87
Military 0.91 0.14 0.523 0.67 - 1.23
No Identifiable Occupation 1.51 0.34 0.063 0.98 - 2.34
Students 0.81 0.05 0.001 0.71 - 0.91
Other 1.11 0.07 0.094 0.98 - 1.25
Parent Self-employed in Agriculture, Forestry 1.00
Socioeconomic Index Semi-skilled Workers in Agriculture, Forestry 1.36 0.07 0.000 1.23 - 1.50 Self-employed in Industry, Trade, Service sectors 1.16 0.05 0.002 1.06 - 1.27
Professionals 1.02 0.11 0.829 0.83 - 1.25
Executives/Managers 1.14 0.09 0.076 0.99 - 1.33
Routine Non-manual Occupations 1.18 0.05 0.000 1.09 - 1.28
Semi-skilled Workers 1.26 0.05 0.000 1.18 - 1.36
Service Occupations 1.67 0.09 0.000 1.50 - 1.86
Military 1.04 0.15 0.779 0.79 - 1.37
No Identifiable Occupation 2.71 0.70 0.000 1.64 - 4.49
Students 0.99 0.37 0.989 0.48 - 2.05
Other 1.43 0.07 0.000 1.31 - 1.57
Sextiles of Sex Ratio 1 1.00
2 0.93 0.03 0.066 0.87 - 1.00
3 0.92 0.04 0.054 0.85 - 1.00
4 0.95 0.04 0.219 0.87 - 1.03
5 0.96 0.05 0.411 0.87 - 1.06
6 0.94 0.04 0.224 0.86 - 1.04
N 96,410
Deaths 11,631
Table A-2: (Continued)
Females
Covariates RR S.E. P-value 95% CI
Age 18-25 0.01 0.00 0.000 0.00 - 0.02
26-30 0.11 0.01 0.000 0.09 - 0.14
31-35 0.20 0.02 0.000 0.16 - 0.24
36-40 0.26 0.02 0.000 0.22 - 0.31
41-45 0.54 0.03 0.000 0.47 - 0.61
46-50 1.00
51-55 1.93 0.09 0.000 1.75 - 2.12
56-60 2.98 0.14 0.000 2.72 - 3.26
61-65 4.37 0.19 0.000 4.02 - 4.76
Socieconomic Index Self-employed in Agriculture, Forestry 1.00
Semi-skilled Workers in Agriculture, Forestry 1.09 0.26 0.708 0.68 - 1.75 Self-employed in Industry, Trade, Service sectors 0.90 0.19 0.599 0.60 - 1.35
Professionals 2.06 1.51 0.322 0.49 - 8.66
Routine Non-manual Occupations 0.93 0.13 0.588 0.71 - 1.21
Semi-skilled Workers 1.25 0.17 0.099 0.96 - 1.64
Service Occupations 1.14 0.16 0.355 0.87 - 1.49
Military
-No Identifiable Occupation 1.00 0.35 0.995 0.50 - 2.00
Students 0.87 0.12 0.304 0.67 - 1.13
Other 1.64 0.22 0.000 1.26 - 2.14
Parent Self-employed in Agriculture, Forestry 1.00
Socioeconomic Index Semi-skilled Workers in Agriculture, Forestry 1.17 0.08 0.023 1.02 - 1.33 Self-employed in Industry, Trade, Service sectors 1.13 0.06 0.030 1.01 - 1.26
Professionals 1.05 0.14 0.734 0.80 - 1.37
Executives/Managers 1.03 0.10 0.759 0.86 - 1.24
Routine Non-manual Occupations 1.20 0.06 0.000 1.09 - 1.32
Semi-skilled Workers 1.22 0.05 0.000 1.13 - 1.33
Service Occupations 1.47 0.11 0.000 1.26 - 1.70
Military 0.92 0.17 0.662 0.65 - 1.32
No Identifiable Occupation 0.89 0.48 0.825 0.31 - 2.57
Students 2.56 0.77 0.002 1.41 - 4.63
Other 1.33 0.07 0.000 1.19 - 1.48
Sextiles of Sex Ratio 1 1.00
2 1.05 0.05 0.299 0.96 - 1.15
3 0.97 0.05 0.551 0.88 - 1.07
4 1.03 0.06 0.648 0.92 - 1.15
5 0.97 0.06 0.552 0.86 - 1.08
6 0.96 0.06 0.455 0.85 - 1.08
N 86,276
Deaths 6,726
Table A-3: All-cause mortality results: Males and females, aged 18 and 19 in 1960, sex ratio (males: 18-22, females: 16-20) calculated within municipalities
Males
Covariates RR S.E. P-value 95% CI
Age 18-25 0.01 0.00 0.000 0.00 - 0.01
26-30 0.20 0.02 0.000 0.17 - 0.23
31-35 0.26 0.02 0.000 0.22 - 0.30
36-40 0.44 0.03 0.000 0.39 - 0.51
41-45 0.64 0.03 0.000 0.58 - 0.71
46-50 1.00
51-55 2.26 0.09 0.000 2.09 - 2.45
56-60 3.28 0.12 0.000 3.06 - 3.51
61-65 4.99 0.17 0.000 4.66 - 5.33
Socieconomic Index Self-employed in Agriculture, Forestry 1.00
Semi-skilled Workers in Agriculture, Forestry 1.13 0.08 0.078 0.99 - 1.30 Self-employed in Industry, Trade, Service sectors 1.20 0.12 0.056 1.00 - 1.45
Professionals 1.01 0.32 0.983 0.54 - 1.86
Routine Non-manual Occupations 0.99 0.07 0.912 0.87 - 1.13
Semi-skilled Workers 1.08 0.07 0.209 0.96 - 1.22
Service Occupations 1.51 0.16 0.000 1.22 - 1.87
Military 0.92 0.14 0.582 0.67 - 1.25
No Identifiable Occupation 1.50 0.32 0.060 0.98 - 2.29
Students 0.80 0.05 0.001 0.71 - 0.91
Other 1.11 0.07 0.099 0.98 - 1.25
Parent Self-employed in Agriculture, Forestry 1.00
Socioeconomic Index Semi-skilled Workers in Agriculture, Forestry 1.35 0.07 0.000 1.22 - 1.50 Self-employed in Industry, Trade, Service sectors 1.15 0.05 0.002 1.05 - 1.26
Professionals 1.02 0.10 0.873 0.84 - 1.23
Executives/Managers 1.13 0.08 0.082 0.98 - 1.30
Routine Non-manual Occupations 1.18 0.05 0.000 1.09 - 1.27
Semi-skilled Workers 1.26 0.05 0.000 1.18 - 1.35
Service Occupations 1.66 0.09 0.000 1.50 - 1.85
Military 1.03 0.15 0.822 0.78 - 1.38
No Identifiable Occupation 2.71 0.68 0.000 1.66 - 4.44
Students 0.99 0.34 0.988 0.51 - 1.94
Other 1.43 0.07 0.000 1.30 - 1.57
Sextiles of Sex Ratio 1 1.00
2 1.03 0.04 0.360 0.96 - 1.11
3 0.99 0.04 0.746 0.90 - 1.08
4 0.99 0.04 0.725 0.91 - 1.07
5 0.98 0.04 0.613 0.89 - 1.07
6 0.95 0.04 0.287 0.87 - 1.04
N 96,410
Deaths 11,631
Table A-3: (Continued)
Females
Covariates RR S.E. P-value 95% CI
Age 18-25 0.01 0.00 0.000 0.00 - 0.02
26-30 0.11 0.01 0.000 0.09 - 0.14
31-35 0.20 0.02 0.000 0.16 - 0.24
36-40 0.26 0.02 0.000 0.23 - 0.31
41-45 0.54 0.03 0.000 0.48 - 0.60
46-50 1.00
51-55 1.93 0.11 0.000 1.73 - 2.15
56-60 2.98 0.14 0.000 2.71 - 3.27
61-65 4.37 0.19 0.000 4.02 - 4.75
Socieconomic Index Self-employed in Agriculture, Forestry 1.00
Semi-skilled Workers in Agriculture, Forestry 1.10 0.26 0.684 0.69 - 1.75 Self-employed in Industry, Trade, Service sectors 0.90 0.19 0.628 0.60 - 1.36
Professionals 2.11 1.58 0.318 0.49 - 9.17
Routine Non-manual Occupations 0.93 0.13 0.621 0.71 - 1.22
Semi-skilled Workers 1.26 0.18 0.097 0.96 - 1.65
Service Occupations 1.14 0.16 0.349 0.87 - 1.50
Military
No Identifiable Occupation 1.00 0.35 0.992 0.50 - 2.00
Students 0.87 0.12 0.334 0.66 - 1.15
Other 1.64 0.23 0.000 1.25 - 2.16
Parent Self-employed in Agriculture, Forestry 1.00
Socioeconomic Index Semi-skilled Workers in Agriculture, Forestry 1.16 0.08 0.022 1.02 - 1.33 Self-employed in Industry, Trade, Service sectors 1.13 0.07 0.038 1.01 - 1.27
Professionals 1.05 0.16 0.765 0.78 - 1.41
Executives/Managers 1.03 0.10 0.773 0.85 - 1.23
Routine Non-manual Occupations 1.20 0.06 0.000 1.09 - 1.33
Semi-skilled Workers 1.23 0.05 0.000 1.13 - 1.33
Service Occupations 1.47 0.10 0.000 1.28 - 1.68
Military 0.93 0.16 0.682 0.66 - 1.31
No Identifiable Occupation 0.89 0.46 0.822 0.32 - 2.48
Students 2.52 0.78 0.003 1.38 - 4.62
Other 1.33 0.07 0.000 1.20 - 1.48
Sextiles of Sex Ratio 1 1.00
2 1.00 0.05 0.987 0.90 - 1.11
3 1.02 0.05 0.686 0.93 - 1.12
4 0.96 0.05 0.472 0.87 - 1.07
5 0.97 0.05 0.555 0.87 - 1.08
6 0.92 0.05 0.149 0.82 - 1.03
N 86,276
Deaths 6,726
Table A-4: All-cause mortality results: Males and females, aged 18 and 19 in 1960, sex ratio (males: 18-22, females: 16-20) calculated within parishes
Males
Covariates RR S.E. P-value 95% CI
Age 18-25 0.01 0.00 0.000 0.00 - 0.01
26-30 0.20 0.02 0.000 0.17 - 0.23
31-35 0.26 0.02 0.000 0.22 - 0.30
36-40 0.44 0.03 0.000 0.40 - 0.50
41-45 0.64 0.03 0.000 0.58 - 0.71
46-50 1.00
51-55 2.26 0.09 0.000 2.10 - 2.44
56-60 3.28 0.13 0.000 3.04 - 3.53
61-65 4.98 0.19 0.000 4.63 - 5.37
Socieconomic Index Self-employed in Agriculture, Forestry 1.00
Semi-skilled Workers in Agriculture, Forestry 1.13 0.08 0.079 0.99 - 1.31 Self-employed in Industry, Trade, Service sectors 1.20 0.12 0.056 0.99 - 1.45
Professionals 1.00 0.32 0.996 0.53 - 1.89
Routine Non-manual Occupations 0.99 0.07 0.917 0.87 - 1.13
Semi-skilled Workers 1.08 0.07 0.222 0.96 - 1.22
Service Occupations 1.51 0.16 0.000 1.23 - 1.87
Military 0.90 0.14 0.514 0.67 - 1.22
No Identifiable Occupation 1.51 0.34 0.064 0.98 - 2.33
Students 0.80 0.05 0.001 0.71 - 0.91
Other 1.11 0.07 0.099 0.98 - 1.25
Parent Self-employed in Agriculture, Forestry 1.00
Socioeconomic Index Semi-skilled Workers in Agriculture, Forestry 1.36 0.07 0.000 1.23 - 1.50 Self-employed in Industry, Trade, Service sectors 1.15 0.05 0.002 1.05 - 1.27
Professionals 1.02 0.11 0.869 0.83 - 1.25
Executives/Managers 1.14 0.09 0.087 0.98 - 1.32
Routine Non-manual Occupations 1.18 0.05 0.000 1.09 - 1.27
Semi-skilled Workers 1.26 0.05 0.000 1.17 - 1.35
Service Occupations 1.67 0.09 0.000 1.50 - 1.86
Military 1.04 0.15 0.796 0.79 - 1.36
No Identifiable Occupation 2.72 0.70 0.000 1.65 - 4.49
Students 0.99 0.37 0.983 0.48 - 2.05
Other 1.43 0.07 0.000 1.31 - 1.56
Sextiles of Sex Ratio 1 1.00
2 1.03 0.04 0.435 0.96 - 1.10
3 0.99 0.04 0.746 0.92 - 1.06
4 0.99 0.04 0.864 0.91 - 1.08
5 1.01 0.04 0.826 0.93 - 1.10
6 0.96 0.04 0.358 0.88 - 1.05
N 96,410
Deaths 11,631
Table A-4: (Continued)
Females
Covariates RR S.E. P-value 95% CI
Age 18-25 0.01 0.00 0.000 0.00 - 0.02
26-30 0.11 0.01 0.000 0.09 - 0.14
31-35 0.20 0.02 0.000 0.16 - 0.24
36-40 0.26 0.02 0.000 0.22 - 0.31
41-45 0.54 0.03 0.000 0.47 - 0.61
46-50 1.00
51-55 1.93 0.09 0.000 1.75 - 2.12
56-60 2.98 0.14 0.000 2.72 - 3.26
61-65 4.37 0.19 0.000 4.02 - 4.76
Socieconomic Index Self-employed in Agriculture, Forestry 1.00
Semi-skilled Workers in Agriculture, Forestry 1.09 0.26 0.705 0.69 - 1.75 Self-employed in Industry, Trade, Service sectors 0.90 0.19 0.601 0.60 - 1.35
Professionals 2.11 1.54 0.306 0.50 - 8.82
Routine Non-manual Occupations 0.93 0.13 0.590 0.71 - 1.21
Semi-skilled Workers 1.25 0.17 0.099 0.96 - 1.64
Service Occupations 1.14 0.16 0.353 0.87 - 1.49
Military
No Identifiable Occupation 1.00 0.35 0.989 0.50 - 2.00
Students 0.87 0.12 0.308 0.67 - 1.14
Other 1.64 0.22 0.000 1.26 - 2.14
Parent Self-employed in Agriculture, Forestry 1.00
Socioeconomic Index Semi-skilled Workers in Agriculture, Forestry 1.17 0.08 0.022 1.02 - 1.33 Self-employed in Industry, Trade, Service sectors 1.13 0.06 0.029 1.01 - 1.26
Professionals 1.05 0.14 0.722 0.80 - 1.37
Executives/Managers 1.03 0.10 0.741 0.86 - 1.24
Routine Non-manual Occupations 1.20 0.06 0.000 1.09 - 1.32
Semi-skilled Workers 1.23 0.05 0.000 1.13 - 1.33
Service Occupations 1.47 0.11 0.000 1.26 - 1.70
Military 0.93 0.17 0.687 0.65 - 1.32
No Identifiable Occupation 0.89 0.48 0.826 0.31 - 2.58
Students 2.56 0.78 0.002 1.41 - 4.63
Other 1.33 0.07 0.000 1.20 - 1.48
Sextiles of Sex Ratio 1 1.00
2 1.04 0.04 0.368 0.96 - 1.13
3 0.99 0.05 0.872 0.90 - 1.09
4 0.97 0.05 0.578 0.87 - 1.08
5 0.96 0.05 0.422 0.86 - 1.06
6 0.94 0.05 0.262 0.84 - 1.05
N 86,276
Deaths 6,726