DEMOGRAPHIC RESEARCH
A peer-reviewed, open-access journal of population sciences
DEMOGRAPHIC RESEARCH
VOLUME 32, ARTICLE 28, PAGES 843–876
PUBLISHED 21 APRIL 2015
http://www.demographic-research.org/Volumes/Vol32/28/ DOI: 10.4054/DemRes.2015.32.28
Research Article
Unstable work histories and fertility in France:
An adaptation of sequence complexity
measures to employment trajectories
Daniel Ciganda
c
2015 Daniel Ciganda.
2 Literature review 844 2.1 Economic uncertainty and fertility 844 2.2 Labor-market reform and the de-standardization of the life course 847 2.3 Are employment trajectories really less stable? 848 2.4 The uncertainty-fertility link in France 848 3 Questions and hypotheses 855 4 Data and methods 856
4.1 Data 856
4.2 Outline of the study 857
4.3 Software 858
4.4 Definition of instability 858 4.5 Classification of trajectories 860 4.6 Event history models 861 4.7 Completed fertility 863
5 Results 863
5.1 Effects of employment instability on fertility timing 863 5.2 Effects of employment instability on completed fertility 867
6 Discussion 870
References 872
Demographic Research: Volume 32, Article 28
Research Article
Unstable work histories and fertility in France: An adaptation of
sequence complexity measures to employment trajectories
Daniel Ciganda1
Abstract
BACKGROUND
The emergence of new evidence suggesting a sign shift in the long-standing negative correlation between prosperity and fertility levels has sparked a renewed interest in un-derstanding the relationship between economic conditions and fertility decisions. In this context, the notion ofuncertaintyhas gained relevance in analyses of low fertility. So far, most studies have approached this notion using snapshot indicators such as type of contract or employment situation. However, these types of measures seem to be falling short in capturing what is intrinsically a dynamic process.
OBJECTIVES
Our first objective is to analyze to what extent employment trajectories have become less stable over time, and the second, to determine whether or not employment instability has an impact on the timing and quantum of fertility in France.
Additionally, we present a new indicator of employment instability that takes into ac-count both the frequency and duration of unemployment, with the objective of comparing its performance against other, more commonly used indicators of economic uncertainty.
METHODS
Our study combines exploratory (Sequence Analysis) with confirmatory (Event History, Logistic Regression) methods to understand the relationship between early life-course uncertainty and the timing and intensity of fertility. We use employment histories from the three available waves of theEtude des relations familiales et intergenerationnelles (ERFI), a panel survey carried out by INED and INSEE which constitutes the base of the Generations and Gender Survey (GGS) in France.
RESULTS
Although France is characterized by strong family policies and high and stable fertility levels, we find that employment instability not only has a strong and persistent negative
effect on the final number of children for both men and women, but also contributes to fertility postponement in the case of men.
Regarding the timing of the transition to motherhood, we show how employment in-stability has a positive influence for women with more traditional views about the division of labor, and a negative influence among those with more egalitarian views.
1. Introduction
The first decade of the 21stcentury witnessed the emergence of a new narrative
regard-ing the relationship between livregard-ing standards and fertility outcomes. It was Myrskyl¨a, Kohler, and Billari (2009) who made the strongest, most explicit case for this regime-change hypothesis, showing how the historically negative correlation between develop-ment and fertility becomes positive after countries exceed a certain threshold of human development. This conclusion was supported by a series of papers published in the early and mid-2000s that showed that the correlation between women’s labor force participa-tion and fertility rates across countries had also reversed, and that countries with a higher number of women in the labor force also presented higher fertility rates (Ahn and Mira 2001; Adsera 2004; Kohler, Billari, and Ortega 2002).
Although evidence of the above-mentioned trends at the micro-level is more ambigu-ous than at the aggregate level (Matysiak and Vignoli 2008), the new narrative surround-ing economic conditions and family formation seems to have gained a foothold in fertility analyses, which has translated into an increased interest in the constraints and limitations driving fertility decisions in industrialized countries. In this context, the notion of un-certaintyhas become one of the most relevant factors for understanding contemporary family dynamics in the region (Kreyenfeld, Andersson, and Pailh´e 2012).
2. Literature review
2.1 Economic uncertainty and fertility
Until now, the most consistent evidence of a depressing effect has been found using ag-gregate unemployment rates (Guti´errez-Dom`enech 2008; Adsera 2011; Kravdal 2002), although analyses using individual-level data have also found significant effects in the same direction. De la Rica and Iza (2005) argue, for example, that the labor-market re-form that introduced flexible employment contracts in 1984 is one of the main reasons that ages-at-first-birth in Spain are among the highest in Europe. Blossfeld et al. (2005) pro-vides extensive macro- and micro-level evidence on how economic uncertainty negatively
Demographic Research: Volume 32, Article 28
affects the family formation process, especially in the case of men in male-breadwinner societies with weaker welfare systems.
Although there are clear indications of the effects of economic uncertainty on fertility, studies on the topic have encountered a serious challenge in disentangling income from substitution effects. According to Becker (1981), an increase in household income can produce two opposite effects on the demand for children: an income effect or a substitu-tion effect. Income growth will not only increase the demand for children, but also the indirect costs of forming a family in the form of income and career opportunities that parents have to give up in order to spend time with their children. Therefore, an income effect is observed when the demand for children is positively affected by an increase in income and a substitution effect is observed when the effect is negative.
The inability to distinguish between these two opposing effects partially explains the ambiguity of some of the results found in the literature, and also the relatively high fre-quency of studies reporting “no effects” of unemployment on fertility behaviors (Kravdal 2002; Kreyenfeld 2010; ¨Ozcan, Mayer, and Luedicke 2010).
On the other hand, researchers have been more successful in identifying effects when analyzing the dynamics between unemployment and fertility by educational attainment. On the whole, findings have supported the hypothesis that substitution effects are stronger among women with lower skill levels, while income effects predominate when the op-portunity costs of maternity are higher given larger investments in education (Schmitt 2012; Kreyenfeld 2010; Guti´errez-Dom`enech 2008; Del Bono, Weber, and Winter-Ebmer 2012).
Another more straightforward approach for disentangling income from substitution effects consists in establishing a distinction between women in traditional male-bread-winner arrangements and women in dual-earner households. Unfortunately, the informa-tion needed to establish this distincinforma-tion is often missing from surveys, and only a few studies have provided results accounting for the employment status of both members of the couple. These exceptions confirm that substitution effects prevail when women are caregivers (exclusively) while unemployment tends to depress or delay fertility when both members of the household work (Vignoli, Drefahl, and De Santis 2012; Baiz´an 2006).
A third limitation of the literature on economic uncertainty and fertility has been a general tendency to identify static measures of employment status (being unemployed or having a fixed-term contract) with employment instability. We consider the idea of instability to be an intrinsically dynamic one. Perceptions of instability are likely to be influenced not only by our own present situation, but also by information about previous experiences and future prospects.
In fact, a series of hypotheses regarding the effect of unemploymentdurationand per-sistencehaven been proposed, but only recently have researchers started to systematically test them.
unem-ployment could have a discouraging effect on women trying to establish themselves in the labor market and hence, a positive effect on fertility, Adsera (2004, 2011) on the other hand, argues that high and persistent unemployment will depress or delay childbearing, as it might lead to an unemployment trap. In a similar line Schmitt (2012) interprets the stronger delaying effect of unemployment found in Germany (when compared with the UK) in terms of the ‘threat of long-term unemployment’ that earlier fertility implies for German women. Although none of these authors test their hypotheses at the individual level, a few recent studies have incorporated information on employment trajectories, in an attempt to measure duration and persistence of unemployment.
¨Ozcan, Mayer, and Luedicke (2010) considered both thecumulative number of months of unemployment and the number of unemployment periods, but they do not find the hypothesized negative effect in the timing of the transition to parenthood in Germany. Oppositely, the accumulation of unemployment and non-permanent employment periods proved to be a relevant predictor of fertility timing in the case of France (Pailh´e and Solaz 2012).
Although the results are still ambiguous, these studies represent a movement towards a more refined measure of economic uncertainty. In this paper, we intend to take further steps in that direction.
The novelty of the approach lies in the use of the entire sequence information instead of a single event (or characteristic) and in the consideration of not only the number of transitions in and out of full-time employment but also thetimespent in these two states. Even though thecumulative number of months of unemploymentgives a rough measure of the time spent in unemployment, it does not provide any information on how this dura-tion is distributed, which could be a relevant dimension of an employment trajectory. For example, having an exceptional and relatively large unemployment period at the begin-ning of the employment career, followed by a stable trajectory of employment, is quite different in terms of its instability from a trajectory which is constantly interrupted by (shorter) spells out of the labor market.
On the other hand, thenumber of unemployment periodsprovides information about the frequency of interruptions without any detail on their duration. Our measure com-bines these two approaches by taking into account both the frequency and the duration of unemployment periods. We come back to this point in Section 4, but before that, we review some of the insights research has produced regarding the destabilization of em-ployment trajectories and regarding the relationship between uncertainty and fertility in France.
Demographic Research: Volume 32, Article 28
2.2 Labor-market reform and the de-standardization of the life course
Life-course research has demonstrated that the sequence of events that comprise individ-ual biographies in contemporary societies has become less stable, more complex and less collectively determined (Settersten Jr., Furstenberg, and Rumbaut 2008; Billari and Lief-broer 2010). This notion implies that ‘traditional’ biographies were highly structured by social institutions and characterized by a lower degree of uncertainty.
However, in the long run, this ideal type against which contemporary trajectories are measured was only dominant for a relatively short period of time (Br¨uckner and Mayer 2005). In fact, Fussell (2006) has shown that, in the case of the United States, the life course becamemorestandardized during the first half of the 20th century, thanks to the expansion of primary and secondary education and the regulation of the labor market. After a couple of decades (from the fifties to the seventies) of high institutionalization and standardization, individual biographies started to resemble one another less and less. This increased heterogeneity and complexity was generally interpreted as a result of four major processes originating in the second half of the 20th century: the expansion of tertiary education, the changes in women’s roles, the emergence of post-material values and the deregulation/flexibilization of labor markets.
In the 1980s, flexibilization became the keyword for governments and companies looking for a response to increased external competition within the context of a rapid internationalization of markets (Bukodi et al. 2008). Since then, OECD countries have converged and liberalized their rules on Employment Protection Legislation (EPL) which governs the hiring and firing process.
In this context, the European Commission has favored the implementation of the so-calledflexicurity approach: a combination of low EPL (to allow for market dynamism) with strong employment security (by means of active employment policies and high un-employment benefits). Although the theoretical advantages of this approach are still the subject of debate2, empirical analyses have shown that in practice, most European
coun-tries have introduced labor-market flexibility at the margin, easing the limitations on tem-porary forms of employment for labor market entrants, while leaving intact the regulation of permanent contracts. The average number of temporary employment as a percentage of the total dependent work for all workers in Europe (EU21) went from 5% in 1980 to 12% in 2012, with a similar increase (albeit from significantly higher levels) in the case of young workers (15–24), from 21% to 42% (OECD Employment Database 2013).
The result of this partial and targeted deregulation (Esping-Andersen and Regini 2000) has been a deepening of the segmentation of labor markets between the so-called insiders: unionized workers who hold permanent (protected) jobs with higher benefits, and theoutsiders, who spend a large fraction of their working life in precarious, unpro-tected positions. Young workers are over-represented among those with precarious
tracts and the unemployed, and have experienced the greater income losses as inequality has increased in OECD countries over the last decades (Esping-Andersen 2009).
2.3 Are employment trajectories really less stable?
Since the beginning of the deregulation process, the employment dimension of individual trajectories has been at the center of the debate and the notion that our relationship with the labor market has changed dramatically has become widespread. However, a review of the literature on employment trajectories provides contradictory evidence regarding the increase in instability over time.
Hollister (2011) presents an interesting review of the US case, finding consistent ev-idence of a decline in long-term tenure rates (one of the most commonly used measures) for men in the private sector since the 1980s, but an increase in employment stability for women in the same period. In Europe, there is a similar lack ofirrefutable stylized facts after the publication of several studies since the mid-nineties (Aeberhardt and Marbot 2013). However, using a 30-year-long employer-employee matched dataset, Aeberhardt and Marbot (2013) show that, in the case of France, the employment survival rates have decreased since the 1990s.
Along similar lines, Mills, Blossfeld, and Bernardi (2006) found that the careers of men in some European countries have remained more stable than expected. However, they also document the increasing economic uncertainty that younger workers face in the labor market, reinforcing the idea of a strong insider/outsider divide (Blossfeld et al. 2005).
In sum, although no clear trend towards generalized instability has been empirically observed in Europe or the US, the picture that emerges from the literature, suggests that the negative consequences of deregulation for individual careers are particularly visible in certain segments of the population that remain on the periphery of the labor market.
2.4 The uncertainty-fertility link in France
France is probably one of the most challenging countries in Europe for an analysis of the effects of uncertainty on fertility, given its relatively strong family policies, its relatively smaller obstacles to reconcile family and work and its relatively high and stable fertility rates. According to Toulemon, Pailh´e, and Rossier (2008) family policies implemented in the second half of the 20th century are the main reason that the Total Fertility Rate (TFR) has remained at around 2 births per woman in France, while most European countries have seen their fertility rates fall significantly below replacement level.
Along with the services provided by thecr`echesand´ecoles maternellesand the ac-cess to relatively generous parental leave, French parents can count on a series of in-cash
Demographic Research: Volume 32, Article 28
benefits, allowances and tax deductions that substantially reduce the costs of having chil-dren. The impact of these tools could be measured not only directly but also indirectly, through the reinforcement of positive attitudes towards families that are visible in the rel-atively high proportion of people preferring large families and the strong norm against childlessness (Toulemon, Pailh´e, and Rossier 2008).
However, and although not as strong as in other contexts, the delaying effects of economic uncertainty on family formation have been found in France. Kieffer et al. (2005) report a delay in first births for women experiencing unemployment, a result that is consistent with Pailh´e and Solaz (2012), who also findtimingeffects, but no effects on complete cohort fertility levels.
These results suggest that the strength of family policies and programs in France is enough to alleviate but not to completely suppress the effects of economic uncertainty on the family formation process, which is not surprising taking into account the magnitude of the changes in the French labor market.
At the beginning of the 80s, the percentage of temporary employment out of total de-pendent employment for young workers in France was about 13%, in 2012 it was 55.5%, with negligible differences between men and women (OECD Employment Database 2013). Although it could be argued that this rise might not necessarily mean an in-crease in the experience of periods of unemployment, especially if workers can jump from temporary contract to temporary contract and from job to job, our first descriptive results suggest otherwise. Figures 1 to 6 show the proportion of individuals in each labor market/education status at each age for three different cohorts: those entering the labor market between 1942 and 1961 (born between 1926–45), those that entered from 1962 to 1979 (born between 1946–63) and from 1980 to 1998 (born between 1964–82)3.
As expected the inactivestate covers a large proportion of women’s trajectories in the oldest cohort (Figure 2) while it is marginal in the case of men (Figure 1). Another interesting element to notice is the clear delimitation of themilitary serviceperiod, which indicates a relatively high degree of accuracy in the data.
Figure 1: Education-employment trajectories: men, 1942–1961 (born 1926–45) – France
Figure 1: Education-employment trajectories men 1942–1961 (born
1926–45) — France
8 http://www.demographic-research.org
Demographic Research: Volume 32, Article 28
Figure 2: Education-employment trajectories: women, 1942–1961 (born 1926–45) – France
Demographic Research: Volume 32, Article XX
Figure 2: Education-employment trajectories women 1942–1961 (born
1926–45) — France
The most prominent feature of the trajectories of the second cohort is the high degree
of stability of men’s trajectories. States other thanemployedorself-employedare
infre-quent. At the same time we see a convergence of the trajectories of men and women,
although women’s careers still present a higher proportion ofpart-time employmentand
inactivity.
Figure 3: Education-employment trajectories: men, 1962–1979 (born 1946–63) – France
Figure 3: Education-employment trajectories men 1962–1979 (born
1946–63) — France
10 http://www.demographic-research.org
Demographic Research: Volume 32, Article 28
Figure 4: Education-employment trajectories: women, 1962–1979 (born 1946–63) – France
Demographic Research: Volume 32, Article XX
Figure 4: Education-employment trajectories women 1962–1979 (born
1946–63) — France
The trajectories of most recent cohorts (Figures 5 & 6) show that at least part of the
deregulation process has translated into a higher frequency ofunemployment and
part-time employmentspells for both men and women. It is also interesting to note that most of the increase in the mentioned states is concentrated at the beginning of the employment trajectory, supporting previous findings which have shown particularly strong effects for labor market entrants (Aeberhardt and Marbot 2013).
Figure 5: Education-employment trajectories: men, 1980–1998 (born 1964–82) – France
Figure 5: Education-employment trajectories men 1980–1998 (born
1964–82) — France
12 http://www.demographic-research.org
Demographic Research: Volume 32, Article 28
Figure 6: Education-employment trajectories: women, 1980–1998 (born 1964–82) – France
Demographic Research: Volume 32, Article XX
Figure 6: Education-employment trajectories women 1980–1998 (born
1964–82) — France
3. Questions and hypotheses
In the previous section, we provided descriptive evidence that supports the claim that men’s and women’s employment trajectories have become increasingly volatile over time. The main question that we will try to answer now is whether this increased instability has an effect on the timing and the intensity of fertility.
As long as the male-breadwinner is still the norm, the neoclassical framework dis-cussed before predicts strong negative effects for men and positive effects for women. It is likely that part of the reduction in fertility for men occurs indirectly, through partner-ship formation. Men with a weaker commitment to the labor market might be perceived as less reliable candidates for the formation of a family, if, again, the male-breadwinner is still the norm (Kravdal 2002). Although this is still largely the case, for a country like
3. Questions and hypotheses
In the previous section, we provided descriptive evidence that supports the claim that men’s and women’s employment trajectories have become increasingly volatile over time. The main question that we will try to answer now is whether this increased instability has an effect on the timing and the intensity of fertility.
In addition, we have to take into account that our measure of employment instability provides a summary of both duration and persistence in unemployment, and therefore our hypothesis should relate to the mid-to-long-term perspective. Here we have to go back to the ‘discouragement’ vs ‘unemployment trap’ debate. The first perspective proposes that long-term unemployment might discourage women from having a strong attachment to the labor market, making substitution effects emerge (Kravdal 2002), while the second perspective highlights the enhanced need to postpone childbearing when the threat of staying on the margins of the labor market becomes more visible (Adsera 2004, 2011).
In agreement with ¨Ozcan, Mayer, and Luedicke (2010) we believe that these two per-spectives need not be contradictory but may be complementary, with each one explaining the reactions to instability of different sub-populations. It is likely that the discourage-ment effect will emerge faster among women who will accept a male-breadwinner ar-rangement or who have the option to have a looser attachment to the labor market. For women in a breadwinner role, a less stable attachment will more directly result in a re-duction in their probabilities of forming a family since they will attain to postpone or forgo fertility before they have the opportunity to land a position that matches their as-pirations and training. Nevertheless, this type of preference is not necessarily fixed over the life course and neither is the material possibility of prioritizing unpaid work within the household, which further complicates the specification of the direction of the effects among women.
For men the dynamics are supposed to be more straightforward. Failing to reach a stable and protected position at the core of the labor market should discourage fertility directly and indirectly (through union formation dynamics) for all education groups.
Finally, we need to consider the institutional and cultural context in France, where the norm against remaining childless is still strong and where part of the costs of childrearing are absorbed by the state due to strong family policies.
Taking all this into account, our hypotheses are:
H1: In the case of men, unstable employment trajectories will be associated with a higher age at first birth, a higher probability of remaining childless and a lower probability of achieving higher-order parities.
H2: Among women, the effects of an unstable employment trajectory will be more disruptive for those less likely to conform to a male-breadwinner arrangement.
4. Data and methods
4.1 Data
Our study combines exploratory (Sequence Analysis) with confirmatory (Event History, Logistic Regression) methods to understand the relationship between early life-course
Demographic Research: Volume 32, Article 28
uncertainty and the timing and intensity of fertility in France. It takes advantage of the recent availability of complete employment histories in the Etude des relations famil-iales et intergenerationnelles (ERFI) a panel survey carried out by INED and INSEE which constitutes the base of the Generations and Gender Survey (GGS) in France. The panel includes a sample of 18 to 79-year-old residents of metropolitan France. It con-tains not only detailed information on the reproductive history and fertility intentions of the interviewees, but also complete retrospective and prospective education/employment trajectories.
The first wave of the survey was carried out in 2005, and included 10,079 men and women representative of the French population. The second wave, from 2008, had 6,534 cases and the third, from 2011 has 5,781, (5,433 of whom also participated in the second wave and could then be integrated into our sample, given that the employment histories started to be collected from wave 2).
Our final sample consists of 6,492 individuals aged 20 to 85, 5,402 of whom partic-ipated in the three waves and 1,090 in the first two. Due to the subsequent reduction of the sample, the data is only representative of the 2005 French population after applying the weights that correct for attrition in the subsequent waves, which were used in all our analyses.
4.2 Outline of the study
In the first section, we use sequence analysis techniques to quantify the degree of in-stability of employment trajectories. Sequence analysis consists of a set of techniques originally developed by molecular biologists to find similar DNA patterns, and was in-troduced into the social sciences in the 1980s. These techniques are particularly useful for the study of life-courses because they provide a holistic understanding of individual trajectories, allowing for the combination of multiple dimensions of a biography in one sequence, which becomes the main unit of analysis.
For our analysis, the education/employment histories are combined to obtain a unique binary sequence for each observation in the sample. In ERFI, respondents are asked to provide information about the duration of each period (of at least three months) in which they were employed, in school, inactive, unemployed, etc. When respondents were simul-taneously in two or more states (employed and studying for example), they were asked to choose the activity on which they spent most time. The possible states in the employ-ment/education dimension are:
These sequence-states were reclassified in order to obtain the above-mentioned binary trajectories that represent the transitions from a state ofstabilityto one ofinstabilityand vice versa. In the case of men, the states included in the stable state are:Student; Military Service; Employed; Self Employed; On Leave; Help at home; Retired; Inactive; Sick; Other.While for menPart-Time Employed and Unemployedcomprise the unstable state, for women, however, we include only unemployment periods as instability, given the fact that in a large number of cases, part-time work is related to a decision of the individual or the household and not to an imposition of the labor market. In fact, the data used here shows that men working part-time are approximately one-fifth of the number of women with that type of work. Besides this, 70% of these men are doing it involuntarily, while in the case of women, the figure is about 50%.
States such as Sickor Inactiveare considered in the stable category given that we are trying to captureinvoluntaryandindefinitespells out of the labor market. The case of inactivity is particularly relevant, since its inclusion as a form of instability would have enhanced the problems of reverse causality between labor-market attachment and childbearing.
4.3 Software
Analyses were performed using R (The R Core Team 2005). The TraMineR package (Gabadinho et al. 2011) was used for sequence analysis and packages Survival (Therneau 1999) and EHA (Brostr¨om 2009) for survival analysis. All of them available at: http:// cran.r-project.org/.
4.4 Definition of instability
The measure of instability developed here is an adaptation of theComplexityindicator presented in Elzinga (2010), previously calledturbulence(Elzinga and Liefbroer 2007), which was developed to measure the uncertainty of sequences of equal length composed of multiple states. In our case, we have binary sequences (two possible states) and se-quences of different length (different ages at first birth, censored observations). There-fore, the definition of instability we use is:
I(x) = log2
Φ(x)s
2
t, max+ 1
s2
t+ 1
One important advantage of this indicator is that it considers not only the variation coming from number of state-changes in the trajectory, but also the differences in the duration of each state. The former is captured throughΦwhich represents the number
Demographic Research: Volume 32, Article 28
of sub-sequences4 in each sequence. The second part of the formula captures variation
coming from the duration of each period dividing the maximum potential variance given the number of states in the sequence(s2
t, max)over the observed variance of the times
spent in each state in the sequence (s2
t)5. The logic here is that the smaller the variance
of the time spent at each state (s2
t) the more difficult it is to predict in which state the
individual is going to be at any particular time, hence the higher the instability. This is a particularly interesting property, if we consider that instability might come from experiencing continuous periods out of the labor market, or a fewer number of periods but of longer duration.
The maximum variance is given by(d−1)(1−¯t)2, wheredis the number of different
states in the sequence6and¯tthe mean consecutive time spent in each state.
The binary logarithm is taken instead of the original measure, given the large increase inΦproduced by each additional transition between states.
In order to deal with the different lengths of the sequences in our sample, state-durations7were standardized by sequence length, expressing the length of each duration
inxas a percentage of the total length ofx.
According to this definition, an individual that experiences a relatively small number of transitions between states, but who spends a similar amount of time in the two states will be considered to have an unstable trajectory. Let us consider the two following sequences:
0 1 2 3 4 5 6 7 8 9 10 11
1 Employed
Unemployed/Part−time
0 1 2 3 4 5 6 7 8 9 10 11
1 Employed
Unemployed/Part−time
4A sequencezis a sub-sequence of a another sequencexif all the states ofzappear in x and in the same order.
The empty sequence is counted as a sub-sequence, hence the sequencea-b-ahas 7 sub-sequences: a,b, ab, ba, aba, aa, + the empty sequence.
5Here, one of the main differences is with the Complexity measure, which considers the variance of state-durations
6Unlike in the case of complexity (Turbulence in TraMineR) which definesdas the number of non-consecutive
states/the number of state-durations
7State-durations represent the amount of time spent in each non-consecutive state. The sequence: a-a-a-b-b-b-b
The first hypothetical sequenceais highly unstable, and has 11 transitions (609 sub-sequences) and no variance in the time spent at each state. The second, b, has only 1 transition (4 sub-sequences), which means this sequence is considered to be fairly stable if we were only counting spells. Our measure, however, givesI(a) = 19.5andI(b) = 12.2,
ais still more unstable thanb, butbwill still be considered highly unstable, given that half of the total length in this trajectory was spent in unemployment.
Although the measure has a series of advantages, it could lead to incorrect classifica-tion in the case of a sequence, which is predominantly (or entirely) spent in unemploy-ment or part-time employunemploy-ment. Such cases, however, are extremely rare in our data, and non-existent in the case of sequences entirely composed of unemployment.
4.5 Classification of trajectories
In this section, we assess the performance of our measure in classifying individual trajec-tories according to their instability level. Although the measure obtained is continuous, we decided to re-categorize it in three levels: Low, Medium and High Instability. Figure 7 presents the fifteen most representative sequences for each of the groups, for females. The height of each bar indicates the number of sequences in the group that each of these se-quences represent. The percentage in the x-axis is the total proportion of sese-quences within each group that these fifteen trajectories represent.
The group of Low Instabilityis composed of sequences with scores between 0 and 1, the most representative sequences here represent no unemployment/part-time employ-ment periods and they only differ by their length. Together, they represent 89% of the trajectories in the group, which is the larger part of the female sample since this is by far the category with more cases (n=3099).
The sequences in theMedium Instabilitycategory (n=340) have a score between 1 and 1.1. Most trajectories here present one relatively brief period of unemployment/part-time employment, which in general starts around age 23–25, probably coinciding with the end of formal education. These periods are labeledout, as in a transition out of a state of stability, and depicted in orange in the graphs. The total proportion of sequences in the group represented by these fifteen trajectories is significantly smaller than in the previous case, which is not surprising considering this group is composed by more complex trajec-tories. Substantively, we do not consider these careers to be significantly different than those with low instability, as it is unlikely that a brief unemployment period will have a dramatic impact on other life-course transitions – so for the reminder of the paper, we have decided to combine these two categories into one and to have it as a reference for analysis.
The group ofHigh Instability(n=288) corresponds to sequences with a score between 1.1 and the maximum instability observed in the group (21.9). These trajectories are
Demographic Research: Volume 32, Article 28
characterized by multiple transitions and/or long spells of unemployment and, in contrast to the two previous groups, they represent a real departure from a ‘normal’ (or normative) career, and we therefore focus on these individuals in the following analyses.
Figure 7: 15 most representatives sequences by instability level — Females (a) Low instability
Demographic Research: Volume 32, Article XX
height of each bar indicates the number of sequences in the group that each of these
se-quences represent. The percentage in the x-axis is the total proportion of sese-quences within
each group that these fifteen trajectories represent.
Figure 7:
Initial 15 Sequences by Instability Level
|
Females
(a) Low instability (b) Medium instability
(c) High instability
The group of
Low Instability
is composed of sequences with scores between 0 and
1, the most representative sequences here represent no unemployment/part-time
employ-ment spells and they only differ by their length. Together, they represent 89% of the
trajectories in the group, which is the larger part of the female sample since this is by far
the category with more cases (n=3099).
http://www.demographic-research.org 19
(b) Medium instability
Demographic Research: Volume 32, Article XX
height of each bar indicates the number of sequences in the group that each of these
se-quences represent. The percentage in the x-axis is the total proportion of sese-quences within
each group that these fifteen trajectories represent.
Figure 7:
Initial 15 Sequences by Instability Level
|
Females
(a) Low instability (b) Medium instability
(c) High instability
The group of
Low Instability
is composed of sequences with scores between 0 and
1, the most representative sequences here represent no unemployment/part-time
employ-ment spells and they only differ by their length. Together, they represent 89% of the
trajectories in the group, which is the larger part of the female sample since this is by far
the category with more cases (n=3099).
http://www.demographic-research.org 19
(c) High instability
Demographic Research: Volume 32, Article XX
height of each bar indicates the number of sequences in the group that each of these
se-quences represent. The percentage in the x-axis is the total proportion of sese-quences within
each group that these fifteen trajectories represent.
Figure 7:
Initial 15 Sequences by Instability Level
|
Females
(a) Low instability (b) Medium instability
(c) High instability
The group of
Low Instability
is composed of sequences with scores between 0 and
1, the most representative sequences here represent no unemployment/part-time
employ-ment spells and they only differ by their length. Together, they represent 89% of the
trajectories in the group, which is the larger part of the female sample since this is by far
the category with more cases (n=3099).
http://www.demographic-research.org 19
Demographic Research
: Volume 32, Article XX
height of each bar indicates the number of sequences in the group that each of these
se-quences represent. The percentage in the x-axis is the total proportion of sese-quences within
each group that these fifteen trajectories represent.
Figure 7:
Initial 15 Sequences by Instability Level
|
Females
(a)
Low instability
(b)
Medium instability
(c)
High instability
The group of
Low Instability
is composed of sequences with scores between 0 and
1, the most representative sequences here represent no unemployment/part-time
employ-ment spells and they only differ by their length. Together, they represent 89% of the
trajectories in the group, which is the larger part of the female sample since this is by far
the category with more cases (n=3099).
In Figure 8 we present the most unstable sequences for men and women to give the reader an idea of what highly turbulent trajectories look like. The most unstable trajectory among females presents eight unemployment periods in 17 years (from age 16 to age 33) while the most turbulent trajectory among men has 7 unemployment/part time spells. In the second case the “out” periods are longer as well as the trajectory, which goes from age 16 to age 43.
4.6 Event history models
After trajectories are classified according to their level of instability, the new variable obtained is introduced as a time-varying covariate in a Cox Regression Model predicting
the timing of first births. Instability is computed for each trajectory up to the last complete year of age before the first birth and up to age 45 / age censored for those that have not experienced the event. The measure is taken cumulatively (computed over the entire trajectory to that point) at each age, from age 16, and introduced as a binary variable identifying those withhighvs those withmediumandlowinstability.
Figure 8: Most unstable sequences for males and females
F
emales
16 17 18 19 20 2122 23 24 25 26 27 2829 30 31 32 33 3435 36 37 38 39 40 4142 43 44
1
Males
16 17 18 19 20 2122 23 24 25 26 27 2829 30 31 32 33 3435 36 37 38 39 40 4142 43
1
F
emales
16 17 18 19 20 2122 23 24 25 26 27 2829 30 31 32 33 3435 36 37 38 39 40 4142 43 44
1
Males
16 17 18 19 20 2122 23 24 25 26 27 2829 30 31 32 33 3435 36 37 38 39 40 4142 43
1
Separate models for males and females are presented, both including individuals from age 20 and older. In the models, we control for the age at which respondents fin-ished/dropped out of school, which is introduced as a binary variable: up to age 18 / after age 18. The effect of education is modeled in this way, assuming that the stronger differences in terms of the risk of a first birth are given by the pursuit of tertiary educa-tion. Taking into account our descriptive results in Section 2.2, we also control by cohort, distinguishing those born between 1976–1986, 1956–1975 and before 1955. Finally, to capture the direct effect of instability on the timing of fertility, we control for the experi-ence of a union, introduced as a time-varying covariate with values 0 before and 1 after the first cohabitation experience.
Given that we are also interested in comparing the performance of our measure against other common measures, we create a time-varying indicator of the employment status (in/out as defined in the instability measure) at each age, which we include as a control in our original model. We also create two time-varying trajectory variables: the cumulative number of periods out of full-time employment at each age and the cumulative number of months/years out of full-time employment at each age, although we compare these in separate models.
In the case of females, we also obtain separate models for women with a more con-servative view of gender values and women with more egalitarian perspectives. These
Demographic Research: Volume 32, Article 28
indicators derive from a question about giving priority to men when jobs are scarce. Al-though it has its limitations, it was the best of the few alternatives we had to try to separate women with different priorities regarding their attachment to the labor market and there-fore testing the ‘unemployment trap’ vs ‘discouragement’ hypothesis presented earlier.
Our final models are defined as follows:
hsex(t, x) =h0(t)∗exp(xβInstability+xβEdu+xβCohort+xβP artner) (1)
4.7 Completed fertility
To analyze the effects of employment instability on the intensity of fertility at the end of the reproductive period, we run a series of logistic regressions for which the outcome is the parity achieved by respondents at age 45: 0 vs 1+ children, 1- vs 2+, 2- vs 3+ and 3-vs 4+ children. In this case, we consider the instability until the age of first birth or until age 45 for those with no children.
We run models for each binary outcome and sex for a sample of age 45+, and we include the following controls:
* Age at completion/end of education (defined in the same way as in the Cox models). * Nationality European vs Other.
5. Results
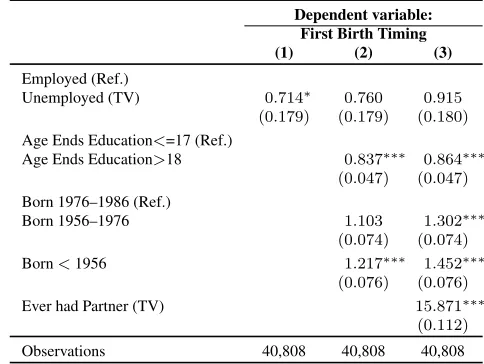
5.1 Effects of employment instability on fertility timing
Dependent variable: First Birth Timing
(1) (2) (3)
Employed (Ref.)
Unemployed (TV) 0.714∗ 0.760 0.915
(0.179) (0.179) (0.180)
Age Ends Education<=17 (Ref.)
Age Ends Education>18 0.837∗∗∗ 0.864∗∗∗
(0.047) (0.047)
Born 1976–1986 (Ref.)
Born 1956–1976 1.103 1.302∗∗∗
(0.074) (0.074)
Born<1956 1.217∗∗∗ 1.452∗∗∗
(0.076) (0.076)
Ever had Partner (TV) 15.871∗∗∗ (0.112)
Observations 40,808 40,808 40,808
Notes: ∗p<0.1;∗∗p<0.05;∗∗∗p<0.01
Table 2: Cox proportional hazard model estimates – Males
Dependent variable: First Birth Timing
(1) (2) (3)
High Instability (TV) 0.617∗∗∗ 0.649∗∗∗ 0.814∗∗
(0.116) (0.102) (0.102)
Age Ends Education<=17 (Ref.)
Age Ends Education>18 0.819∗∗∗ 0.857∗∗∗
(0.047) (0.047)
Born 1976–1986 (Ref.)
Born 1956–1976 1.108 1.297∗∗∗
(0.074) (0.074)
Born<1956 1.177∗∗ 1.424∗∗∗
(0.076) (0.076)
Ever had Partner (TV) 15.770∗∗∗ (0.112)
Observations 40,808 40,808 40,808
Notes: ∗p<0.1;∗∗p<0.05;∗∗∗p<0.01
It is worth noting, however, how the effect of high instability decreases after we con-trol for the existence of a cohabiting partner, showing that a sizable part of this effect on
Demographic Research: Volume 32, Article 28
fertility timing is indirect, through partnership formation. The direct effect is still sub-stantial, and having a highly unstable employment trajectory reduces the risk of having a first child by around 20% at each age. The effects of our control variables -education level, cohort and having a cohabiting partner- all go in the expected direction.
Figure 9 shows the observed and fitted survival curves by instability level for men born between 1956–1976, who left education before the age of 18. As concluded from the model results, those with unstable trajectories have a lower risk of having a first child at each age, more precisely, a 35% less risk than those with low to medium instability (model 2, Table 2).
Figure 9: Observed and fitted survival curves by instability level – Males, born 1956–1976, Age End Edu<18
(a) Observed
0.0
0.2
0.4
0.6
0.8
1.0
16 24.326 32.7 41 50
Instability Low−Med High
(b) Observed + Fitted
0.0
0.2
0.4
0.6
0.8
1.0
16 24.326 32.7 41 50
Instability Low−Med High
Even though our instability measure out-performs the usual employment status mea-sure, the question remains, how it does compare against other trajectory measures, such as the number of unemployment/part-time employment periods or the cumulative number of months out of full-time employment.
unemployment spell (regardless of its length). Analyses with categorical versions of these variables provided similar results (omitted).
The effects of the three measures are still significant, even after the inclusion of con-trols, which we take as confirmation that trajectory measures can provide more robust results than snapshot indicators. Regarding the decision between these different trajec-tory measures, it implies a trade-off between a more intuitive interpretation and a more accurate description of employment instability. We come back to this point in the discus-sion section.
Table 3: Cox proportional hazard model estimates – Males
Dependent variable: First Birth Timing
(1) (2) (3)
Cumulative instability (tv) 0.880∗∗∗ (0.039)
Cumulative number of “Out” periods (tv) 0.875∗∗∗ (0.042)
Cumulative duration of “Out” periods (tv) 0.880∗∗∗ (0.030)
Age Ends Education<=17 (Ref.)
Age Ends Education>18 0.825∗∗∗ 0.825∗∗∗ 0.818∗∗∗
(0.047) (0.047) (0.047)
Born 1976–1986 (Ref.)
Born 1956–1976 1.106 1.106 1.122
(0.074) (0.074) (0.074)
Born<1956 1.177∗∗ 1.176∗∗ 1.181∗∗
(0.077) (0.077) (0.076)
Observations 40,805 40,805 40,805
Note: Hazard ratios, SE on parentheses;∗p<0.1;∗∗p<0.05;∗∗∗p<0.01
Following the hypotheses presented earlier, we decided to run separate analyses for women with traditional and egalitarian gender values (see Section 4 for details on this indicator). The models in Table 4 show that while for women with more traditional gender values, the effect of both employment status and employment instability are positive, whereas for women with more egalitarian perspectives, the effects go from neutral to negative. Although they point in the right direction, these results are less robust than those reported for males, given the smaller number of cases resulting from the split in this sample and the intrinsically more complex dynamics between employment instability and fertility among women.
Demographic Research: Volume 32, Article 28
Table 4: Cox proportional hazard model estimates – Females
Dependent variable: First Birth Timing Traditional Egalitarian
Employed (ref.)
Unemployed (tv) 1.632∗∗ 0.758
(0.233) (0.187)
Low Instability (ref.)
High Instability (tv) 1.281 1.060
(0.161) (0.103)
Age Ends Education<=17 (ref.)
Age Ends Education>18 0.777∗∗∗ 0.653∗∗∗
(0.097) (0.056)
Born 1976–1986 (ref.)
Born 1956–1976 1.121 1.167∗∗
(0.160) (0.073)
Born<1956 1.292 1.189∗∗
(0.160) (0.082)
Had Partner (tv) 8.377∗∗∗ 9.562∗∗∗
(0.139) (0.111)
Observations 12,417 33,726
Note: ∗p<0.1;∗∗p<0.05;∗∗∗p<0.01
5.2 Effects of employment instability on completed fertility
Figure 10 and Figure 11 present the predicted probabilities of having at least 1, at least 2, at least 3, and at least 4 children for men and women aged 45 or older with a specific set of values on our control variables (for the full regression results see the appendix).
regression models, number of children – Males, Age>= 45,
Nationality=European, Age End Education<18
0.0 0.2 0.4 0.6 0.8
1 2 3 4
Number of Children
Predicted Probabilities
Instability
Low−Med High
Demographic Research: Volume 32, Article 28
Figure 11: Predicted probabilities and confidence intervals from logistic regression models, number of children – Females, Age>= 45,
Nationality=European, Age End Education<18
0.0 0.2 0.4 0.6 0.8
1 2 3 4
Number of Children
Predicted Probabilities
Instability
Low−Med High
some bias in our analyses, our results including and excluding part-time periods from our instability measure remained extremely close to each other (omitted).
6. Discussion
In the context of a remarkable shift in the long-standing negative correlation between economic prosperity and fertility levels, our study was set up to analyze the effects of employment instability on the timing of having a first child and on completed fertility in France.
Beyond our substantive conclusion, one of our primary goals was to develop an in-novative and more conceptually accurate measure of employment instability over the life course, taking advantage of the potentialities of sequence analysis. The proposed mea-sure has the advantage of incorporating the information contained in the entire education-employment trajectory of individuals, including the time spent in each state. Our analyses confirmed that measures that use more information provide more robust results than more simple indicators like employment status.
Differences were smaller when we tested our measure against other trajectory mea-sures, such as the cumulative number of periods or the cumulative number of months out of full-time employment. These alternative predictors provided similar ideas about the effect of employment instability, and they have the additional advantage of a more straightforward computation and interpretation. However, they only provide partial views of employment instability. The number of periods underestimates instability in cases with few unemployment periods of long duration, and the duration measure will underestimate instability when a relatively short duration hides multiple interruptions.
In relation to the substantive conclusions, we showed how unemployment and part-time job episodes in individuals’ biographies have increased over part-time, resulting in more complex and unstable trajectories for both men and women. We interpret this, at least partially, as the result of the process of flexibilization/deregulation of the French labor market, a process observed in most European countries over the last decades.
Our main objective was to assess the effects of this increased instability on the timing of first births and on the final number of children. According to our first hypothesis, we expected employment instability to be particularly disruptive in the case of men, affect-ing both the timaffect-ing and the intensity of fertility. Our results confirmed this hypothesis, showing that for men, unstable trajectories lead both to postponement of first births and to a higher probability of remaining childless or to having fewer children than those with a more stable relationship with the labor market.
Although the direct effects proved to be relatively strong, an important part of the influence of employment instability is indirect, affecting the union formation process. Individuals with turbulent careers certainly experience difficulties making decisions about
Demographic Research: Volume 32, Article 28
the right time to have children, but they might experience even stronger ones in finding a partner in the first place.
According to our second hypotheses, we expected employment instability to have less disruptive effects in the case of women with a preference for a traditional gendered division of labor. In general, our results for females were less robust and visible than those obtained for males, and we believe there are both substantive and methodological reasons behind this.
In fact, it is likely that the combination of a strong norm against childlessness and strong family policies make this effect less pronounced in France that in other contexts, at least for lower order parities. On the methodological side, the more complex nature of the analysed relationship among women presents a series of challenges. The main one continues to be the identification of women with different roles with respect to the division of paid and unpaid work within the household, which is not an easy task, since those roles might change over the life course and they might also be a function of an individual’s previous history in the labor market. Nevertheless, even a correct classifica-tion will probably not fully solve the problems of reverse causality between the degree of attachment to the labor market and childbearing.
In spite of that, and in spite of the fact that our attempts to identify different sub-populations of women were not perfect, the results obtained provided hints towards the confirmation of our hypothesis. We showed that employment instability has a positive in-fluence on the timing of fertility for women with more traditional views about the division of labor and a negative influence among those with more egalitarian views.
With respect to completed fertility, we found visible effects on the probabilities of having relatively larger families, but not on the probabilities of having one or two chil-dren, which makes sense considering the characteristics of the institutional and cultural context in France regarding family formation.
In reference to the discussion introduced in section 2.1, our results confirmed the rele-vance of analyzing thedurationandpersistenceof unemployment, hence, the advantages of trajectory over snapshot indicators. Our results also largely support the hypotheses put forth by Adsera (2004, 2011) or Schmitt (2012), regarding the negative effects of long-term unemployment on family formation transitions. As mentioned earlier, the op-posite effect, as proposed by Kravdal (2002), was only found among women with more traditional views regarding the division of paid and unpaid work.
References
Adsera, A. (2004). Changing fertility rates in developed countries. The impact of labor market institutions. Journal of Population Economics 17(1): 17–43. doi:10.1007/ s00148-003-0166-x.
Adsera, A. (2011). Where Are the Babies? Labor Market Conditions and Fertility in Europe. European Journal of Population/Revue europ´eenne de D´emographie27(1): 1–32.doi:10.1007/s10680-010-9222-x.
Aeberhardt, R. and Marbot, C. (2013). Evolution of Instability on the French Labour Market during the Last Thirty Years. Malakoff: Institut national de la statistique et des ´etudes ´economiques. Working Paper G 2013 / 08.
Ahn, N. and Mira, P. (2001). Job bust, baby bust?: Evidence from Spain. Journal of Population Economics14(3): 505–521. doi:10.1007/s001480100093.
Baiz´an, P. (2006). El efecto del empleo, el paro y los contratos temporales en la baja fe-cundidad espa˜nola de los a˜nos 1990.Revista espa˜nola de investigaciones sociol´ogicas 115(1): 223–253.
Becker, G.S. (1981). A Treatise on the Family. Cambridge, MA: Harvard University Press.
Billari, F.C. and Liefbroer, A.C. (2010). Towards a new pattern of transition to adulthood? Advances in Life Course Research15(2): 59–75.doi:10.1016/j.alcr.2010.10.003. Blossfeld, H.P., Klijzing, E., Mills, M., and Kurz, K. (eds.) (2005).Globalization,
Uncer-tainty and Youth in Society: The Losers in a Globalizing World. London: Routledge. Brostr¨om, G. (2009).Event History Analysis with R. Hoboken: CRC Press.
Br¨uckner, H. and Mayer, K.U. (2005). De-Standardization of the Life Course: What it Might Mean? And if it Means Anything, Whether it Actually Took Place? Advances in Life Course Research9: 27–53.doi:10.1016/S1040-2608(04)09002-1.
Bukodi, E., Ebralidze, E., Schmelzer, P., and Blossfeld, H.P. (2008). Struggling to become an insider: does increasing flexibility at labor market entry affect early careers? A theo-retical framework. In: Blossfeld, H.P., Bukodi, E., and Kurz, K. (eds.).Young Workers, Globalization and the Labor Market. Comparing Early Working Life in Eleven Coun-tries. London: Edward Elgar: 3–27.
Burroni, L. and Keune, M. (2011). Flexicurity: A conceptual critique.European Journal of Industrial Relations17(1): 75–91. doi:10.1177/0959680110393189.
De la Rica, S. and Iza, A. (2005). Career planning in Spain: Do fixed-term contracts delay marriage and parenthood? Review of Economics of the Household3(1): 49–73.
Demographic Research: Volume 32, Article 28
Del Bono, E., Weber, A., and Winter-Ebmer, R. (2012). Clash of Career and Family: Fertility Decisions after Job Displacement. Journal of the European Economic Asso-ciation10(4): 659–683. doi:10.1111/j.1542-4774.2012.01074.x.
Elzinga, C.H. (2010). Complexity of Categorical Time Series. Sociological Methods & Research38(3): 463–481.doi:10.1177/0049124109357535.
Elzinga, C.H. and Liefbroer, A.C. (2007). De-standardization of family-life trajectories of young adults: A cross-national comparison using sequence analysis.European Journal of Population/Revue europ´eenne de D´emographie23(3–4): 225–250.
Esping-Andersen, G. (2009). Incomplete Revolution: Adapting Welfare States to Women’s New Roles. Cambridge, MA: Polity Press.
Esping-Andersen, G. and Regini, M. (2000). Why Deregulate Labour Markets? Oxford: Oxford University Press. doi:10.1093/0199240523.001.0001.
Fussell, E. (2006). Structuring the transition to adulthood: An entropy analysis of the early life course in the United States, 1880 to 2000. Paper presented at the Population Association of America Annual Meeting, Los Angeles, CA, March 30–April 1 2006. Gabadinho, A., Ritschard, G., Mueller, N.S., and Studer, M. (2011). Analyzing and
visualizing state sequences in R with TraMineR.Journal of Statistical Software40(4): 1–37.
Guti´errez-Dom`enech, M. (2008). The impact of the labour market on the timing of mar-riage and births in Spain. Journal of Population Economics21(1): 83–110. doi:10. 1007/s00148-005-0041-z.
Hollister, M. (2011). Employment Stability in the U.S. Labor Market: Rhetoric versus Reality. Annual Review of Sociology37: 305–324. doi:10.1146/annurev-soc-081309-150042.
Kieffer, A., Marry, C., Meron, M., and Solaz, A. (2005). The case of France. Family formation in an uncertain labor market. In: Blossfeld, H.P., Klijzing, E., Mills, M., and Kurz, K. (eds.).Globalization, Uncertainty and Youth in Society. London: Routledge: 105–134.
Kohler, H.P., Billari, F.C., and Ortega, J.A. (2002). The Emergence of Lowest-Low Fertility in Europe During the 1990s.Population and Development Review28(4): 641– 680. doi:10.1111/j.1728-4457.2002.00641.x.
Kravdal, Ø. (2002). The impact of individual and aggregate unemployment on fertility in Norway.Demographic Research6(10): 263–294. doi:10.4054/DemRes.2002.6.10. Kreyenfeld, M. (2010). Uncertainties in female employment careers and the
doi:10.1093/esr/jcp026.
Kreyenfeld, M., Andersson, G., and Pailh´e, A. (2012). Economic Uncertainty and Fam-ily Dynamics in Europe. Rostock: Max Planck Institute for Demographic Research. (MPIDR Working Paper WP-2012-006).
Matysiak, A. and Vignoli, D. (2008). Fertility and Women’s Employment: A Meta-analysis. European Journal of Population/Revue europ´eenne de D´emographie24(4): 363–384.doi:10.1007/s10680-007-9146-2.
Mills, M., Blossfeld, H.P., and Bernardi, F. (2006). Globalization, uncertainty and men’s employment careers: a theoretical framework. In: Blossfeld, H.P., Mills, M., and Bernardi, F. (eds.).Globalization, Uncertainty and Men’s Careers: An International Comparison. London: Edward Elgar: 3–37.
Myrskyl¨a, M., Kohler, H.P., and Billari, F.C. (2009). Advances in development reverse fertility declines. Nature460(7256): 741–743. doi:10.1038/nature08230.
¨Ozcan, B., Mayer, K.U., and Luedicke, J. (2010). The impact of unemployment on the transition to parenthood. Demographic Research23(29): 807–846. doi:10.4054/ DemRes.2010.23.29.
Pailh´e, A. and Solaz, A. (2012). The influence of employment uncertainty on childbearing in France: A tempo or quantum effect? Demographic Research26(1): 1–40. doi:10. 4054/DemRes.2012.26.1.
Schmitt, C. (2012). Labour market integration, occupational uncertainty, and fertility choices in Germany and the UK. Demographic Research26(12): 253–292. doi:10. 4054/DemRes.2012.26.12.
Settersten Jr., R.A., Furstenberg, F.F., and Rumbaut, R.G. (2008). On the frontier of adulthood: Theory, research, and public policy. Chicago, IL: University of Chicago Press.
The R Core Team (2005). R: A Language and Environment for Statistical Computing. Vienna: the R Foundation for Statistical Computing.
Therneau, T.M. (1999). A Package for Survival Analysis in S. Rochester, MN: Mayo Foundation. http://www.mayo.vedu/hsr/vpeople/therneau/survival.ps.
Toulemon, L., Pailh´e, A., and Rossier, C. (2008). France: high and stable fertility. De-mographic Research19(16): 503–556.doi:10.4054/DemRes.2008.19.16.
Vignoli, D., Drefahl, S., and De Santis, G. (2012). Whose job instability affects the like-lihood of becoming a parent in Italy? A tale of two partners. Demographic Research 26(2): 41–62. doi:10.4054/DemRes.2012.26.2.
Demographic Research: Volume 32, Article 28
Appendix
Table A–1: Logistic regression models – final parity achieved – Males 45+
At least 1 Child At least 2 Children At least 3 Children At least 4 Children
Intercept 1.35 (0.07)∗∗∗ 0.31 (0.06)∗∗∗ −1.10 (0.07)∗∗∗ −2.13 (0.09)∗∗∗
High Instability −1.55 (0.25)∗∗∗ −1.30 (0.27)∗∗∗ −0.95 (0.36)∗∗ −0.79 (0.52)
Nationality - Other 0.55 (0.23)∗ 0.83 (0.19)∗∗∗ 1.00 (0.17)∗∗∗ 1.08 (0.20)∗∗∗
Age Ends Edu>18 −0.11 (0.13) 0.15 (0.11) 0.11 (0.12) −0.13 (0.17)
Deviance 2003.53 2601.60 2245.21 1362.68
Num. obs. 1795 1795 1795 1795
Note: ∗∗∗p <0.001,∗∗p <0.01,∗p <0.05,·p <0.1
Table A–2: Logistic regression models – final parity achieved – Females 45+ up to secondary education
At least 1 Child At least 2 Children At least 3 Children At least 4 Children
Intercept 1.63 (0.07)∗∗∗ 0.54 (0.05)∗∗∗ −0.70 (0.05)∗∗∗ −2.05 (0.08)∗∗∗
High Instability −0.30 (0.23) −0.25 (0.19) −0.75 (0.24)∗∗ −0.83 (0.42)∗
Nationality - Other −0.02 (0.22) 0.33 (0.18)· 0.78 (0.17)∗∗∗ 1.02 (0.20)∗∗∗
Age Ends Edu>18 −0.40 (0.12)∗∗∗ −0.16 (0.10) −0.42 (0.11)∗∗∗ −0.47 (0.17)∗∗
Deviance 2016.10 2824.18 2626.42 1453.13
Num. obs. 2307 2307 2307 2307