DEMOGRAPHIC RESEARCH
VOLUME 32, ARTICLE 51, PAGES 1409
−
1420
PUBLISHED 4 JUNE 2015
http://www.demographic-research.org/Volumes/Vol32/51/ DOI: 10.4054/DemRes.2015.32.51
Descriptive Finding
The causal effect of an additional sibling on
completed fertility:
An estimation of intergenerational fertility
correlations by looking at siblings of twins
Martin Kolk
©2015 Martin Kolk.
This open-access work is published under the terms of the Creative Commons Attribution NonCommercial License 2.0 Germany, which permits use, reproduction & distribution in any medium for non-commercial purposes, provided the original author(s) and source are given credit.
2 Explanations for intergenerational correlations in fertility 1410
3 Research design, methods, and data 1411
4 Results 1413
5 Conclusion 1416
6 Acknowledgments 1417
Descriptive Finding
The causal effect of an additional sibling on completed fertility:
An estimation of intergenerational fertility correlations by looking at
siblings of twins
Martin Kolk1
Abstract
BACKGROUND
Intergenerational transmission of fertility – a correlation between number of siblings and adult fertility – has been consistently demonstrated in developed countries. However, there is only limited knowledge of the causes of this correlation.
OBJECTIVE
This study estimates the effect of an exogenous increase of number of siblings on adult fertility for men and women using Swedish register data. The effect of an additional sibling is estimated from the birth of younger twin siblings by means of instrumental variable methods.
RESULTS
The study shows that there is no clear effect of an exogenous increase in the number of siblings on completed fertility. There is some evidence that an additional sibling is associated with lower fertility in adulthood.
CONCLUSIONS
The results indicate that intergenerational transmission of fertility is due to factors shared between parents and children such as preferences or socioeconomic status, not directly related to the size of the family of upbringing. There is no effect on fertility in adulthood of having an additional sibling per se.
1 Stockholm University Demography Unit, Department of Sociology, Stockholm University, Sweden.
1. Introduction
An association can be found between the fertility rates of consecutive generations in contemporary populations. This association has been found consistently in developed nations, and appears to increase over time (Anderton et al. 1987; Dahlberg 2013; Murphy 2013). In three-generation families, associations can also be found between the fertility of the oldest and youngest generation, independent of the fertility of the intermediate generation (Kolk 2014a). While this association between number of siblings and number of children is widely documented, there has been less progress in understanding the causes of these associations. The current study adds to our knowledge of the origins of fertility associations by looking at the exogenous effect of a change in number of siblings that a person grew up with. Using an instrumental variable (hereafter IV) approach, I estimate the effect of an additional sibling on completed fertility, by means of a twin birth in the family of origin. It is thus possible to distinguish the role of factors that should be independent of a twin birth (such as parental socioeconomic status, parental fertility preferences, and ethnic or religious values) from the effect of growing up with an additional sibling (such as a change related to the home environment, and potentially decreased parental resources during upbringing). This approach is often used in labor economics to find causal estimates of the impact of family size on various outcomes (e.g., Rosenzweig and Wolpin 1980; Angrist, Lavy, and Schlosser 2010; Baranowska-Rataj, Barclay, and Kolk 2015), and has previously been applied successfully to socioeconomic outcomes using Nordic registers (e.g., Black, Devereux, and Salvanes 2005; Åslund and Grönqvist 2010).
2. Explanations for intergenerational correlations in fertility
The most common explanation of fertility continuities is that parents transmit their values and preferences to their children (Johnson and Stokes 1976; Anderton et al. 1987). These values could be, for example, related to the timing of childbearing or ideal number of children, but also be related to factors such as preference for leisure, or a preference toward or against marriage. Socioeconomic status is similarly associated across generations, and different socioeconomic groups differ in childbearing patterns. This could plausibly explain intergenerational transmission of fertility, though socioeconomic continuities appear to be less important than factors not associated with socioeconomic status (Dahlberg 2013; Kolk 2014b).
extent to which one values a large family is dependent on the number of siblings a person experienced during childhood. Having an additional sibling could also be associated with a different socioeconomic outcome due to decreased parental resources (Becker and Lewis 1974; Angrist, Lavy, and Schlosser 2010), which could affect fertility (Andersson 2000). However, there appears to be no causal effect of having an additional sibling on socioeconomic status in Sweden when using a twin IV approach (Åslundand Grönqvist 2010).
3. Research design, methods, and data
The idea behind using twins as a source of exogenous variation in family size is that a parental twin birth is a (mostly) random physiological event, which has a direct effect on the number of siblings. Thus, it is possible to mimic a natural experiment in which one group was “treated” with a larger number of siblings, compared to a “control” group that did not experience a twin birth. Research has shown that twins themselves differ from singletons in socioeconomic and fertility outcomes (e.g., Tollebrant 2011). A twin birth may also cause a change in the home environment, so there might be a select group of parents who have additional children after a twin birth. In order to avoid this problem I will use a solution proposed by Black, Devereux, and Salvanes (2005), and only look at older siblings who may or may not experience a twin birth. Thus, the “treated” individuals consist of older siblings who experience a later twin birth.
The key assumption of an IV design is that the instrument is uncorrelated with the outcome variable. This assumption is overall robust for the research design of this study, and has been used in a large number of IV-twin designs (e.g., Jacobsen, Pearce, and Rosenbloom 1999; Black, Devereux, and Salvanes 2005; Åslund and Grönqvist 2010; Holmlund, Rainer, and Siedler 2013). However, there are some potential biases that could violate this assumption. Most importantly, it is known that dizygotic twinning increases with age. Fortunately, this can be controlled for in the analysis. Another such possibility is in-vitro fertilization (IVF): twin births are more common in pregnancies following IVF. However, in vitro-fertilization was not used when the parental generation in the study was having children. A common concern in instrumental variables studies is weak instruments (in this case, the effect of a twin birth on parental family size). A twin birth is a very strong predictor of parental family size. On average, a multiple birth in the parental generation increased the eventual parental family size by 0.78-0.85 children (see Table 1). F-statistics are consistently above 1000, indicating a very strong instrument (not shown).
preferences. Different parity progression ratios based on sex composition of children are found in developed countries (e.g., Andersson et al. 2006; Kolk and Schnettler 2013). This approach is used in ongoing work examining intergenerational transmission of fertility (Cools and Hart 2014). This approach, unlike a twin IV, estimates the effect of an additional planned (and wanted) birth instead of an unplanned additional sibling, which may differ in how it affects the experience of an additional sibling (e.g., the general satisfaction of the parents may differ).
The effect of a twin sibling on eventual family size is estimated using two-stage least squares (2SLS) regressions. In the first stage the effect of a twin birth on parental fertility is estimated. In the second stage, emulating other studies on intergenerational transmission of fertility, the fertility of children is regressed on their parents’ fertility, but parental fertility is estimated only from the first stage estimate of an exogenous increase in fertility, due to a parental twin birth.
My instrumental variable, an additional sibling in the family due to a twin birth, is based on index persons whose mothers gave birth to twins. I exclude twins themselves from the sample, as twins have different fertility patterns, and only examine siblings of twins. I only look at siblings born before a twin birth, excluding non-twin siblings born after a twin birth. I examine the effect of a twin birth at different parities (parities 2 to 5) in four different samples. The effect of a twin birth on eventual family size is larger if the twin is born at a later parity, as then the probability that parents ‘overshoot’ their desired number of children is higher. In order to assure that the study population is identical for index persons with and without twin siblings, and that the only difference between the groups is the instrument, correlations are only estimated for individuals having at least 2, 3, 4 and 5 siblings (corresponding to samples with a possible twin birth at parity 2, 3, 4, and 5), respectively (cf. Black, Devereux, and Salvanes 2005). The different samples will be referred to by birth order of included members of the younger generation (e.g.,first-born for the sample looking at a twin birth at parity 2 in families with at least 2 children,first- and second-born for a twin birth at parity 3, etc.). A large number of studies using Scandinavian data have evaluated whether the twin IV approach is biased by socioeconomic characteristics net of parental age, and have not found such effects (e.g., Black, Devereux, and Salvanes 2005; Hirvonen 2009; Åslund and Grönqvist 2010; Black, Devereux, and Salvanes 2010; Holmlund, Rainer, and Siedler 2013). 2SLS and OLS models additionally include year dummies and covariates on maternal age.
women. 1940 is the earliest cohort for which reliable estimates of sibling size and birth order is available (Swedish registers cover births starting from 1932). The final cohorts are chosen in order to make sure that all members of the younger generation have reached age 45 at the end of the study period, and with high reliability can be assumed to have completed their fertility. This generation is linked to their parents through the Swedish multigenerational register. The quality of the register is high. Information on the mother is available for virtually the entire cohort; missing information on fathers is less than 5%. Both parents and siblings must have been be alive and registered at some point after 1960 in order to be included in the sample. The number of siblings for the younger generation is calculated from the number of full-siblings (sharing the same mother and father) of the index sibling in the registers.
4. Results
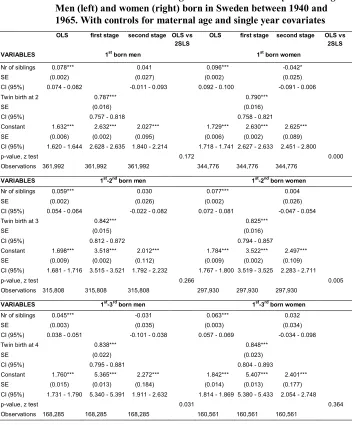
Table 1: Effect of size of family of origin on number of children, using twin births as a measure of an exogenous increase in family size of origin. Men (left) and women (right) born in Sweden between 1940 and 1965. With controls for maternal age and single year covariates
OLS first stage second stage OLS vs 2SLS OLS first stage second stage OLS vs 2SLS
VARIABLES 1st born men 1st born women
Nr of siblings 0.078*** 0.041 0.096*** -0.042*
SE (0.002) (0.027) (0.002) (0.025)
CI (95%) 0.074 - 0.082 -0.011 - 0.093 0.092 - 0.100 -0.091 - 0.006
Twin birth at 2 0.787*** 0.790***
SE (0.016) (0.016)
CI (95%) 0.757 - 0.818 0.758 - 0.821
Constant 1.632*** 2.632*** 2.027*** 1.729*** 2.630*** 2.625***
SE (0.006) (0.002) (0.095) (0.006) (0.002) (0.089)
CI (95%) 1.620 - 1.644 2.628 - 2.635 1.840 - 2.214 1.718 - 1.741 2.627 - 2.633 2.451 - 2.800
p-value, z test 0.172 0.000
Observations 361,992 361,992 361,992 344,776 344,776 344,776
VARIABLES 1st-2nd born men 1st-2nd born women
Nr of siblings 0.059*** 0.030 0.077*** 0.004
SE (0.002) (0.026) (0.002) (0.026)
CI (95%) 0.054 - 0.064 -0.022 - 0.082 0.072 - 0.081 -0.047 - 0.054
Twin birth at 3 0.842*** 0.825***
SE (0.015) (0.016)
CI (95%) 0.812 - 0.872 0.794 - 0.857
Constant 1.698*** 3.518*** 2.012*** 1.784*** 3.522*** 2.497***
SE (0.009) (0.002) (0.112) (0.009) (0.002) (0.109)
CI (95%) 1.681 - 1.716 3.515 - 3.521 1.792 - 2.232 1.767 - 1.800 3.519 - 3.525 2.283 - 2.711
p-value, z test 0.266 0.005
Observations 315,808 315,808 315,808 297,930 297,930 297,930
VARIABLES 1st-3rd born men 1st-3rd born women
Nr of siblings 0.045*** -0.031 0.063*** 0.032
SE (0.003) (0.035) (0.003) (0.034)
CI (95%) 0.038 - 0.051 -0.101 - 0.038 0.057 - 0.069 -0.034 - 0.098
Twin birth at 4 0.838*** 0.848***
SE (0.022) (0.023)
CI (95%) 0.795 - 0.881 0.804 - 0.893
Constant 1.760*** 5.365*** 2.272*** 1.842*** 5.407*** 2.401***
SE (0.015) (0.013) (0.184) (0.014) (0.013) (0.177)
CI (95%) 1.731 - 1.790 5.340 - 5.391 1.911 - 2.632 1.814 - 1.869 5.380 - 5.433 2.054 - 2.748
p-value, z test 0.031 0.364
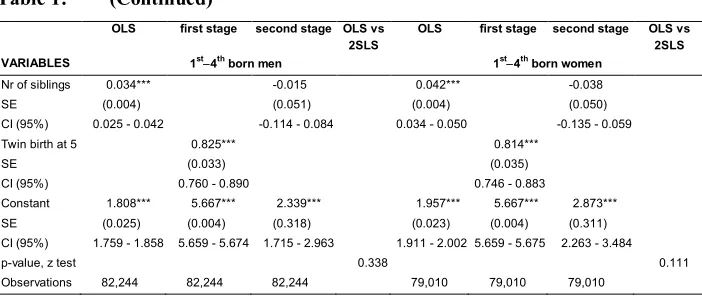
Table 1: (Continued)
OLS first stage second stage OLS vs 2SLS OLS first stage second stage OLS vs 2SLS VARIABLES 1st−4th born men 1st−4th born women
Nr of siblings 0.034*** -0.015 0.042*** -0.038
SE (0.004) (0.051) (0.004) (0.050)
CI (95%) 0.025 - 0.042 -0.114 - 0.084 0.034 - 0.050 -0.135 - 0.059
Twin birth at 5 0.825*** 0.814***
SE (0.033) (0.035)
CI (95%) 0.760 - 0.890 0.746 - 0.883
Constant 1.808*** 5.667*** 2.339*** 1.957*** 5.667*** 2.873***
SE (0.025) (0.004) (0.318) (0.023) (0.004) (0.311)
CI (95%) 1.759 - 1.858 5.659 - 5.674 1.715 - 2.963 1.911 - 2.002 5.659 - 5.675 2.263 - 3.484
p-value, z test 0.338 0.111
Observations 82,244 82,244 82,244 79,010 79,010 79,010
*** p<0.01, ** p<0.05, * p<0.1, Source: Swedish administrative registers
To answer the main research question, and to isolate the role of parental factors only indirectly correlated with their number of children (such as values, socioeconomic background, religion etc.) from the specific effect of having an extra sibling, the first stage estimates are used to estimate the second stage equation. As can be seen in Table 1, estimates from the second stage are in all samples lower than baseline OLS results. For a first-born sample OLS measures on fertility correlations are 0.078 (men) and 0.096 (women), compared to 0.041 (men) and -0.042 (women) for 2SLS estimates from an exogenous twin sibling. For later parities, men continue to show lower OLS correlations do than women, but higher 2SLS estimates (with the exception of the sample with 1st-3rd born) though the gender differences in 2SLS estimates are not
significantly different. Only some of the second stage equations show a statistically significant difference from the OLS results after performing a z-test of the form (b1
-b2)/(SEb12+SEb22)0.5, see Clogg, Petkova, and Haritou (1995). The only IV estimates
that approach a statistically significant difference from a null-effect are first-born women experiencing twin siblings at parity 2.
5. Conclusion
Overall, the use of twin births as an exogenous source for an increase in the number of siblings shows evidence for a weak or null effect of an additional sibling in itself. This finding is of importance in understanding the causes of intergenerational fertility correlations. The results indicate that the main reason for intergenerational fertility correlations is not the experience of growing up in a larger family per se, as has been suggested by some researchers (e.g., Duncan et al. 1965). Instead, the main explanation for fertility correlations in developed countries appears to be related to intergenerational correlations in other factors that parents and their children share (e.g., fertility preferences, contraceptive preferences, marriage timing), which are not directly associated with the number of siblings as such. Similarly, shared socioeconomic traits could also be important, though this appears to be of less importance in Sweden (Kolk 2014b). Characteristics shared within a larger sub-population, such as religious values, ethnic characteristics, and regional patterns could also be the source of fertility correlations. It should be noted that while fertility correlations can be described as non-causal, in the sense that they are not directly related to the size of family of origin, this does not alter the importance of fertility correlations as a demographic phenomenon. The effect of fertility correlations on population dynamics is due to the correlations in themselves, regardless of the source of such correlations (e.g., Murphy and Wang 2003; Kolk, Cownden, and Enquist 2014).
6. Acknowledgments
References
Andersson, G. (2000). The impact of labour-force participation on childbearing behaviour: pro-cyclical fertility in Sweden during the 1980s and the 1990s. European Journal of Population 16(4): 293–333. doi:10.1023/A:100645 4909642.
Andersson, G., Hank, K., Rønsen, M., and Vikat, A. (2006). Gendering family composition: Sex preferences for children and childbearing behavior in the Nordic countries. Demography 43(2): 255–267. doi:10.1353/dem.2006.0010. Anderton, D.L., Tsuya, N.O., Bean, L.L., and Mineau, G.P. (1987). Intergenerational
transmission of relative fertility and life course patterns. Demography 24(4): 467–480. doi:10.1353/dem.2006.0010.
Angrist, J., Lavy, V., and Schlosser, A. (2010). Multiple experiments for the causal link between the quantity and quality of children. Journal of Labor Economics 28(4): 773–824. doi:10.1086/653830.
Åslund, O. and Grönqvist, H. (2010). Family size and child outcomes: Is there really no trade-off? Labour Economics 17(1): 130–139. doi:10.1016/j.labeco.2009.05.003. Baranowska-Rataj, A., Barclay, K.J., and Kolk, M. (2015). The effect of the number of siblings on adult mortality: Evidence from Swedish registers. Stockholm, Sweden: Stockholm University Demography Unit (Stockholm Research Reports in Demography 2015:2).
Becker, G.S. and Lewis. H.G. (1974). Interaction between quantity and quality of children. In: Schultz, T.W. (ed.), Economics of the family: Marriage, children, and human capital. Cambridge, MA: National Bureau of Economic Research. 81–90.
Black, S.E., Devereux, P.J., and Salvanes, K.G. (2005). The more the merrier? The effect of family size and birth order on children's education. The Quarterly Journal of Economics 120(2): 669–700. doi:10.1162/0033553053970179. Black, S.E., Devereux, P.J., and Salvanes, K.G. (2010). Small family, smart family?
Family size and the IQ scores of young men. Journal of Human Resources 45(1): 33–58. doi:10.1353/jhr.2010.0001.
Cools, S. and Hart, R.K. (2014). The effect of childhood family size on fertility in adulthood. New evidence from IV estimation. Oslo, Norway: Statistics Norway (Discussion paper no. 802).
Dahlberg, J. (2013). Family influence in fertility: A longitudinal analysis of sibling correlations in first birth risk and completed fertility among Swedish men and women. Demographic Research 29(9): 233–246. doi:10.4054/DemRes.2013. 29.9.
Duncan, O.D., Freedman, R., Coble, J.M., and Slesinger, D.P. (1965). Marital fertility and size of family of orientation. Demography 2(1): 508–515. doi:10.2307/ 2060135.
Hirvonen, L. (2009). The effect of children on earnings using exogenous variation in family size: Swedish evidence. Stockholm, Sweden: Swedish Institute for Social Research (Working Paper No. 2/2009).
Holmlund, H., Rainer, H., and Siedler, T. (2013). Meet the parents? Family size and the geographic proximity between adult children and older mothers in Sweden. Demography 50(3): 903–931. doi:10.1007/s13524-012-0181-1.
Jacobsen, J.P., Pearce, J.W., and Rosenbloom, J.L. (1999). The effects of childbearing on married women's labor supply and earnings: using twin births as a natural experiment. Journal of Human Resources 34(3): 449–474. doi:10.2307/146376. Johnson, N.E. and Stokes, C.S. (1976). Family size in successive generations: The
effects of birth order, intergenerational change in lifestyle, and familial satisfaction. Demography 13(2): 175–187. doi:10.2307/2060799.
Kolk, M. (2014a). Multigenerational transmission of family size in contemporary Sweden. Population Studies 68(1): 111–129. doi:10.1080/00324728.2013.8191 12.
Kolk, M. (2014b). Understanding Transmission of Fertility Across Multiple Generations – Socialization or Socioeconomics? Research in Social Stratification and Mobility 35: 89–103. doi:10.1016/j.rssm.2013.09.006.
Kolk, M., Cownden, D., and Enquist, M. (2014). Correlations in fertility across generations: can low fertility persist? Proceedings of the Royal Society B: Biological Sciences 281(1779): 20132561. doi:10.1098/rspb.2013.2561.
Murphy, M. (1999). Is the relationship between fertility of parents and children really weak? Social Biology 46(1-2): 122–145. doi:10.1080/19485565.1999.9988991. Murphy, M. (2013). Cross-national patterns of intergenerational continuities in
childbearing in developed countries. Biodemography and social biology 59(2): 101–126. doi:10.1080/19485565.2013.833779.
Murphy, M. and Wang, D. (2001). Family-level continuities in childbearing in low-fertility societies. European Journal of Population 17(1): 75–96. doi:10.1023/A:
1010744314362.
Murphy, M. and Wang, D. (2003). The impact of intergenerationally-transmitted fertility and nuptuality on population dynamics in contemporary populations. In: Rodgers, J.L. and Kohler, H.-P. (eds.). Biodemography of Human Reproduction and Fertility. Boston: Kluwer Academic Publishers. 209–228.
doi:10.1007/978-1-4615-1137-3_11.
Rosenzweig, M.R. and Wolpin, K.I. (1980). Testing the quantity-quality fertility model: the use of twins as a natural experiment. Econometrica 48(1): 227. doi:10.2307/ 1912026.