University of New Orleans University of New Orleans
ScholarWorks@UNO
ScholarWorks@UNO
University of New Orleans Theses and
Dissertations Dissertations and Theses
5-18-2007
Steganalysis Techniques: A Comparative Study
Steganalysis Techniques: A Comparative Study
Swaroop Kumar Pedda Reddy
University of New Orleans
Follow this and additional works at: https://scholarworks.uno.edu/td
Recommended Citation Recommended Citation
Pedda Reddy, Swaroop Kumar, "Steganalysis Techniques: A Comparative Study" (2007). University of New Orleans Theses and Dissertations. 562.
https://scholarworks.uno.edu/td/562
This Thesis is protected by copyright and/or related rights. It has been brought to you by ScholarWorks@UNO with permission from the rights-holder(s). You are free to use this Thesis in any way that is permitted by the copyright and related rights legislation that applies to your use. For other uses you need to obtain permission from the rights-holder(s) directly, unless additional rights are indicated by a Creative Commons license in the record and/or on the work itself.
Steganalysis Techniques: A Comparative Study
A Thesis
Submitted to the Graduate Faculty of the
University of New Orleans
in partial fulfillment of the
requirements for the degree of
Master of Science
in
Computer Science
by
Swaroop Kumar Pedda Reddy
B.E Bangalore University, INDIA, 2001
Acknowledgements
I would like to express my gratitude to my advisor Dr. Golden Richard III for his support,
constant availability, encouragement and valuable advices.
I would also like to thank Dr. Vassil Roussev for his support and always being there for guidance.
Table of Contents
List of Figures... iv
List of Tables ... iv
Abstract...v
1 Introduction...1
1.1 Steganography...1
1.2 History...1
1.3 Cryptography vs. Steganography...2
1.4 Steganography vs. Watermarking...2
1.5 Basic Embedding and Extraction process ...3
1.6 Terminology...3
1.7 Modern Steganography ...4
1.8 Steganography in Images ...4
1.9 Thesis Organization ...7
2 Steganalysis...8
3 Related Work ...10
4 Our Study ...13
4.1 Overview ...13
4.2 Problem Statement...13
4.3 Contribution ...13
4.4 Steganalysis Techniques compared ...14
4.5 Embedding methods considered...15
4.6 Procedure...15
5 Data preparation...17
5.1 Overview ...17
5.2 Procedure...17
5.3 Details...19
5.4 Summary of Data Sets ...20
6 Implementation Details ...22
6.1 Generation of Embedding Message...22
6.2 Embedding...22
6.3 Detection ...24
7 Results and Analysis ...29
7.1 Experiment 1: DA (FLD) vs. DA (SVM)...30
7.2 Experiment 2: Stegdetect vs. DA (SVM)...31
7.3 Experiment 3: DA (SVM) vs. Breaking F5...36
7.4 Summary of Analysis...38
8 Proposed procedure ...39
9 Conclusions...41
References...42
List of Figures
Figure 1: Basic Embedding and Extraction flow ...3
Figure 2: Test data creation basic flow ...17
Figure 3: General Data set representation ...18
Figure 4: Train and test data representation in a subset ...18
Figure 5: DA (FLD) vs. DA (SVM)...30
Figure 6: True Positives for Data Set 1 ...32
Figure 7: Stegdetect vs. DA (SVM) for Data Set 1...32
Figure 8: True Positives for Data Set 2 ...33
Figure 9: Stegdetect vs. DA (SVM) for Data Set 2...33
Figure 10: True Positives for Data set 3...34
Figure 11: Stegdetect vs. DA (SVM) for Data set 3 ...34
Figure 12: Graph plot of beta values in breaking F5 ...36
Figure 13: DA vs. “Breaking the F5” for F5 detection...37
Figure 14: Proposed procedure flow chart ...40
List of Tables
Table 1: Number of images in Data Set 1 ...20Table 2: Number of images in Data Set 2 ...21
Table 3: Number of images in Data Set 3 ...21
Table 4: Data sets for each experiment...29
Abstract
Steganography is the art of hiding information within cover objects like images or audio/video
files. It has been widely reported that there has been a surge in the use of steganography for
criminal activities and therefore, implementing effective detection techniques is an essential task
in digital forensics. Unfortunately, building a single effective detection technique still remains
one of the biggest challenges. This report presents a comparative study of three steganalysis
techniques. We investigated and compared the performances of each technique in the detection
of embedding methods considered. Based on the results of our analysis, we provide information
as to which specific steganalysis technique needs to be used for a particular steganographic
method. Finally, we propose a procedure which may help a forensic examiner to decide an order
in which different steganalysis techniques need to be considered in the detection process to
1 Introduction
1.1 Steganography
Steganography is the art of hiding information within innocuous cover carriers in ways such that
the hidden message is undetectable. In Greek, ‘stego’ means ‘covered’ or ‘secret’ and ‘graphy’
means ‘to write’ and therefore, steganography becomes “covered or secret writing”. The
information to be hidden is embedded into the cover object which can be a text matter, some
image, or some audio /video file in such a way that the very existence of the message is
undetected by maintaining the appearance of the resulted object exactly same as the original. The
main goal of steganography is to hide the fact that the message is present in the transmission
medium.
1.2 History
Steganography has a very long history dating back many centuries. It has been used by Greeks
since ancient times for secret communications. There are many stories that mention about the use
of secret communications in the past. One famous story is about a king who made one of his
slaves shave his head, tattooed a message there and after his hair grew back, sent his slave to
deliver that message without any suspicion from his opponents. Similarly, there are stories about
the use of wax tablets for secret communications. Wax tablets were used for writing and sending
messages. Many a times, to hide the message, it was written on wooden boxes, that were used to
carry wax, instead of wax tablets itself and thus the message could be delivered without
interception. During World War II, many invisible inks were used. Messages were written on
paper with liquids like juice or urine which were normally invisible but when paper was heated,
1.3 Cryptography vs. Steganography
Cryptography is the science of encrypting data in such a way that one can not understand the
encrypted message, whereas in steganography the mere existence of data is concealed, such that
even its presence cannot be noticed. Using cryptography might raise some suspicion whereas in
steganography the existence of secret message is invisible and thus not known. We can think of
steganography as an extension of cryptography, and it is commonly used under the
circumstances where encryption is not allowed.
1.4 Steganography vs. Watermarking
Watermarking is another branch of steganography and it is mainly used to restrict the piracy in
digital media. In steganography the data to be hidden is not at all related to the cover object. The
main intention of using steganography is secret communication, but in watermarking the data to
be hidden is related to the cover object. It is extended data or attribute of the cover object and the
main intention while using watermarking is to stop piracy of digital data.
There are three main attributes related to the information hiding; capacity, security, and
robustness. While using steganography, our goal is to achieve high capacity and security
1.5 Basic Embedding and Extraction process
Below is the basic flow of embedding and extraction process
Figure 1: Basic Embedding and Extraction flow
As shown above, secret message is embedded into the cover object by using an embedding
algorithm and the resulted object is called a stego object. A stego object is one which looks
exactly same as the cover object but it contains hidden information. To add more security, the
data to be hidden is encrypted with a key before embedding. To extract the hidden information
one should have this key.
Most of the embedding methods use a secret key for encrypting the message before embedding.
In some of these methods secret key is also used to select locations in the cover object where
information will be hidden, thus adding more security to the embedding process.
1.6 Terminology
• Cover (container) – the message into which the information is hidden.
• Embedding message – information to be hidden, a secret message.
• Stego – the resulted message after embedding the secret message into cover
• Stego Image: Image with the hidden information.
• Non-stego Image: Natural image with no hidden information.
Cover object
Secret message
Embedding process Secret key
Stego object Extraction algorithm
Secret key
• True Positive: while testing, if a test image is correctly detected as a stego image; it is
treated as True positive.
• True Negative: while testing, if a test image is correctly identified as a non-stego image,
it is treated as True Negative.
• False Positive: while testing, if a test image is incorrectly detected as a stego image, it is treated as False Positive.
• False Negative: while testing, if a test image is incorrectly identified as a non- stego
image, it is treated as False Negative.
1.7
Modern Steganography
With the advancement of technology in this digital age, most of the communication is carried out
using some form of digital media. Similarly, steganography is also increasingly being used in the
digital format through the use of digital media. Because of the wide spread use of internet for
communication, it has become a preferable medium for digital steganography.
Any digital format can be used for steganography like images, video etc., but images are still the
most widely used medium and are very suitable to hide the information. There is a lot of work
being done on steganography based on images as compared to other formats like audio/video,
and therefore, we have mainly concentrated on the images and the remainder of this paper deals
mainly with steganography in images.
1.8 Steganography in Images:
Steganography in images is mainly classified into:
>Least significant bit (LSB) insertion method.
>Masking and filtering.
Least significant bit insertion method:
This is the most common method used. In this type, the data to be hidden is inserted into the least
significant bits of the pixel information. In digital format the images are represented with
numerical values of each pixel where the value represents the color and intensity of the pixel.
Images are mainly of two types:
24-bit images
8-bit images
24-bit images: These images have 24 bit value for each pixel in which each 8 bit value refers to
the colors red blue and green. We can embed 3 bits of information in each pixel, one in each LSB
position of the three 8 bit values in 24 bit value.
Increase or decrease of value by changing the least significant bit doesn’t change the appearance
of the image, such that the resulted stegoimage looks exactly same as the cover image.
8-bit images: In these images 1 bit of information can be hidden in each pixel. As in 8-bit
images maximum number of colors that can be present are only 256 colors, the color variation
may occur and therefore, care should be taken in considering the cover image.
Images with gray palette are good choice as the difference between the adjacent colors is less.
Advantages:
• There is less chance for degradation of the original image.
• More information can be stored in an image (hiding capacity is more).
Disadvantages:
• Less robust, the hidden data can be lost with image manipulation.
Masking and Filtering:
Masking refers to covering a signal by a different signal in such a way that the first signal is not
apparent. This is based on the human visual acuity which cannot detect slight changes. Masking
is mainly used in watermarking techniques. This is not pure steganography as here we extend the
image information as well as other attributes of the image.
Since much of the data is integrated into the image, the data wont be lost even if the image
manipulation is done like compression, cropping etc.
Algorithms and Transformations:
Data is embedded into the cover image by changing the coefficients of transformation of an
image, such as discrete cosine transform coefficients. If we embed information in spatial domain,
it may be subjected to the losses if the image undergoes any image processing technique like
compression, cropping etc. To overcome this problem we embed the information to be hidden in
frequency domain. As the digital data is not continuous, to analyze the data of the image, we
apply transformations to the image. We embed the data to be hidden by changing the values of
the transformation coefficients accordingly.
There are mainly three transformation techniques:
1. Fast Fourier transformation technique(FFT)
2. Discrete cosine transformation technique (DCT).
3. Discrete Wavelet transformation technique (DWT).
The main implementation techniques are same in all three but our main concentration in this
paper is on JPEG images and they use DCT for compression. The information is hidden in the
1.9 Thesis Organization
The remainder of this thesis is structured as follows:
Chapter 2: explains brief overview of steganalysis and the classifications of steganalysis based
on information available.
Chapter 3: presents the review of related work done in the field of steganalysis. It covers all the
steganalysis techniques analyzed in our study.
Chapter 4: gives the overview, procedure and details of our study.
Chapter 5: presents the general data preparation process and the details of data sets we prepared
for our experiments
Chapter 6: includes details of the software used in our study for embedding and detection.
Chapter 7: includes results and analysis of all the experiments.
Chapter 8: presents our proposed procedure for the detection of steganography in general.
2 Steganalysis
Steganalysis is the practice of attacking steganography methods for the detection, extraction,
destruction and manipulation of the hidden data in a stego object.
Attacks can be of several types for example, some attacks merely detect the presence of hidden
data, some try to detect and extract the hidden data, some just try to destroy the hidden data by
finding the existence without trying to extract hidden data and some try to replace hidden data
with other data by finding the exact location where the data is hidden.
Detection is enough to foil the very purpose of steganography even if the secret message is not
extracted because detecting the existence of hidden data is enough if it needs to be destroyed.
Detection is generally carried out by identifying some characteristic feature of images that is
altered by the hidden data. A good steganalyst must be aware of the methods and techniques of
the steganography tools to efficiently attack.
Classification of attacks based on information available to the attacker:
1. Stego only attack: only stego object is available for analysis.
2. Known cover attack: both cover and stego are known.
3. Known message attack: in some cases message is known and analyzing the stego object
pattern for this embedded message may help to attack similar systems.
4. Chosen stego attack: steganographic algorithm and stego object are known.
5. Chosen message attack: here steganalyst creates some sample stego objects from many
steganographic tools for a chosen message and analyses these stego objects with the suspected
one and tries to find the algorithm used.
Different Approaches of Steganalysis:
Visual attacks:By analyzing the images visually, like considering the bit images and try to find
the difference visually in these single bit images.
Structural attacks: The format of data file often changes as the data to be hidden is embedded,
identifying these characteristic structural changes can detect the existence of image, for example
in palette based steganography the palette of image is changed before embedding data to reduce
the number of colors so that the adjacent pixel color difference should be very less. This shows
that groups of pixels in a palette have the same color which is not the case in normal images.
Statistical attacks: In these type of attacks the statistical analyses of the images by some
mathematical formulas is done and the detection of hidden data is done based on these statistical
results. Generally, the hidden message is more random than the original data of the image thus
3 Related Work
In the paper [2] “Detecting Steganographic Messages in Digital Images Using Higher Order
Statistics” it is shown that in natural images, strong higher order statistical regularities within a
wavelet like decomposition exist and when the information is hidden these statistics are
significantly altered. The decomposition is based on separable quardrature mirror filters
(QMF’s). It splits the frequency space into multiple scales and orientations. This is accomplished
by applying separable low pass and high pass filters along the image axis generating a vertical,
horizontal, diagonal and low pass sub bands. Subsequent scales are generated by recursive
filtering of low pass sub bands.
The statistics of mean, variance, skewness and kurtosis of the sub band coefficients at each
orientation and at scale i=1, 2...n form the first order statistics. Second order statistics are based
on error statistics, calculated from the current and expected sub band coefficients. Expected sub
band coefficients are calculated from the neighboring coefficients. The total of 12(n-1) error
statistics plus 12(n-1) coefficient statistics which is a total of 24(n-1) statistics forms a feature
vector. This feature vector is used to discriminate between the images that contain the hidden
information and those that do not contain any hidden information.
From the experiments conducted, it is shown that stego images and non-stego images can be
classified using feature vectors of the images by using the discriminant analysis methods in
which first classifier is trained with the train data before we classify the test image to find which
class it belongs to. This method needs a huge amount of train data.
Westfeld and Pfitxmann [13] found that embedding encrypted data into an image changes the
histogram of its color frequencies. Encrypted data likely contain 1 and 0 bits equally. Because of
this nature, when encrypted data is used for embedding, if the original image has color X more
than color Y (where X and Y are adjacent colors), after the embedding process, X changes more
often to Y than Y changing to X as a result of which the difference in frequencies of X and Y is
Niels Provos [5] found that exactly the same concept explained in [13] applies if the information
is embedded in the LSB of the DCT coefficients in JPEG images. But instead of color frequency
histogram, here the DCT coefficient frequency histogram is analyzed. To find whether the image
has any hidden information DCT coefficient histograms of the original and modified image are
compared but in general, as we are left with only one image to determine whether it’s a stego or
normal image, we don’t have an option of having an original image to compare the frequency
histograms with the suspected image. It is shown that we can estimate the original image
histogram from the given image by calculating the expected DCT coefficients of the original
image from the existing image by taking the average of adjacent coefficients.
And finally, the difference between expected and original distributions X2 value is calculated.
And from this, probability P is determined which, tells us the probability of embedding in the test
image. Stegdetect calculates the probability of hidden information in different parts of the image.
Selection of the position of image where the probability is calculated depends on the
steganography technique we are trying to find. And also, from the graph plot between the
probability and the position in the image, it is shown that the common pattern is observed for
the images embedded with a same steganographic technique and also it is showed that the
patterns are different for different steganographic techniques. These patterns are used to find the
specific technique used for embedding. For an image with no embedded information i.e. for a
normal image the probability is zero at all places of the image.
Jessica Fridrich [10] showed that F5 steganography method can be broken. It is shown that by
embedding the information into the JPEG image by F5 method will significantly alter the DCT
coefficient histogram of the image and the changes caused to the histogram is directly
proportional to the length of the message but in general for the comparison of histograms
original image is not available. It is shown that if the test image is decompressed, crop by 4
pixels in both directions in spatial domain and recompress with the same quantization tables of
the original image the histogram obtained from the resulted image will be equal to the original
image (before embedding). A preprocessing step is performed before recompressing by doing a
boundaries. A beta value is calculated with the use of the low frequency DCT coefficients of the
test image and recompressed image obtained. This beta value represents the percentage of
embedding. For natural images without any hidden information this value should be very close to
zero. A threshold value is selected for the detection of stego images. For example if the threshold
value is 0.5, for an image if the calculated beta value is greater than 0.5 it is considered as stego
or image with possible hidden information.
In [12] Guillermito El Loco listed all the steganography methods he could break. All the attacks
were listed by analyzing the raw data of the test file such that all of these are structural attacks to
find any changes made to the structure of the file. For all the broken methods while analyzing the
raw data with the help of a Hex editor he was able to find the signatures embedding methods
leave in the file. These signatures are not visible when an image is seen but they can be found
when its raw data is looked using special editors. By experimenting with few test images he was
able to detect the location of the signatures present in the file like password being stored at a
particular location in the file, having a comment in the file. Data being present at the end of the
file, for example, as JPEG file format has a special character which tells the end of the JPEG
file. Some steganography methods just add the hidden information at the end which can be
easily identified by looking at the raw data of the file to find the information after the end of
4 Our Study
In this section we explain:
• General overview of our study
• Different techniques compared.
• Embedding methods considered for the performance comparison of steganalysis
techniques.
• Details of comparison.
4.1 Overview
The main goal of our study was to do the performance analysis of three different steganalysis
techniques and compare the detection accuracy of each technique in JPEG images. To analyze
the performance of a given steganalysis technique, we tested on various test images and the
performance was determined based on the number of correctly detected test data. Comparison
was made based on the number of true negatives, true positives and misclassified resulted for
each steganalysis technique used in the detection of embedding methods.
4.2 Problem Statement
There is no single steganalysis technique which is able to efficiently detect all the steganography
methods available. To analyze a suspicious image in a forensic investigation, forensic experts
have to run all available steganalysis techniques blindly for the detection of possible stego
involved, without the specific knowledge of the ones that are efficient in the detection of specific
steganography methods. This results in the use of more time and resources for the investigation.
4.3 Contribution
Our motivation in writing this thesis is to summarize the enormous amount of work that has been
done in the field of steganalysis of images. It is our aim to have all the results together in one
place so that readers interested in steganography could easily view the results of the performance
Contributions of Our Thesis:
(i) We did a comparative analysis of the performance of steganalysis techniques (stegdetect and
discriminant analysis based on feature vectors collected from higher order statistics) in the
detection of each steganography method considered (Jsteg, Jphide, F5, Outguess (new)).
(ii) We did a comparative analysis of the performance of the steganalysis technique breaking the
F5 algorithm with the best technique from two steganalysis techniques mentioned above
(stegdetect, discriminant analysis) in the detection of F5 embedding method
(iii) Based on the results of our analysis, we provide information as to which specific
steganalysis technique needs to be used for what particular steganographic method and finally
we propose a procedure which may help a forensic examiner to decide the order in which the
different steganalysis techniques need to be considered in the detection process to achieve the
best detection results in terms of both accuracy and time.
4.4 Steganalysis Techniques Compared
Steganalysis techniques, compared and analyzed are listed below for the detection of
steganography in JPEG images.
• Stegdetect
• DA (FLD) Discriminant Analysis based on Fisher Linear Discriminant classification
• DA (SVM) Discriminant Analysis based on Support Vector Machines
• Breaking F5
Both DA (FLD) and DA (SVM) are classification methods. The detection logic in both is same
i.e., the features used for the classification are same and only the methods used for the
4.5 Embedding Methods Considered
Steganography or embedding methods for JPEG images considered for the performance analysis
of above mentioned steganalysis techniques are
• Jsteg
• F5
• Outguess (new)
• Jphide
4.6 Procedure
In our study, any steganalysis detection test involves the detection of two sets of our test data,
one with unmodified images and other with the modified images created by the embedding
method whose detection was being analyzed. In an ideal scenario, if the steganalysis technique is
hundred percent accurate, it should detect correctly all images under modified data set as stego
images and all the images under unmodified set as non-stego images.
The results obtained with the test data are compared with the expected results to calculate the
number of TN (true negatives) and TP (true positives) for each test. These numbers along with
the number of misclassified images were used to analyze the performance of detection technique
for each steganographic method.
True Negatives (TN) are the number of images from the unmodified image set which are
correctly identified as non-stego images i.e., no steganography is detected in these images.
True Positives (TP) are the number of images in the modified image set which are correctly
In our study, first we compared the performance of two discriminant analysis techniques (DA)
(FLD) and DA (SVM). Each of these methods uses Fisher linear discriminant and support vector
machines as classifiers respectively.
Subsequently, we compared stegdetect and DA (SVM) with three different data sets. Images were
same in all the data sets but the embedding message size in creating each of the data set were
different.
Finally, we analyzed and compared the performance of breaking F5 technique and the resulted
5 Data Preparation
5.1 Overview
To analyze the performance of different steganalysis techniques considered, we needed to have
test set of images to experiment with. As we were testing the steganalysis techniques that detect
the presence of hidden information in the images, the test data needed to include both non-stego
images (not modified) and stego images(with the secret message). Also, DA (FLD) and DA
(SVM) needed a significant number of train data for training the classifiers and to find the
threshold value for the test data classification. Therefore, data preparation was the first and a
very important step in our work.
5.2 Procedure
Shown above is a brief representation of data creation process. We created the stego image sets
for each of the steganography methods by hiding a message into the cover images (non-stego
images) by using corresponding embedding tools of steganography methods. From the process
shown above, we created the data set needed. A data set consists of one subset of non-stego
images and four subsets of stego images generated by embedding a secret message into the
unmodified (non-stego), using the four embedding methods considered for this study.
Non Stego
Jsteg Stego
Jphide Stego F5 Stego
Outguess Stego
Non Stego Jsteg Stego Jphide Stego F5 Stego Outguess Stego
Figure 3: General Data set representation.
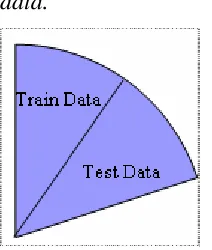
As discussed above, we needed the train data for steganalysis techniques based on classification
so we divided the above obtained each subset image into train data and test data (see diagram
below shown for only one subset). Similarly all the subsets were divided into train data and test
5.3 Details
For our experiments we created three data sets by the above mentioned process. In all these three
data sets the non-stego image subsets are same and taken from a database of JPEG images with
the sizes ranging from 6KB to 243KB. From these non-stego images the stego image subsets are
generated by the embedding process as shown in figure 2. These stego image subsets differ in the
three data sets because of the embedding message size we chose while creating them.
In the process of creating above mentioned three data sets, embedding message sizes chosen for
the embedding processes were 5 percent, 4 percent and 3 percent of the cover image size into
which the message is embedded.
Exceptions were present with respect to the embedding size for F5 and Outguess (new)
embedding methods which calculated maximum capacity it could embed before embedding
process. For F5 we tried to embed a message with size equal to the above mentioned message
sizes. If the message size was larger than the expected capacity, it embeds the maximum
allowable data from the message and discards the rest of the message. In Outguess it did not
embed any information if the message was larger than the allowable capacity. Therefore, for this
method we first tried to embed very large message and the log was captured in a text file which
had the maximum allowable capacity. Then we created a message with maximum allowable size
which was used for the embedding. In most cases the maximum allowable message size was less
than 5% of the image size.
Because of the embedding problem explained above for Outguess, two data sets among the three
5.4 Summary of Data sets
To avoid any confusion, in this section we listed the details of each data set created separately.
Details include the embedding message size used in the embedding process to create the stego
image subsets, and the number of images considered as train data and test data from these data
sets.
Data Set 1
Non-stego images: Taken from the image database.
Jsteg stego images: Created from Jsteg embedding method by embedding a message with size
equal to 5 percent of the cover image size.
Jphide stego images: Created from Jphide embedding method by embedding a message with
size equal to 5 percent of the cover image size
F5 stego images: Created from F5 embedding method by embedding a message with size equal
to 5 percent of the cover image size or maximum allowable embedding size if 5 percent of the
cover image size was greater than maximum allowable embedding size.
Outguess stego images: Created from Outguess (new) embedding method by embedding a
message with size equal to maximum allowable embedding size
Below table shows the number of train and test data images for each subset mentioned above
Train data Test data
Non Stego 1000 1200
Jsteg Stego 1000 1200
Jphide Stego 1000 1200
F5 Stego 1000 1200
Data Set 2
Non- stego images: Taken from the image database.
Jsteg stego images: Created from Jsteg embedding method by embedding a message with size
equal to 4% of the cover image size.
Jphide stego images: Created from Jphide embedding method by embedding a message with
size equal to 4% of the cover image size
F5 stego images: Created from F5 embedding method by embedding a message with size equal
to 4 percent of the cover image size or maximum allowable embedding size if 4 percent of the
cover image size was greater than maximum allowable embedding size.
Train data Test data
Non Stego 1000 1200
Jsteg Stego 1000 1200 Jphide Stego 1000 1200
F5 Stego 1000 1200
Table 2: Number of images in Data Set 2
Data Set 3
Non stego images: Taken from the image database.
Jsteg stego images: Created from Jsteg embedding method by embedding a message with size
equal to 3 percent of the cover image size.
Jphide stego images: Created from Jphide embedding method by embedding a message with
size equal to 3 percent of the cover image size
F5 stego images: Created from F5 embedding method by embedding a message with size equal
to 3 percent of the cover image size or maximum allowable embedding size if 3 percent of the
cover image size was greater than maximum allowable embedding size.
Train data Test data
Non Stego 1000 1200
Jsteg Stego 1000 1200 Jphide Stego 1000 1200
F5 Stego 1000 1200
6 Implementation Details
In this chapter we explained implementation details of several processes used.
• We provided the details of generation of random message for embedding.
• We listed different embedding tools used.
• We presented the details of steganalysis techniques and how the results were interpreted.
6.1 Generation of Embedding Message
In the process of creating stegoimages with both train and test data for our experiments, hidden
message was embedded into the original set of non-stego images by using the embedding tools to
create stego image subsets for each embedding method considered. The hidden message used for
embedding was a random message and was different for every embedding. Random message was
generated before the embedding process by writing the random characters with ASCII value
ranging from 0-255 on to a text file, each character being 1 byte of information. We wrote N
characters to a text file to generate N bytes of message.
6.2 Embedding
This section gives only a brief outline of the embedding tools used in our data creation process
with download locations. More information on the usage and implementation details can be
found in the documentation provided along with the software. All of the embedding tools listed
here are open source.
Jsteg
UNIX version of this software was downloaded from this location [25] and code used the
standard JPEG library. To be specific, it was a modification made to the standard library itself.
The usage is pretty straight forward. An option –steg is added to the compression command
Jphide
UNIX version of this software was downloaded from this location [25]. A shell script for the
automation of embedding for all the images by generating random message before embedding
process was used but Jphide uses a getpass() command which asks for a password at the
command prompt. Because of this, the automation of embedding process for all the images
without user interaction was not possible and so we had to modify the source code of Jphide by
hard coding a string in place of getpass() as password for the automation to work.
F5
The source code was downloaded from [26] location. F5 calculates the maximum allowable
embedding size before the embedding process and if the message size is larger than the
allowable message size, maximum allowable message is embedded and the rest of the message is
discarded.
Outguess (new)
This tool was downloaded from [16]. The new Outguess calculates the maximum allowable size
and only embeds if the embedding message is less than maximum allowable size. If the message
size is larger it simply discards the entire message and no information will be hidden. To create
Outguess stego images for our test data, we embedded maximum allowable message into each
image of unmodified image set. To find the maximum allowable message size, we first tried to
embed very large amount of data (maximum image size in the unmodified image set) into each
image and collected the log in a text file which is then parsed for the maximum allowable
message size for each image. Having found maximum allowable message size for each image we
then embedded the message with maximum allowable message size into all the images to form
6.3 Detection
In this section we explain the implementation details of detection process by all the steganalysis
techniques considered for our study, which involved the tools used in each process and details of
the interpretation of results.
Stegdetect
Stegdetect software written by Niels Provos was downloaded from [16]. It’s an open source
code and this was used without any modifications by calling its executable from a shell script.
The shell script was written for automation of detection for all the test images and the output was
written to a text file, this text file was then parsed and the results were interpreted for all the
images which in turn were compared with the expected results to calculate the total number of
true negatives and true positives.
Any image which was identified as negative or skipped (false positive likely) was considered a
negative image that is, as an image with no hidden information. Image which was identified as a
possible steganography of any method was considered as a positive.
Note: If an image with the hidden information embedded by Jsteg was identified as an Outguess
(old)(***), it was considered as a true positive, or as a correct detection, even though the method
of embedding was not correctly identified. This is because our main aim in this whole thesis was
DA (FLD) and DA (SVM)
As explained above, in both these techniques the feature vectors used for classification of data
were same and only the tools used for the classification were different. A matlab routine written
by Hany Farid downloaded from [23] was used for the extraction of feature vector for an image,
but as this code extracts the feature vector for an 8 bit gray scale image this was modified to
extract the feature vector for a 24 bit JPEG color image. Feature vector length for a gray scale
image is 72 i.e. 72 features were collected for each image but for color JPEG image the feature
vector was extracted in the similar way as gray scale images but for all the three color
components separately which makes the length of feature vector for a color image equal to 216
(72*3). Also additional logic was added to extract the feature vectors for N number of images
and the feature vector of n images were stored in an [Nx216] array. These feature vectors were
used for the classification of images. For DA (FLD), Fisher linear discriminant classifier was
used and for DA (SVM), LIBSVM [18] which is an open source tool for the classification, SVM
(support vector machines) was used.
DA (FLD): Here we give a brief introduction of FLD. For more details of the implementation of
two classFLD refer [2].
This is one of the most commonly used general methods in a simple two class classification
problem. For the train data, the within class mean and between class mean of the two classes
were calculated by using these within class scatter matrix and between class scatter matrix. Now
the train data were projected on to the one dimensional subspace which was defined by the
maximal generalized eigen value and eigen vector solution of the scatter matrices calculated
above. From these projections a threshold value was selected which best classified the train data.
Now test data was projected on to the same axis to find the class it belongs to. The threshold
value calculated above is used as a divider between the two classes to determine into which class
the test data fell. For our experiment the two classes were non-stego images and stego images
and we represented them as -1 and +1 respectively, for test data. After we determine into which
class the image fell, we further calculated true positives, true negatives and misclassified
DA (SVM): SVM (support vector machines) are used for classification in which the training
data are mapped on to a higher dimensional space to find the hyper plane which separates the
classification data into different classes. The mapping function which is used to map the train
data in to the higher dimensional place is called kernel. For SVM classification in our study, non
linear RBF kernel was used and the parameters for this kernel C and gamma values were
calculated by a parameter selection tool in the LIBSVM. A tool in LIBSVM was used for this
whole process of classification which takes everything from scaling the data to parameter
selection for the classification. Parameters were selected by cross validation on the train data
with brut force search
For every classification we generated 2 text files, train.txt and test.txt, which contained the
feature vectors of train and test images formatted as required by LIBSVM [18] for the
classification. Details of the format of these train and test files can be found in the
documentation of the software or for more details refer [18]. As LIBSVM takes only the numeric
data as input, each image was labeled as -1 or +1, -1 for the non-stego images and +1 for the
stego images. In general this labeling was required only for the train data but we added the
labeling for the test data too to find the accuracy of the classification. The output of the
classification for the test data was a predict file where all the test images were classified as either
–1, or +1. The results from this predict file was compared against the expected results to
Breaking the F5 algorithm
This is implemented in the matlab, paper[10] “Steganalysis of JPEG Images: Breaking the F5
Algorithm” written by Jessica Fridrich was implemented with some extra logic as the paper[10]
talks about only gray scale images. But in our experiment, as we were testing on 24 bit jpeg color
images, the code was implemented for the JPEG color images. To accomplish this we had to
consider only the luminance component from the JPEG color components leaving the
chrominance component in calculating the beta value. The code uses different open source
libraries. For the decompression and recompression of images, cjpeg and djpeg from the standard
JPEG library were used. And to find the quantization tables of a test JPEG image which were
used in the recompression process after cropping the image in spatial domain, we used Matlab
JPEG Tool Box written by Phil Sallee [24].
The preprocessing step before the recompression of an image was the uniform blurring operation
done to the image to remove any spurious frequencies due to the discontinuity at block
boundaries. This was necessary to reduce the false positives. For gray scale images studied in
paper [10] this was done by convoluting the image with the 3x3 kernel shown below
0 2.7183 0
2.7183 -9.8731 2.7183
0 2.7183 0
But for our study, since we considered the color JPEG images, we experimented with the above
kernel used in the paper, 1/9 Kernel shown below and without using the blurring operation.
.
1/9 1/9 1/9
1/9 1/9 1/9
From the tests we conducted (not shown), we found that removing the preprocessing step
(blurring operation) explained in the paper [10] gave good results for the JPEG images. Kernel
used in the paper [10] for the preprocessing step was for the gray scale images and it was not
good for the JPEG images. So, we completely removed this step as this was an extra step for the
reduction of false positives and not the main part in the detection. The results shown here for
breaking F5 in this thesis are without the preprocessing step.
The beta values for each test image were calculated as explained in the paper. We chose the
threshold value ‘T’ to classify the data as one which best classifies from random values we
considered. For the test, images with the beta value less than threshold T were considered as
images with No hidden information (non-stego Image) and images with beta value greater than
7 Results and Analysis
In this section we present all the results for each steganalysis technique in the detection of
embedding methods considered. We show the comparison charts to compare the performances
for all the experiments.
All the experiments presented in this section were conducted with the data sets created in data
preparation process. More details of data sets are explained in chapter 5. Table below lists the
comparison experiments and data sets used for each experiment.
Experiment number Techniques Compared Data Set used
Experiment 1 DA (FLD) vs. DA (SVM) Data Set 1
Experiment 2 Stegdetect vs. DA (SVM)
Experiment 2.1 Stegdetect vs. DA (SVM) Data Set 1
Experiment 2.2 Stegdetect vs. DA (SVM) Data Set 2
Experiment 2.3 Stegdetect vs. DA (SVM) Data Set 3
Experiment 3 DA (SVM) vs. Breaking F5 Data Set 1
Table 4: Data sets for each experiment
Stegdetect does not detect F5 and Outguess (new), it detects F5 only when a message is
embedded with the comment. We tested the detection of these using stegdetect, if it could detect
just the mere presence of hidden message even though it could not detect the correct method (F5
or Outguess) used to embed by considering the fact that mere detection of a stego image is
enough to foil the whole purpose of steganography. For stegdetect if an image was detected as
positive it was considered as a true positive, though it did not identify the embedding method
used correctly. We have included the charts to illustrate both the individual performances and for
comparison of the techniques even though they are showed in comparison graphs in Experiment
7.1 Experiment 1: DA (FLD) vs. DA (SVM)
Overview
In this experiment we analyzed and compared the performance of discriminant analysis
technique by using 2 different classifiers. The features considered for the classification in both
the techniques were same only the classification methods were different. The two classifiers used
were Fisher linear discriminant (FLD) and Support Vector Machines (SVM). We tested for all
the four embedding methods Jsteg, F5, Outguess (new) and Jphide.
Results
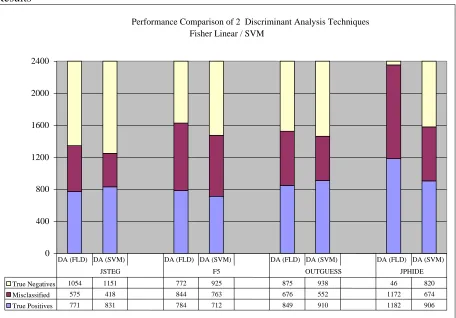
Figure 5: DA (FLD) vs. DA (SVM)
Analysis
From the above results we see that for all the embedding methods considered, the number of
misclassified are less in DA (SVM) when compared with the DA (FLD). From the above results
we concluded that DA (SVM) is better than DA (FLD). From the above conclusion DA (SVM)
Performance Comparison of 2 Discriminant Analysis Techniques Fisher Linear / SVM
0 400 800 1200 1600 2000 2400
True Negatives 1054 1151 772 925 875 938 46 820 Misclassified 575 418 844 763 676 552 1172 674 True Positives 771 831 784 712 849 910 1182 906
DA (FLD) DA (SVM) DA (FLD) DA (SVM) DA (FLD) DA (SVM) DA (FLD) DA (SVM)
7.2 Experiment 2: Stegdetect vs. DA (SVM)
Overview
In this experiment we analyzed and compared the performance of stegdetect and discriminant
analysis technique DA (SVM), the classifier used in discriminant analysis technique is support
vector machines (SVM). We have compared the results for all the three data sets we have
collected.
The three experiments shown in this section are conducted with the data sets as listed below
Experiment 2.1: Data Set 1 Experiment 2.2: Data Set 2 Experiment 2.3: Data Set 3
Results
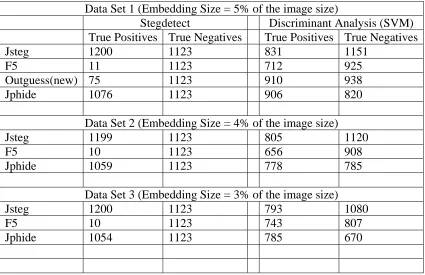
Table and charts below show all the results for both stegdetect and discriminant analysis for all
three tests with Data sets 1, 2 and 3.
Data Set 1 (Embedding Size = 5% of the image size)
Stegdetect Discriminant Analysis (SVM)
True Positives True Negatives True Positives True Negatives
Jsteg 1200 1123 831 1151
F5 11 1123 712 925
Outguess(new) 75 1123 910 938
Jphide 1076 1123 906 820
Data Set 2 (Embedding Size = 4% of the image size)
Jsteg 1199 1123 805 1120
F5 10 1123 656 908
Jphide 1059 1123 778 785
Data Set 3 (Embedding Size = 3% of the image size)
Jsteg 1200 1123 793 1080
F5 10 1123 743 807
Jphide 1054 1123 785 670
Experiment 2.1
True Positives Stego Images Detected
1200 11 75 1076 831 712 910 906 0 200 400 600 800 1000 1200
Stegdetect 1200 11 75 1076
Discriminant analysis 831 712 910 906
Jsteg F5 Outguess(new) Jphide
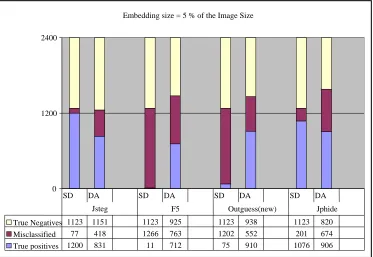
Figure 6: True Positives for Data Set 1
Above Figure 4 shows the detection of steganographic methods Jsteg, Jphide, F5 and OUTGUESS (new) by Stegdetect and Discriminant Analysis (SVM)
Embedding size = 5 % of the Image Size
0 1200 2400
True Negatives 1123 1151 1123 925 1123 938 1123 820 Misclassified 77 418 1266 763 1202 552 201 674 True positives 1200 831 11 712 75 910 1076 906
SD DA SD DA SD DA SD DA
Experiment 2.2
True Positives (Embedding size = 4% of the image size)
1199
10
1059
805
656
778
0 200 400 600 800 1000 1200
Stegdetect 1199 10 1059
Discriminant analysis 805 656 778
Jsteg F5 Jphide
Figure 8: True Positives for Data Set 2
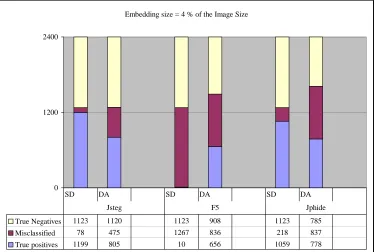
Embedding size = 4 % of the Image Size
0 1200 2400
True Negatives 1123 1120 1123 908 1123 785
Misclassified 78 475 1267 836 218 837
True positives 1199 805 10 656 1059 778
SD DA SD DA SD DA
Jsteg F5 Jphide
Experiments 2.3
True Positives
(Embedding size = 3% of the image size)
1200
10
1054
793
743 785
0 200 400 600 800 1000 1200
Stegdetect 1200 10 1054
Discriminant analysis 793 743 785
Jsteg F5 Jphide
Figure 10: True Positives for Data set 3
Embedding size = 3 % of the Image Size
0 1200 2400
True Negatives 1123 1080 1123 807 1123 670
Misclassified 77 527 1267 850 223 945
True positives 1200 793 10 743 1054 785
SD DA SD DA SD DA
Analysis
From all the above figures (in experiment 2.1, 2.2 and 2.3) shown the performance of stegdetect
and DA (SVM) for 3 different datasets created with varying embedding sizes, it is evident that
stegdetect performed better in the detection of Jsteg and Jphide.
As explained earlier stegdetect does not detect F5 and Outguess (new) technically, but they were
considered for test by stegdetect if they could be identified as stego with any other embedding
methods. By looking at the results we could see that stegdetect could detect very few Outguess
(new) and F5 stego images and because of such low numbers they were considered not
detectable by stegdetect. The results for these in DA (SVM) were acceptable, although not very
good, among them the detection of Outguess (new) was better than the detection of F5.
One more observation was that if we looked at only the results of DA (SVM) it was evident that it
could detect all the embedding methods with an acceptable accuracy as they were better than
random guessing. It could be used for the detection of any steganography method irrespective of
the algorithm used.
If we look at the results from the embedding method point of view, considering both the
steganalysis techniques, F5 was the less detectable method. Because of this, we added a new
steganalysis technique for detecting F5 in our study and we compared the results of F5 detection
7.3 Experiment 3: DA (SVM) vs. Breaking F5
Overview
In this experiment we analyzed and compared the performance of discriminant analysis DA
(SVM) and breaking F5 techniques in the detection of embedding method F5.
Results
Figure 12: Graph plot of beta values in breaking F5
Figure 12 above shows the graph plot of beta values for a set of 2400 test images in which the
first 1200 images are stego images and the next 1200 images are non-stego images. From the
graph we could see that for all stego images beta value is generally greater than the beta value of
non-stego images with few exceptions in the non-stego images which are considered as False
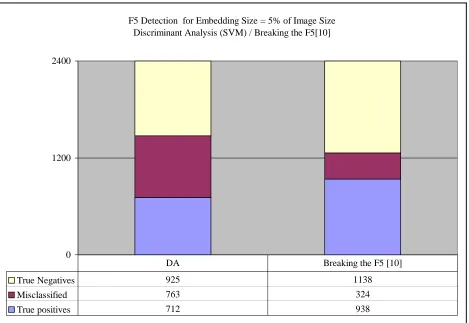
F5 Detection for Embedding Size = 5% of Image Size Discriminant Analysis (SVM) / Breaking the F5[10]
0 1200 2400
True Negatives 925 1138
Misclassified 763 324
True positives 712 938
DA Breaking the F5 [10]
Figure 13: DA vs. “Breaking the F5” for F5 detection.
Figure13 above compares the detection performance of F5 steganography method in
Discriminant Analysis (SVM) and breaking the F5 [10], from the results we clearly see that the
7.4 Summary of Analysis
From Experiment 1 it was found that discriminant analysis method with support vector machines
as classifier, DA (SVM) performs better in the classification of non-stego and stego images when
compared with the discriminant analysis with Fisher Linear Discriminant, DA (FLD). Since the
features used for the classification in both were same we concluded: for the features we extracted
from the images, nonlinear LIBSVM classifier is good in classifying when compared to linear
standard FLD classifier.
From Experiment 2 it was found that
(1) Detection of Jsteg and Jphide was very good by stegdetect when compared to the detection
by DA (SVM).
(2) F5 and Outguess (new) were not detected by stegdetect.
(3) Detection results for F5 and Outguess (new) by DA (SVM) were acceptable although not very
good.
(4) DA (SVM) could detect all the embedding methods.
(5) With the decrease in embedding size of the hidden message detection accuracy also decreases
in both stegdetect and DA (SVM) for all the embedding methods.
From Experiment 3 it was found that breaking F5 was better in the detection of F5 embedding
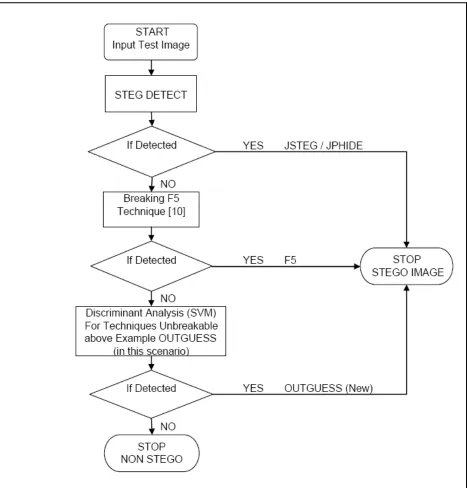
8 Proposed Procedure
From our tests and analysis it was found that we were not able to detect all the embedding
methods with any one single steganalysis technique efficiently, it was found that Jsteg and
Jphide were detected well by stegdetect and detection of F5 was good in breaking the F5
technique, Outguess (new) is only detected by the Discriminant analysis.
Without the above information that helps in determining which detection technique works well
for what particular embedding method, a forensic examiner who is investigating a case with
suspicious stego image will run all the detection tools available for the detection which takes lot
of time and resources.
Based on our analysis we propose a procedure for a forensic expert in investigating the
suspected stego images, an order in which to try the different Steganalysis techniques for the
detection.
From the above experiments and analysis of the results, we saw that steganalysis techniques
which attacked specific embedding methods by finding the signatures of embedding methods
were more efficient in the detection than the universal blind steganalysis technique like the one
we tested and analyzed.
Also, because of the overheads included in training with the huge number of train data we
suggest that discriminant analysis method be tried at the end, if the suspected image is not
detected by any other technique. Universal blind steganalysis techniques are useful in detecting
the new and unknown embedding methods.
This type of procedure is also useful when possible embedding method information is available.
In such cases the forensic investigator can try the technique which best detects the suspected
possible embedding method first instead of randomly choosing techniques. For example,
consider an investigator who is trying to detect a stego image created by F5 and has the
of steganalysis techniques, he might end up trying the discriminant analysis method first which
not only takes a significant amount of time but also needs large train data.
Below is the basic flow chart which best describes our procedure for the detection of methods we
9 Conclusions
From the above analysis it was found that detection of Jsteg and Jphide in stegdetect and the
detection of F5 by breaking F5 [10] were better when compared to discriminant analysis.
From the proposed procedure, although we can not completely reduce the work of a forensic
examiner in trying different steganalysis techniques, still with this kind of analysis if there is any
information of possible steganography method used in the test file, we can suggest as to which
steganalysis technique may be tried first. For the ones with no information, the order shown in
the proposed procedure can be followed while trying different techniques to reduce investigation
time and for better accuracy in the detection.
Also, we can say that universal steganalysis technique like DA in our work should be the last
option after all the individual attacks like stegdetect for Jphide & Jsteg and breaking F5 for F5.
Although we are saying universal steganalysis (DA) is the last option, it still has a very important
place in the field of steganalysis as it can be used for the detection of any steganography method
in general without the knowledge of algorithm it uses for embedding. More work on this need to
be done to improve the performance.
This type of analysis with all the available steganalysis techniques, both commercial and open
References:
[1] Neil F. Johnson and Sushil Jajodia “Exploring Steganography: Seeing the Unseen”. IEEE
Computer, February 1998: 26-34
[2] Hany Farid “Detecting Steganographic Messages in Digital Images” Technical Report, TR2001-412, Dartmouth College, Computer Science
[3] S. Lyu and H. Farid “Detecting Hidden Messages Using Higher-Order Statistics and Support Vector Machines” 5th International Workshop on Information Hiding, Noordwijkerhout, The Netherlands, 2002.
[4] Hide and Seek: An Introduction to Steganography - Niels Provos and Peter Honeyman, IEEE Security & Privacy Magazine, May/June 2003.
[5] Detecting Steganographic Content on the Internet, Niels Provos and Peter Honeyman, ISOC NDSS'02, San Diego, CA, February 2002.
[6] Defending Against Statistical Steganalysis, Niels Provos, 10th USENIX Security Symposium. Washington, DC, August 2001
[7] Eugene T. Lin, Edward J. Delp “A Review of Data Hiding in Digital Images”
[8] Yanming Di, Huan Liu, Avinash Ramineni, and Arunabha Sen “Detecting Hidden Information in Images: A Comparative Study”Department of Computer Science and Engineering, Arizona State University.
[9] Neil F. Johnson and Sushil Jajodia “Steganalysis: The Investigation of Hidden Information” Center for Secure Information Systems, George Mason University.
[10] Jessica Fridrich, Miroslav Goljan, Dorin Hogea “Steganalysis of JPEG Images: Breaking the F5 Algorithm” 5th Information Hiding Workshop, Noordwijkerhout, The Netherlands, 7–9 October 2002, pp. 310-323.
[11] Jessica Fridrich, Miroslav Goljan“Practical Steganalysis of Digital Images – State of the Art” Proc. SPIE Photonics West, Vol. 4675, Electronic Imaging 2002, Security and
Watermarking of Multimedia Contents, San Jose, California, January, 2002, pp. 1-13
[12] Chih-Wei Hsu, Chih-Chung Chang, and Chih-Jen Lin “A Practical Guide to Support Vector Classification” Department of Computer Science and Information Engineering National Taiwan University Taipei 106, Taiwan ([email protected]).
[13] Andreas Westfeld and Andreas Pfitzmann “Attacks on Steganographic Systems”
[15] Niels Provos “Probabilistic Methods for Improving Information Hiding”, CITI Technical Report 01-1, January 2001.
[16] http://www.outguess.org/download.php
[17] Guillermito El Loco, Analyzing steganography softwares:
http://www.guillermito2.net/stegano/index.html
[18] Chih-Chung Chang and Chih-Jen Lin, LIBSVM -- A Library for Support Vector Machines
http://www.csie.ntu.edu.tw/~cjlin/libsvm/
[19] Jessica Fridrich “Feature-Based Steganalysis for JPEG Images and its Implications for Future Design of Steganographic Schemes”, 6th Information Hiding Workshop, LNCS, vol. 3200, Springer-Verlag, pp. 67-81, 2004.
[20] Michael T. Raggo, http://www.spy-hunter.com/stego.html
[21] Terror groups hide behind Web encryption
http://www.usatoday.com/tech/news/2001-02-05-binladen.htm
[22] Bin Laden: Steganography Master?
http://www.wired.com/news/politics/0,1283,41658,00.html
[23] http://www.cs.dartmouth.edu/farid/research/steganography.html
[24] “Matlab JPEG Tool Box” by Phil Sallee <[email protected]>, 9/2003.
[25] http://www.stegoarchive.com
Vita
Swaroop Kumar Pedda Reddy was born in Hyderabad, India in 1980. He earned Bachelor of
Engineering Degree in Computer Science from Bangalore University in September 2001.
Swaroop has been accepted in the Master program in Computer Science at the University of New