in the population sciences published by the Max Planck Institute for Demographic Research Konrad-Zuse Str. 1, D-18057 Rostock · GERMANY www.demographic-research.org
DEMOGRAPHIC RESEARCH
VOLUME 25, ARTICLE 6, PAGES 215-244
PUBLISHED 19 JULY 2011
http://www.demographic-research.org/Volumes/Vol25/6/ DOI: 10.4054/DemRes.2011.25.6
Research Article
The contribution of increases in family
benefits to Australia’s early 21st-century
fertility increase: An empirical analysis
Nick Parr
Ross Guest
© 2011 Nick Parr & Ross Guest.
This open-access work is published under the terms of the Creative Commons Attribution NonCommercial License 2.0 Germany, which permits use, reproduction & distribution in any medium for non-commercial purposes, provided the original author(s) and source are given credit.
1 Introduction 216
2 Pronatalist policies and fertility 216
3 The context of Australia’s fertility trends 218
3.1 Fertility trends in Australia 218
3.2 Proximate determinants of Australia’s fertility increase 220 3.3 The socioeconomic and family policy contexts of Australia’s
fertility increase 220
4 Research questions 224
5 Data and method 225
5.1 Data 225
5.2 Model 225
5.3 Choice of independent variables 226
6 Results 228
6.1 The sample distribution and its change over time 228
6.2 Factors affecting fertility 228
7 Discussion 233
8 Acknowledgements 235
References 236
The contribution of increases in family benefits to
Australia’s early 21st-century fertility increase:
An empirical analysis
Nick Parr1
Ross Guest2
Abstract
Between 2001 and 2008 Australia’s total fertility rate increased from 1.73 to 1.96. This period also saw changes to family benefits, most notably the introduction of a universal, flat-rate payment at birth and increased subsidisation of childcare. This paper analyses individual-level fertility, using data from a large-scale longitudinal survey and focusing on the effects of changes to family benefits, macroeconomic variables, entitlements to family-friendly working conditions, and socioeconomic and demographic characteristics. It finds that the effects of the Baby Bonus and the Child Care Rebate are slight, while the effects of education, income, occupation, marital status, age, and parity are significant.
1. Introduction
Do the Australian government’s family benefit policy initiatives towards the middle of the first decade of the 21st century provide a model for successful pronatalist policy? Over this period the Australian government adopted a pronatalist position, reflecting its concern about the prospective ageing of the population, in particular the potential of population ageing to slow economic growth and to increase government expenditure on health, aged pensions, and aged care (Australian Government 2002, 2007, 2010a; UNPD 2006, 2008). Between 2001 and 2008 Australia’s total fertility rate increased from 1.73 to 1.96, following 40 years of almost continual decrease (ABS 2008a, 2010a).3
Although a fertility increase is unique in Australia’s recent history, it is by no means so in the context of the western industrialised countries. Australia’s increase in total fertility has coincided with broadly similar patterns in the United Kingdom, Ireland, and New Zealand. Over the same period in France a somewhat longer-established increase in total fertility continued, and previously undulating total fertility levels in the Scandinavian countries entered upswings. There were also increases from much lower minimum values across large parts of southern, central and eastern Europe (Eurostat 2007; Frejka and Sobotka 2008; Goldstein, Sobotka, and Jasilioniene 2009; ONS 2009; Statistics New Zealand 2009).
The coincidence of Australia’s fertility increase with both domestic policy initiatives and broadly similar international trends raises the question of whether Australia’s fertility increase is one with a distinctive international public policy significance or one whose causes reflect socioeconomic and demographic trends, including some which are similar to those experienced in other countries. This paper aims to use data from a large-scale longitudinal survey to isolate the effects on fertility of the Australian government’s major family benefit policy changes from those of simultaneously occurring socioeconomic and demographic trends, and hence to aid assessment of the broader international public policy significance of these initiatives.
2. Pronatalist policies and fertility
According to McDonald (2002, 2006a), fertility policy may draw on a wide range of measures which address the financial impact of children, such as tax-transfer policies, subsidised childcare and early education services, and workplace arrangements which support the combination of work and family. Between 2002 and 2008 the value of
family allowances increased in approximately 70% of the OECD countries covered by the Comparative Family Policy Database (including Australia), and remained more or less constant in the remainder (Gauthier 2010a).4 Family benefits increased in all the main English-speaking countries, except the United States. Following the onset of the global financial crisis in late 2008, the pattern of change became more diverse: although many countries further increased their financial support for families, there were also others which, at least temporarily, reduced such support (Gauthier 2010b). The generally increasing generosity of family policies in the advanced nations before 2008 coincided with an increase in the numbers of governments reporting to the United Nations that their fertility rate was “too low” and their policy was to raise it (McDonald 2006b; UNPD 2006, 2008, 2010). Indeed in 2009 well over half the more developed countries reported these views (UNPD 2010). Of the countries covered by the Comparative Family Policy Database in which increases in the value of family allowances occurred over the period 2002-2008, numbers were split evenly between countries which reported to the United Nations that their fertility rate was too low and countries which reported that their fertility rate was satisfactory (Gauthier 2010b; UNPD 2008).
What does the international literature find in relation to the effects of pronatalist policies on fertility? A review by Gauthier (2007) concludes that the effects of higher direct family benefits on fertility tend to be positive but generally small, while the effects of work-related benefits are small according to some studies and non-existent according to others. McDonald’s (2006a, 2006b) assessment of the literature is subtly nuanced. He suggests that the evidence for a positive effect of policy has grown stronger over time. His conclusion is that there is considerable evidence from the literature that policy can be effective in raising birth rates.
As is the case for other elements of population policy, the value of pronatalist policies has been contested in the literature (McDonald 2002, 2006a, 2006b; Gauthier 2007). The evaluation of such policies raises a host of ethical questions, such as the appropriate objective function (or social welfare function): should it take account of the total well-being of people alive in the future or just their average well-being? Moreover, how should environmental impacts of demographic change be included? And how should the non-demographic effects of pronatalist policies be considered?5 Should future well-being be discounted and if so at what rate? If we ignore all the environmental and social factors that contribute to well-being and simply focus on maximising average living standards, defined as average consumption of goods and
4 The database covers all the major countries of northern, western and southern Europe, Canada, the United
States, Australia, New Zealand, and Japan.
5 McDonald (2006b) argues that, quite apart from their demographic effects, pronatalist policies are usually
services, and also make assumptions about the relative consumption needs of young and old people, we can estimate the optimum stable population growth rate. Weil (1999), for example, calculates this as 0.7% per annum for the United States. He shows that small variations around the optimum growth rate have a negligible impact on living standards.6 Weil’s analysis also shows that transitions from the population growth rates of countries that have ageing populations to higher stable population growth rates would necessarily result in lower living standards for two or three decades, simply because youth dependency would rise but old age dependency would not fall during this transition period. Similarly, the costs of population ageing may simply be the transition costs of a shift to a lower stable population growth rate. Hence changes in the age distribution have a much bigger effect on living standards than variations in stable population growth rates.
3. The context of Australia’s fertility trends
3.1 Fertility trends in Australia
The reversal in the direction of the trend in Australia’s total fertility after 2001 can be accounted for by an acceleration of an increase in age-specific fertility rates of women aged 30 to 39,7 while the decline in age-specific fertility for women aged under 30 initially slowed and then between 2006 and 2008 appears to have been reversed slightly8 (ABS 2010a; Figure 1).9 Cohort fertility has continued to decrease, but with a declining rate of decrease (Kippen 2006; ABS 2008a, 2009; Figure 2). These patterns indicate that the past reduction in total fertility and its post-2001 recovery have been influenced by “tempo effects” and “fertility aging effects”: some births have been moved to later ages and some of the reduction in births at younger ages has not subsequently been recuperated (Bongaarts and Feeney 1998; Kohler and Ortega 2002;
6 Weil shows that a stable population growth rate 1 percentage point above or below the optimal growth rate
would imply living standards only 2% below those of an optimally growing population.
7 Age-specific fertility rates for women aged 30 to 39 have been increasing since 1978 (ABS 2008a). 8 The introduction, with effect from 1 July 2007, of a requirement for evidence of the registration of a birth to
be presented before a government benefit payable to the parents of newborn children (the Maternity Payment/Baby Bonus) may have affected the comparability of data between these years by reducing the late registration and the non-registration of births. Changes to birth registration in Queensland may also have done so (ABS 2009).
9 Between 2008 and 2009 there were small reductions in age-specific fertility for all age groups under 40
Sobotka and Lutz 2009; Bongaarts and Feeney 2010).10 Some of the increase in total fertility may be due to the slowing down or ending of fertility postponement.
Figure 1: Age-specific fertility rates: Australia 1971-2008
Figure 2: Cumulative fertility to ages 30, 35, 40, 45, and 50: Australia 31 December 2008 for selected cohorts born 1 January 1954-1979
10 Bongaarts and Feeney (1998) and Kohler and Ortega (2002) have proposed methods for adjusting total
3.2 Proximate determinants of Australia’s fertility increase
The trends in the proximate determinants that are consistent with the total fertility increase are the slight decrease in the abortion rate11 and a continued increase in fertility outside registered marriages (Chan and Sage 2005; ABS 2009). The fertility increase has occurred despite an ongoing, if slower, decrease in the prevalence of marriage in the reproductive age groups and slight improvements in the availability and use of contraceptive methods (Birrell, Rapson, and Hourigan 2004; Parr and Siedlecky 2007; Heard 2008; Gray and McDonald 2010). The effect of the decrease in marriage on rates of partnership has been offset partially by increases in the percentages of females in unmarried cohabitation.
3.3 The socioeconomic and family policy contexts of Australia’s fertility increase
Australia’s early 21st-century increase in total fertility has coincided with a period of strong economic growth. This may have been important, because fertility can be procyclical. That is, upswings in the business cycle can boost fertility and recessions can reduce fertility (Gauthier and Hatzius 1997; Jones and Schoonbroodt 2007; Orsal and Goldstein 2010; Sobotka, Skirbekk, and Philipov 2011). In particular, the employment-generating effect of upswings in the business cycle may boost fertility. Australia’s female labour force participation and the ratio of women’s incomes to men’s are slightly above the average for western industrialised countries (UNSD 2008). The former pattern is partly attributable to the relatively high percentage of Australian women who work on a part-time basis, a percentage which continued to grow over the 2001-2008 period (ABS 2008b).
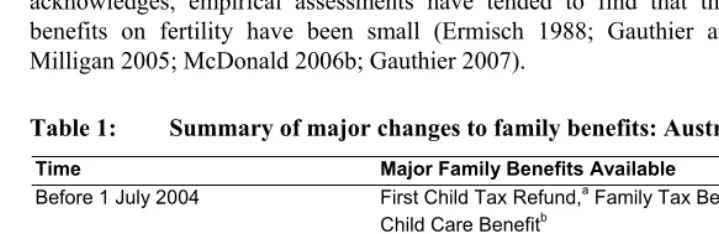
The fiscal boost from this strong economic growth facilitated the Australian government’s implementation of a series of increases to family-related benefits and cuts to personal income tax rates. These too potentially could have contributed to the fertility increase. Table 1 presents a brief chronology of the major changes to family benefits. For children born after 1 July 2001 the Australian government introduced a new tax offset, known as the First Child Tax Refund (also called the Baby Bonus), which was payable to the parents of newborn children, until the child was aged five, with the annual amount depending on the level of parental income before the birth of the first child and the subsequent reduction to that income, and having a maximum of A$2,500 per annum (Daniels 2009; ATO 2010). With effect from 1 July 2004, a universal, flat-rate payment to the parents of newborn children, originally known as the Maternity
11 Some of the decrease in the abortion rate may be due to improved access to post-coital contraception
Payment but, following widespread media and popular misnomer, renamed the Baby Bonus,12 was introduced, while the payment at birth to the parents of a smaller, means-tested Maternity Allowance and the First Child Tax Refund were discontinued. At the same time the amounts and eligibility for means-tested payments to the parents of dependent children (known as Family Tax Benefits) were increased (Australian Government 2004; Costello 2004).13 In 2008 the incoming Labor government announced that it would prevent families earning high incomes from accessing the Baby Bonus and a benefit whose value is determined by the income of the lower-paid parent (Australian Government 2008).14 The Baby Bonus would represent a fairly substantial sum to most people of childbearing age in the short run, but is small in relation to the estimated lifetime costs of children (Breusch and Gray 2004; Henman et al. 2007; Lattimore and Pobke 2008; Guest and Parr 2010). According to McDonald (2006a), the simplicity, transparency, certainty, and immediacy of receipt of the payment should contribute to the scale and rapidity of its effect on fertility. However, as he acknowledges, empirical assessments have tended to find that the effects of such benefits on fertility have been small (Ermisch 1988; Gauthier and Hatzius 1997; Milligan 2005; McDonald 2006b; Gauthier 2007).
Table 1: Summary of major changes to family benefits: Australia 2002-2007
Time Major Family Benefits Available
Before 1 July 2004 First Child Tax Refund,a Family Tax Benefits (Ab and Bc),
Child Care Benefitb
From 1 July 2004 Introduction of $3,000 Maternity Payment/Baby Bonus,d
increased Family Tax Benefits (Ab and Bc), discontinuation
of First Child Tax Refund From 1 July 2005
(and retrospectively for 2004-05)
Introduction of Child Care Rebate (at 30% up to a maximum per child of A$4,000)a
From 1 July 2006 $4,000 Maternity Payment/Baby Bonusd
From 1 July 2007 Increased rate of Child Care Benefit
a. Regressive benefit.
b. Progressive benefit based on family income.
c. Progressive benefit based on lower income in couple families or sole income. d. Flat-rate payment.
12 Henceforth we refer to it as the Baby Bonus.
13 The changes were announced on 11 May 2004. The new Maternity Payment/Baby Bonus was scheduled to
increase from an initial A$3,000 for each child born after 1 July 2004 to A$4,000 for each child born after 1 July 2006, and again to A$5,000 for each child born after 1 July 2008.
14 Families earning more than A$75,000 in the six months following the birth became ineligible for the Baby
The previous Australian government’s preference for families to be the beneficiaries of its fiscal policies appears at least in part to have been motivated by pronatalism (Heard 2006). Whereas previously the Australian government’s reports to the United Nations indicated its national fertility rate to be “satisfactory” and its policy to be “no intervention”, in 2005 it reported fertility to be “too low” and its policy to be to “raise” it. The most widely publicised statement to this effect was then Australian government Treasurer Peter Costello’s remark made while promoting the 2004 budget: “If you can have children it’s a good thing to do – you should have one for the father, one for the mother, and one for the country, if you want to fix the ageing demographic” (Dodson 2004). However, a reassessment of the political stance on fertility has by no means been restricted to the political Right. In June 2000 the Australian Council for Trades Unions (ACTU) launched a campaign to raise awareness of the relationships between working time and family life and to press for family-related leave. Around the same time, leading politicians in the then opposition Australian Labor Party expressed concerns that fertility may fall too low (Davis 2001; Heard 2006). Demographer Peter McDonald has played a prominent role in Australia’s public debate on the acceptability of and the prospects for changing its fertility levels (McDonald 2000a, 2000b, 2001, 2002; Parr 2005). According to Heard (2006), McDonald’s “gender equity” theory may be credited with encouraging a subtle shift in the feminist agenda in Australia away from advocacy of women’s work as an alternative to raising a family towards the encouragement of women to combine both work and family (McDonald 2000a, 2000b, 2000c; Heard 2006). The apparent revival of pronatalism and the waning of antinatalism in Australia’s public debate may have enhanced the psychological benefits parents derive from childbearing (a “halo effect”) (McDonald 2006a).
for expenses incurred over the 2004-05 financial year.15 This rebate would simultaneously reduce the costs of children and increase the financial incentive for mothers to work. The potential lifetime receipts from the Child Care Rebate far exceed those from the Baby Bonus, and are greater for higher-income families and for families with larger numbers of children in childcare. However, the lack of transparency and the complexity of the calculation, the inherent difficulties in predicting post-child income and childcare costs, and the lack of immediacy in receipt of payment may have dampened any effect on fertility (McDonald 2006a).
According to McDonald (2006a), in addition to financial assistance to families with children and assistance with childcare costs, policies that allow parents to more readily combine having children with income generation may also increase fertility. Such policies include those relating to parental leave, those relating to the number of hours to be worked, and those relating to the flexibility of the timing of work hours. In Australia in recent years there have been some improvements in access to parental leave. Over the period considered here Australia was one of a small minority of western industrialised countries without statutory provision for paid maternity leave.16 There was, however, some improvement in access to parental leave which is funded by employers (Productivity Commission 2009; UNSD 2008). Access to paid parental leave became increasingly uneven across sectors, with women with full-time and permanent positions, public sector workers, women with professional occupations, higher earners, and women working in larger organisations being the more likely to have access to and to use such leave (Baird 2005; ABS 2006a; Whitehouse et al. 2006; Baxter 2008; Productivity Commission 2009). Access to paid parental leave among men has also increased (Productivity Commission 2009). However, only a small minority of Australian men take such leave and the durations of their paid leave tend to be far shorter than those for women (Whitehouse et al. 2006). Since 1993 a man or a woman who acts as the primary carer for their child has been entitled to take up to 52 weeks’ unpaid parental leave, subject to certain conditions. A majority of Australian mothers take some unpaid leave, either consecutively with paid maternity leave or as their sole form of maternity leave. In contrast, few fathers do so (ABS 2006a; Whitehouse et al. 2006). A widening of access to paid parental leave offers another potential explanation
15 The rebate was initially for 30% of the “gap” between the childcare costs and childcare benefits up to a
maximum of A$4,000. The incoming Labor government increased the rate of childcare rebate to 50% up to a maximum of A$7,750 with effect from 1 July 2008.
16 An entitlement to 18 weeks’ parental leave paid by the Australian government at the national minimum
of the fertility increase, particularly among the groups with greater access to paid parental leave (Gauthier and Hatzius 1997; McDonald 2006a).
4. Research questions
The preceding review of trends suggests the fertility increase could potentially be explained by some or all of the following: family benefits, economic variables (either macroeconomic or individual-level), access to family-friendly working conditions, and tempo effects. Hence we aim to test the following hypotheses:
1. The introduction of the range of changes coinciding with the introduction of the Baby Bonus has contributed to the increase in fertility over the period 2002-2007. Since the amount of the Baby Bonus is small in relation to both the combined direct and indirect lifetime costs of additional children and fairly small in relation to the combined direct and indirect costs incurred relatively early in the child’s life, we expect the magnitude of the effect to be small.17 2. The introduction of the Child Care Rebate has contributed to the increase in
fertility. As with the Baby Bonus, we expect the magnitude of this effect to be small, partly because the rebate is not available to non-working mothers and partly, for reasons discussed in Section 3.3, because the assessment of future receipts from the rebate to working mothers is problematic.
3. Women whose work entitles them to paid maternity leave and to other family-friendly working conditions will have higher fertility than employed women without such entitlements. We expect the magnitude of such effects to be small, because the value of paid parental leave typically represents only a small fraction of the lifetime costs of children (Guest and Parr 2010). A second reason for expecting the effects to be small is that entitlements to such benefits may change in the future because of changes in employment and changes to employment conditions.
4. Economic prosperity is associated with higher fertility. This is tested through consideration of a combination of work- and income-related variables measured at the individual level and macroeconomic variables measured at the state and territory level. The macroeconomic variables were included because the broader economic climate may affect the expected affordability of additional children.
17 The relative importance placed on more immediate and more distant costs and benefits of children will
In testing these hypotheses a range of possible confounding factors will be controlled for, including age, parity, interactions between age and parity, marital status, birthplace, highest level of education, and whether studying full-time.
5. Data and method
5.1 Data
The data used are from Waves 1-7 of the Household, Income and Labour Dynamics in Australia (HILDA) survey. Wave 1 of this nationwide longitudinal survey was conducted in 2001 and subsequent waves on an annual basis. Remote areas of the country were not sampled (Wooden and Watson 2007). A multistage cluster sample design was used, and 13,969 men and women from 7,682 households and 488 census collection districts, which were stratified by state or territory, and metropolitan or non-metropolitan, were successfully interviewed for Wave 1. The household response rate was 66% and the individual response rate 61%. The retention rate for individual panel members between Waves 1 and 5 was 74%. The lowest re-interview rates were for young adults, migrants from non-English-speaking countries, and people of Aboriginal or Torres Strait Islander descent (Wooden and Watson 2007). Data are collected annually on family formation and background, employment and unemployment history and status, and income. Modules of questions on other special topics have been added periodically to the core content (Watson and Wooden 2002a, 2002b; Wooden and Watson 2007).
5.2 Model
The response variable is a binary variable indicating whether or not the respondent had given birth to a child in the 12 months before the interview. This was constructed from data on the age of the youngest child and on the number of children a women had ever had, using data from Waves 3-7 of HILDA. Multilevel logistic regression models were used for the analysis (Liang and Zeger 1986; Goldstein 1995). The model has the form:
u e
(
, 2)
, , ,logit Yi j+ = α+ ∑βkXi j k+ +i i j (1)
where the subscript i, j refers to the observation from Wave j (j=1,…,5) for woman i; α
change of the log of the odds of a woman giving birth as Xk increases by one; ui is a random effect for woman i; ei,j is the residual for the observation from Wave j and
woman i; and Yi,j+2 is whether woman i gave birth in the year before j+2, and thus is
estimated using data from Waves 3-7. The estimated covariances of the residuals (the ei,j) for different observations from the same woman were allowed to vary according to
the modulus of the difference in wave numbers.18 This was because biological factors and birth-spacing preferences may result in the correlation between pairs of residuals for the same woman in consecutive years being very different from the correlation between pairs of residuals for the same woman from observations which are, say, two or three years apart.
The analysis is of 15,477 observations of the response from women aged 15 to 44 at the time of the measurement of the explanatory variables (roughly 17 to 46 at the end of the year for which the response is estimated). The explanatory variables of principal interest are whether the Baby Bonus (in combination with the changes to family benefits that coincided with its introduction) and whether the Child Care Rebate could have affected fertility in the time period considered. Empirical assessment (“best fit”) was used to assess the most appropriate time lag between the announcement of a major change to benefits and the effect of that change on fertility. The interval between the measurement of the other explanatory variables and the response variable has been chosen to be two waves (roughly two years) so that the measurement of the explanatory variables pre-dates the conception of children born in the year before the interview for the response.
5.3 Choice of independent variables
The following groups of independent variables were considered: prospective family benefits, entitlements to parental leave and other family-friendly working conditions, individual- and macro-level (i.e., state or territory level) economic factors, education-related variables, migration-education-related variables, marital status, and age- and parity-education-related variables.
Prospective family benefits. We consider the effects of the prospective family benefits resulting from having a child based on what the regime of family benefits would have been in the decision-making window for conception for the year of observation on whether a woman gave birth. Two dummy variables were entered: the first (Baby Bonus) indicates whether conceptions for births in the period of measurement could have been affected by the availability of the Baby Bonus and the
18 Weighting the data in line with national-level population and births totals was initially considered, but was
range of other changes to family benefits which occurred concurrently with its introduction. The second (Child Care Rebate) indicates whether conceptions for births in the period of measurement could have been affected by the availability of the 30% rate of Child Care Rebate.
Entitlements to parental leave and other family-friendly work conditions. These were measured by dummy variables indicating whether the woman was entitled to paid maternity or parental leave, permanent part-time work, home-based work, and flexible hours.
Macroeconomic variables measured at the state or territory level. The male and female unemployment rates19 and labour force participation rates for October of the relevant year, GDP per head, and the household savings ratio were included. These were sourced from official statistics (ABS 2010b, 2010c).
Individual-level work-related variables. Labour force status was categorised according to whether the respondent was employed, not employed or not in the labour force, and, if employed, the current main occupation at the time of interview. The main occupation was coded according to the one-digit categories for the Australian and New Zealand Standard Classification of Occupations (ANZSCO) 2006 classification (ABS 2006b). Income was measured by real disposable income from all sources for the most recently completed financial year before the interview.20 Figures were adjusted to real terms using official consumer price indices.
Education-related variables. The highest level of education was categorised into bachelor’s degree or higher; diploma or certificate; completion of Year 12, the final year of schooling in Australia (or for migrants the overseas equivalent); and Year 11 (or its overseas equivalent) or less. A binary variable indicating whether the respondent was currently studying full-time also was included.
Migration-related variables. The various overseas countries of birth were grouped on geographical and linguistic grounds.
Marital status. This was categorised into whether the woman was married, cohabiting, divorced, separated or widowed, or never married and not cohabiting.
Age, parity, and their interaction. The categories for parity were zero, one, two, and three or more. Age was grouped into five-year ranges.
19 European studies have found differing effects of male unemployment and female unemployment (Sobotka,
Skirbekk, and Philipov 2011).
6. Results
6.1 The sample distribution and its change over time
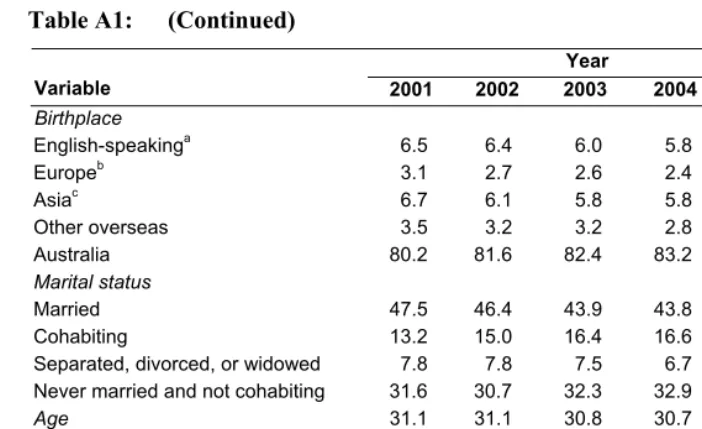
Appendix A presents the distribution of the independent variables used in the analysis and their variation over time. The means for the state-level macroeconomic variables indicate the improvement of the economy over time, with falling unemployment rates for both sexes, increasing GDP per head, and rapidly increasing mean disposable incomes and labour force participation rates for women. There is also a significant increase over time in the education levels of women of reproductive age. The percentage of women in unmarried cohabiting relationships increased and the percentage in legal marriages reduced. The percentage of women with parity zero increased as the percentages with parity two and parity three and above decreased.
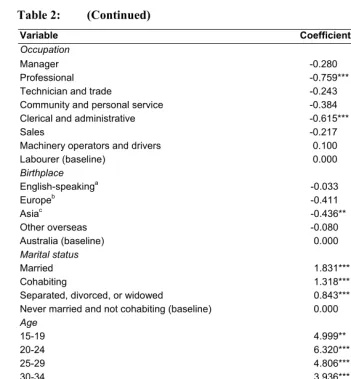
6.2 Factors affecting fertility
The results from the logistic regression model (Table 2) show that the effect of the changes which coincided with the introduction of the Baby Bonus has almost certainly been very small: the coefficient is very small in magnitude and not significantly different from zero. Although somewhat larger in magnitude, the effect of the introduction of the Child Care Rebate is also not statistically significant.21 The lack of significance of these coefficients is robust to one-year changes in the assumed time lag between the announcement of the change in benefits and its effect on fertility.22,23 The lack of significance of the family benefit variables is consistent with our theoretical expectations and with empirical analyses across a range of national contexts (Gauthier and Hatzius 1997; Gauthier 2007; Guest and Parr 2010).
The effects of a range of variables indicating whether the woman knew she was entitled to certain family-friendly working conditions, including paid parental or maternity leave, permanent part-time work, home-based work, and flexible working
21 Disaggregation of the data by parity has also been considered. The effects of the Baby Bonus and Child
Care Rebate are not significant at each parity.
22 The time lags considered were firstly five months between the budget announcement and the start of the
year of observation of the births and secondly 17 months.
23 Interaction terms between the family benefit variables and income were also tested for. One reason for this
hours, are small and not statistically significant.24 The effects of the state- or territory-level means of these variables were also tested for, since, with the possibility of women changing employment, access to such conditions may be a matter of their wider availability rather than whether they may be accessed through current employment. However, the effects of the state- and territory-level means were also not significant.
Table 2: Logistic regression of whether a woman aged 15 to 44 gave birth in the previous year: Australia 2002-2007
Variable Coefficient Standard Error
Family benefit regime
Baby Bonus 0.017 0.135
Child Care Rebate 0.103 0.139
Known work entitlements
Paid parental leave 0.012 0.111
Permanent part-time work 0.137 0.115
Home-based work 0.065 0.137
Flexible hours -0.043 0.105
State- or territory-level macroeconomic variables
Male unemployment rate -0.037 0.061
Female unemployment rate 0.039 0.048
Male labour force participation rate 0.036 0.045 Female labour force participation rate -0.026 0.050
Savings ratio 0.674 1.514
GDP per head 0.004 0.049
Highest education
Bachelor’s degree or above 0.530*** 0.144
Diploma or certificate 0.280** 0.138
Year 12 0.237* 0.131
Year 11 or less (baseline) 0.000
Full-time student -0.846*** 0.228
Real annual disposable income (A$’000) 0.007** 0.003 Current labour force status
Employed -0.073 0.228
Unemployed -0.343 0.255
Not in labour force (baseline) 0.000
Table 2: (Continued)
Variable Coefficient Standard Error
Occupation
Manager -0.280 0.250
Professional -0.759*** 0.240
Technician and trade -0.243 0.298
Community and personal service -0.384 0.260
Clerical and administrative -0.615*** 0.229
Sales -0.217 0.248
Machinery operators and drivers 0.100 0.503
Labourer (baseline) 0.000
Birthplace
English-speakinga -0.033 0.168
Europeb -0.411 0.303
Asiac -0.436** 0.203
Other overseas -0.080 0.226
Australia (baseline) 0.000
Marital status
Married 1.831*** 0.159
Cohabiting 1.318*** 0.158
Separated, divorced, or widowed 0.843*** 0.314 Never married and not cohabiting (baseline) 0.000
Age
15-19 4.999** 2.227
20-24 6.320*** 1.358
25-29 4.806*** 1.295
30-34 3.936*** 1.277
35-39 3.318*** 1.269
40-44 (baseline) 0.000
Parity
0 2.019 1.505
1 2.892** 1.359
2 1.474 1.412
Table 2: (Continued)
Variable Coefficient Standard Error
Age x parity interactions
15-19 × parity 0 -1.364 2.416
15-19 × parity 1 -1.905 2.461
15-19 × parity 2 (baseline)d 0.000
20-24 × parity 0 -3.201** 1.600
20-24 × parity 1 -3.342** 1.467
20-24 × parity 2 -1.479 1.536
20-24 × parity 3+ (baseline) 0.000
25-29 × parity 0 -1.408 1.548
25-29 × parity 1 -1.727 1.404
25-29 × parity 2 -1.386 1.467
25-29 × parity 3+ (baseline) 0.000
30-34 × parity 0 -0.251 1.534
30-34 × parity 1 -1.446 1.390
30-34 × parity 2 -0.953 1.444
30-34 × parity 3+ (baseline) 0.000
35-39 × parity 0 -0.316 1.539
35-39 × parity 1 -1.488 1.387
35-39 × parity 2 -1.341 1.441
35-39 × parity 3+ (baseline) 0.000
Constant -10.331*** 2.244
Sources: HILDA survey Waves 3-7 for dependent variables and Waves 1-5 for most of the independent variables. ABS (2010b, 2010c) for the state- or territory-level macroeconomic variables.
a. Main English-speaking overseas: i.e., Canada, Ireland, New Zealand, South Africa, United Kingdom and United States. b. Excludes Ireland and United Kingdom.
c. Excludes Middle East.
d. Baseline for 15-19 × parity effects is 15-19 × parity 2 because none of the 15-19 year olds have 3 or more children. *** p < 0.01, ** 0.01 ≤ p < 0.05, * 0.05 ≤ p < 0.10
The effects of a range of state- or territory-level macroeconomic variables are all small and not statistically significant.25 There are, however, significant effects of individual-level economic variables on fertility. These findings would seem to indicate that the economic effects on fertility are a matter of individual circumstance, as opposed to being related to the broader macroeconomic climate. Internationally the slope of the relationship between income and earnings differs, being positive in some contexts and negative in others (Andersson, Kreyenfeld, and Mika 2009).
25 Even when these variables are entered singly the measured effects are still not significant. Moreover, a
Table 2 shows that in Australia a woman’s income has a significant positive effect on her fertility.26 There are in theory two opposing effects of higher pre-first-child income on fertility: it makes children more affordable but may also increase their opportunity cost. The latter effect may have weakened over time in Australia as levels of post-child labour force participation have increased and the earnings forgone as a result of children have, therefore, reduced. This trend is partly due to an increasing substitution of childcare services for maternal time (Breusch and Gray 2004; Day and Dowrick 2010; Guest and Parr 2010). Among those who have already had one or more children, higher incomes may reflect circumstances which have allowed child-rearing and maintaining a high income to be readily combined, and thus a relatively low prospective loss of earnings from having further children may be anticipated. Conversely, in some cases, a lower income may be because a previously high income was sacrificed in order to look after children, and hence a high opportunity cost would be anticipated to result from future children. After controlling for income and the other variables in the model, the fertility of women in employment varies significantly with the type of occupation. Women in professional occupations have the lowest fertility, followed by women in clerical and administrative occupations. Further analysis shows that this is largely due to lower rates of progression from parity zero in these occupational groups.
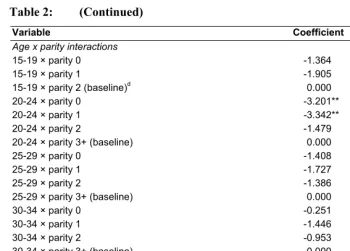
There are significant baseline effects and interactions between age and parity. Between the ages of 20 and 24 women with higher parities have higher subsequent fertility. However, above age 25 it is the women with parities below two who have the higher subsequent fertility. This reflects a pattern of “stopping” by those at higher parities and “catch-up” by women with zero or one child. The effects of marital status are large, significant, and in the expected direction. Currently married women have the highest fertility, followed by women in cohabiting relationships. Women who have never married and are not cohabiting have the lowest fertility.
Not surprisingly women who are currently in full-time education have significantly lower fertility than women who are not studying full-time. After controlling for the effects of age and parity and the other variables in the model, fertility increases significantly as the woman’s highest level of education increases.27 Other analyses of the HILDA data have produced a similar result (Drago et al. 2010; Parr 2010). The education effects partly reflect the fact that the “catch-up effect” among women in the later reproductive ages is stronger among the more highly educated.28 There is also a pattern among the minority of the more highly educated who have already attained
26 The possibility of a non-linear effect was tested for by including squared and cubic terms. However, these
were later removed due to lack of significance.
27 The exclusion of the remote areas where fertility is high and levels of education are low may have affected
this pattern.
higher parities of having higher propensities for further parity progression than the less educated who have reached these parities. Since higher education is an indicator of higher lifetime earnings, the explanation may be linked to any difference in the prospective work-related costs of children having become less important than the greater affordability of children which higher education would create. The affordability of additional children among the more educated women would also reflect the fact that more of them have higher-earning spouses.
There are significant effects of birthplace. The fertility of migrant women is generally lower than that of the Australia-born, with the fertility of women who were born in Asia being significantly so.29 The lower fertility of Asia-born women reflects especially low rates of progression from one child to two, a pattern which would be influenced by the much higher propensities of the China-born and other East Asian groups to have one-child families (Parr 2007). Thus, in contrast to the pattern for some European countries and the United States, increasing levels of immigration have not contributed to the increase in fertility in Australia (Sobotka 2008; McDonald and Moyle 2010).
7. Discussion
Australia’s early 21st-century increase in total fertility has coincided with the Australian government’s adoption of a view that the national fertility rate is “too low” and its implementation of policies, in particular increases in family benefits, to raise the national fertility rate (UNPD 2006, 2008, 2010). This paper contributes to the literature by showing empirically that rather than Australia providing an example of successful pronatalist policy, the contribution to fertility change of the range of changes to family benefits which coincided with the Baby Bonus has most probably been minor. The Child Care Rebate will cumulatively become a more substantial benefit for working mothers. However, so far at least, we have not found conclusive evidence that this rebate has increased fertility.30 The lack of significance of the two family benefit-related variables is broadly consistent with the findings of the international literature and of simulations for Australia (Gauthier 2007; Guest and Parr 2010). The lack of
29 In Australia migrants, especially the Asia-born, tend to be more highly educated than the Australia-born
(Parr and Guo 2005). The effects of birthplace are net of the fertility-increasing effects of these higher levels of education.
30 It is plausible that the introduction of the Child Care Rebate could have contributed to the increase in the
significance of the Baby Bonus and the changes which occurred concurrently may be related to their fairly modest net value (Lattimore and Pobke 2008). Our findings differ from Drago et al. (2010), who found that the introduction of the Baby Bonus produced a small but significant increase in fertility intentions and inferred that a similar increase in fertility would result. The wider range of control variables used in our study, particularly the interactions between age and parity, may explain the differing assessments of the effects of the Baby Bonus.
Our study further contributes to the literature by empirically assessing the effects on individual-level fertility of entitlements to family-friendly working conditions. We find that the effects of changes in entitlement to family-friendly working conditions also appear to have been slight, because the fertility of women who know their work entitles them to such benefits is not significantly higher31 and because the changes in levels of known entitlement to such conditions have been slight. This may provide grounds to speculate that the introduction in 2011 of a universal government-funded paid parental leave scheme will not raise fertility substantially.32
If family benefit changes and access to family-friendly working conditions do not offer robust explanations for the increase in fertility over the period 2002-2007, what else might have done so? Our analysis finds a range of demographic and socioeconomic variables which are significantly related to fertility specifically: interactions between age and parity, marital status, education, income, and occupation. Considering the directions of these effects and the patterns of change over time (Appendix A), we infer that the first factor tending to produce fertility increase is the changing distribution of women of reproductive age by age and parity, particularly the increasing proportions of women between 2001 and 2005 at parity zero in the later childbearing ages. These women have a higher than average propensity to have children between one and two years later (there is a “catch-up effect”). The increased percentages of low-parity women in the later ages would be a legacy of the postponement of fertility in the past (a tempo effect) and a slowing or ending of postponement (Sobotka and Lutz 2009). Our models also show that fertility is reduced while studying and the “catch-up effect” is stronger among more highly educated women. Thus patterns of participation in and graduation from education may be seen as structural influences which contribute to tempo distortion and its subsequent correction: there will be reduced fertility when larger cohorts of students are obtaining their education, followed by subsequent fertility increases (Sobotka, Skirbekk, and Philipov 2011). Current government policy is to raise the percentage of 25 to 34-year-olds with at least a bachelor’s-level qualification from 29% to 40% (Bradley et al. 2008). Our model implies that the pursuit of these ambitious
31 State-level averages for these variables also had small and insignificant effects.
32 In contrast to the Baby Bonus, raising fertility rates is not a stated objective of the Paid Parental Leave
targets would tend to encourage fertility postponement, with an initial decrease in fertility at younger ages as numbers of students are increased, being eventually recuperated as this flows through to an increased number of graduates who have become established in the labour market.
Our study shows that economic factors are also related to fertility. The multilevel formulation of our models shows that the effects of economic variables are mostly the product of changes at the individual level; the evidence of a woman’s fertility being affected by the broader macroeconomic climate in which she lives is weak. The effect of economic change over time inferred by our model is a complex mixture of counterbalancing effects of changes in patterns of income and employment. The time period considered was an economic “boom time”. Our model suggests that the considerable increase in real disposable income per se has contributed to the increase in fertility.33 However, there have also simultaneously been changes in the patterns of women’s occupations which, all other things being equal, have had fertility-reducing effects. The increase in Australia’s total fertility has occurred despite a declining prevalence of marriage among women in the reproductive age groups. If this trend were to continue,34 particularly in the context of weaker economic conditions, it may result in a stalling or even a partial reversal of Australia’s early 21st-century fertility increase.
8. Acknowledgements
This research was supported by an Australian Research Council (ARC) Discovery Grant funding scheme (project number DP0984378). This paper uses unit record data from the Household, Income and Labour Dynamics in Australia (HILDA) survey. The HILDA Project was initiated and is funded by the Australian Government Department of Families, Housing, Community Services and Indigenous Affairs (FaHCSIA) and is managed by the Melbourne Institute of Applied Economic and Social Research (Melbourne Institute). The findings and views reported in this paper, however, are those of the authors and should not be attributed to either FaHCSIA or the Melbourne Institute.
33 Langbridge et al. (2010) attribute an increase in the General Fertility Rate in Western Australia between
2004 and 2006 to the introduction of the Baby Bonus. However, as they acknowledge, the especially rapid economic growth in this state due to the resources boom is a competing explanation for which they have been unable to control.
34 Since 2003 female age-specific marriage rates per 1,000 population have increased across the 25 to 44 age
References
Andersson, G., Kreyenfeld, M., and Mika, T. (2009). Welfare state context, female earnings and childbearing. Rostock: Max Planck Institute for Demographic Research. MPIDR working paper. (WP-2009-026).
Australian Bureau of Statistics (ABS) (2006a). Pregnancy and employment transitions, Australia. Canberra: Commonwealth of Australia. (Catalogue number 4913.0). Australian Bureau of Statistics (ABS) (2006b). ANZSCO – Australian and New
Zealand standard classification of occupations. Canberra: Commonwealth of Australia. (Catalogue number 1220.0).
Australian Bureau of Statistics (ABS) (2007a). Marriages, Australia, 2007. Canberra: Commonwealth of Australia. (Catalogue number 3306.0.55.001).
Australian Bureau of Statistics (ABS) (2007b). Divorces, Australia, 2007. Canberra: Commonwealth of Australia. (Catalogue number 3307.0.55.001).
Australian Bureau of Statistics (ABS) (2008a). Australian historical population statistics. Canberra: Commonwealth of Australia. (Catalogue number 3105.0.65.001).
Australian Bureau of Statistics (ABS) (2008b). Australian social trends 2008. Canberra: Commonwealth of Australia. (Catalogue number 4102.0).
Australian Bureau of Statistics (ABS) (2008c). Consumer price index. Canberra: Commonwealth of Australia. (Catalogue number 6401.0).
Australian Bureau of Statistics (ABS) (2009). Births, Australia, 2008. Canberra: Commonwealth of Australia. (Catalogue number 3301.0).
Australian Bureau of Statistics (ABS) (2010a). Births 2009. Canberra: Commonwealth of Australia. (Catalogue number 3301.0).
Australian Bureau of Statistics (ABS) (2010b). Labour force, Australia. Canberra: Commonwealth of Australia. (Catalogue number 6202.0).
Australian Bureau of Statistics (ABS) (2010c). Australian national accounts: National income, expenditure and product. Canberra: Commonwealth of Australia. (Catalogue number 5206.0).
Australian Government (2004). Budget 2004-05: More help for families. Canberra: Commonwealth of Australia. http://www.budget.gov.au/2004-05.
Australian Government (2007). Intergenerational report 2007. Canberra: Commonwealth of Australia. http://www.treasury.gov.au.
Australian Government (2008). Budget 2008-09. Canberra: Commonwealth of Australia. http://www.budget.gov.au/.
Australian Government (2010a). Australia to 2050: Future challenges. Canberra: Commonwealth of Australia. http://www.treasury.gov.au/igr/igr2010/report/pdf/ IGR_2010.pdf.
Australian Government (2010b). Paid parental leave scheme. Canberra: Commonwealth of Australia. http://www.familyassist.gov.au.
Australian Government (2010c). Fair work information statement. Canberra: Commonwealth of Australia. http://www.fairwork.gov.au.
Australian Government Department of Families, Community Services and Indigenous Affairs (FaHCSIA) (2007). Childcare: Information for researchers. http://www.facs.gov.au/internet/facsinternet.nsf/childcare/research-nav.htm. Australian Taxation Office (ATO) (2010). What is the baby bonus? Canberra:
Commonwealth of Australia. http://www.ato.gov.au/.
Baird, M. (2005). Who’s rocking the baby? Making the Link 16: 32-38.
Baxter, J. (2008). Is money the main reason mothers return to work after childbearing? Journal of Population Research 25(2): 141-160. doi:10.1007/BF03031946.
Birrell, R., Rapson, V., and Hourigan, C. (2004). Men and women apart: Partnering in Australia. Melbourne: Australian Family Association and Monash University. Bongaarts, J. and Feeney, G. (1998). On the quantum and tempo of fertility. Population
and Development Review 24(2): 271-291. doi:10.2307/2807974.
Bongaarts, J. and Feeney, G. (2010). When is a tempo effect a temp distortion? Genus 66(2): 1-15.
Bradley, D., Noonan, P., Nugent, H., and Scales, B. (2008). Review of higher education: Final report. Canberra: Commonwealth of Australia. http://www.deewr.gov.au/HigherEducation/Review/.
Chan, A. and Sage, L.C. (2005). Estimating Australia’s abortion rates 1985-2003. The Medical Journal of Australia 182(9): 447-452.
Corr, P. and Kippen, R. (2006). The case for parity and birth-order statistics. Australian and New Zealand Journal of Statistics 48(2): 171-200. doi:10.1111/j.1467-842X.2006.00433.x.
Costello, P. (2004). Budget Speech 2004-05. Canberra: Australian Government. http://www.budget.gov.au/2004-05/speech/html/speech.htm.
Craig, L. (2007a). How employed mothers in Australia find time for both market work and childcare. Journal of Family and Economic Issues 28(1): 69-87.
doi:10.1007/s10834-006-9047-2.
Craig, L. (2007b). Contemporary motherhood: The impact of children on adult time. Aldershot: Ashgate Publishing.
Daniels, D. (2009). Social security payments for people caring for children, 1912 to 2008: A chronology. Canberra: Parliamentary Library, Parliament of Australia. http://www.aph.gov.au/Library/pubs/BN/2008-09/children.htm.
Davis, E. (2001). Implementing work and family policies in Australia. Making the Link 12: 65-67.
Day, C. and Dowrick, S. (2010). What entices the stork? Fertility, education and family payments. Economic Record 86(Supplement S1): 69-79. doi:10.1111/j.1475-4932.2010.00664.x.
Dodson, L. (2004). The mother of all spending sprees. Sydney Morning Herald 12 May 2004. http://www.smh.com.au/articles/2004/05/11/1084041413803.html.
Drago, R., Sawyer, K., Sheffler, K.M., Warren, D., and Wooden, M. (2010). Did Australia’s baby bonus increase fertility intentions and births? Population Research and Policy Review 30(3): 381-397. doi:10.1007/s11113-010-9193-y.
Ermisch, J. (1988). Econometric analysis of birth rate dynamics in Britain. Journal of Human Resources 23(4): 563-576. doi:10.2307/145814.
Eurostat (2007). Population and Social Conditions Database. [electronic resource]. European Commission. http://epp.eurostat.ec.europa.eu.
Gauthier, A.H. (2007). The impact of family policies on fertility in industrialized countries: A review of the literature. Population Research and Policy Review
26(3): 323-346. doi:10.1007/s11113-007-9033-x.
Gauthier, A.H. (2010a). Comparative Family Policy Database, Version 3 [electronic resource]. Netherlands Interdisciplinary Demographic Institute and Max Planck Institute for Demographic Research (distributors). http://www.demogr.mpg.de. Gauthier, A.H. (2010b). The impact of the economic crisis on family policies in the
Economic Union. Report to the European Union. http://www.thefamilywatch. org/doc/doc-0092-es.pdf.
Gauthier, A.H. and Hatzius, J. (1997). Family benefits and fertility: An econometric analysis. Population Studies 51(3): 295-306. doi:10.1080/003247203 1000150066.
Goldstein, H. (1995). Multilevel Statistical Models. London: Arnold.
Goldstein, J.R., Sobotka, T., and Jasilioniene, A. (2009). The end of “lowest-low”
fertility? Population and Development Review 35(4): 663-699.
doi:10.1111/j.1728-4457.2009.00304.x.
Gray, E. and McDonald, P. (2010). Using a reproductive life course approach to understand contraceptive method use in Australia. Journal of Biosocial Science 42(1): 43-57. doi:10.1017/S0021932009990381.
Guest, R. and Parr, N. (2010). The effects of family benefits on childbearing decisions: A household optimising approach applied to Australia. Economic Record 86(275): 609-619. doi:10.1111/j.1475-4932.2010.00663.x.
Heard, G. (2006). Pronatalism under Howard. People and Place 14(3): 12-25.
Heard, G. (2008). Partnerships at the 2006 census: Preliminary findings. People and Place 16(1): 31-39.
Henman, P., Percival, R., Harding, A., and Gray, M. (2007). Costs of children: Research commissioned by the ministerial taskforce on child support. Canberra: Australian Government Department of Families, Community Services and Indigenous Affairs. (Occasional paper no. 18).
Kohler, H.-P. and Ortega, J.A. (2002). Tempo-adjusted period parity progression measures, fertility postponement and completed cohort fertility. Demographic Research 6(6): 91-144. doi:10.4054/DemRes.2002.6.6.
Langbridge, A.T., Nassar, N., Li, J., Jacoby, P., and Stanley, F.J. (2010). The impact of monetary incentives on general fertility rates in Western Australia. Journal of Epidemiology and Community Health. doi:10.1136/jech.2009.100347.
Lattimore, R. and Pobke, C. (2008). Recent trends in Australian fertility. Canberra: Australian Government. Australian Government Productivity Commission staff working paper.
Liang, K.Y. and Zeger, S.L. (1986). Longitudinal data analysis using generalized linear models. Biometrika 73(1): 13-22. doi:10.1093/biomet/73.1.13.
McDonald, P. (2000a). Gender equity, social institutions and the future of fertility. Journal of Population Research 17(1): 1-16. doi:10.1007/BF03029445.
McDonald, P. (2000b). Gender equity in theories of fertility transition. Population and Development Review 26(3): 427-439. doi:10.1111/j.1728-4457.2000.00427.x.
McDonald, P. (2000c). Low fertility in Australia: Evidence, causes and policy responses. People and Place 8(2): 6-21
McDonald, P. (2001). Family support policy in Australia: The need for a paradigm shift. People and Place 9(2): 14-20.
McDonald, P. (2002). Sustaining fertility through public policy: The range of options. Population - English Edition 57(3): 417-446. doi:10.2307/3246634.
McDonald, P. (2006a). An assessment of policies that support having children from the perspectives of equity, efficiency and efficacy. Vienna Yearbook of Population Research 2006: 213-234. doi:10.1553/populationyearbook2006s213.
McDonald, P. (2006b). Low fertility and the state: The efficacy of policy. Population and Development Review 32(3): 485-510. doi:10.1111/j.1728-4457. 2006.00134.x.
McDonald, P. and Moyle, H. (2010). Why do the English-speaking countries have relatively high fertility? Journal of Population Research 27(4): 247-273.
doi:10.1007/s12546-010-9043-0.
Office for National Statistics (ONS) (2009). Conception and fertility rates. United Kingdom. http://www.statistics.gov.uk/.
Orsal, D.D.K. and Goldstein, J.R. (2010). The increasing importance of economic conditions on fertility. Paper presented at the Annual Meeting of the Population Association of America, Dallas, Texas, April 15-17, 2010.
Parr, N.J. (2005). Family background, schooling and childlessness in Australia. Journal of Biosocial Science 37(2): 229-243. doi:10.1017/S0021932004006546.
Parr, N.J. (2007). Which women stop at one child in Australia? Journal of Population Research 24(2): 207-225. doi:10.1007/BF03031931.
Parr, N.J. (2010). Satisfaction with life as an antecedent of fertility. Partner + happiness =children? Demographic Research 22(21): 635-662. doi:10.4054/ DemRes.2010.22.21.
Parr, N. and Guo, F. (2005). The occupational concentration and mobility of Asian immigrants in Australia. Asian and Pacific Migration Journal 14(3): 351-380. Parr, N. and Siedlecky, S. (2007). Use of ‘dual protection’ and other combinations of
contraceptive methods in Australia. Australian and New Zealand Journal of Public Health 31(6): 567-570. doi:10.1111/j.1753-6405.2007.00145.x.
Productivity Commission (2009). Paid Parental Leave: Support for Parents with Newborn Children. Canberra: Commonwealth of Australia. (Report Number 47). Sobotka, T. (2008). The rising importance of migrants for childbearing in Europe.
Demographic Research 19(9): 225-248. doi:10.4054/DemRes.2008.19.9.
Sobotka, T. and Lutz, W. (2009). Misleading policy messages from the period TFR: Should we stop using it? Vienna: Vienna Institute of Demography. (European Demographic Research Papers 2009; 4).
Sobotka, T., Skirbekk, V., and Philipov, D. (2011). Economic recession and fertility in the developed world. Population and Development Review 37(2): 267-306.
doi:10.1111/j.1728-4457.2011.00411.x.
Statistics New Zealand (2009). Births –Tables. New Zealand. http://www.stats.govt.nz. United Nations Population Division (UNPD) (2006). World Population Policies 2005.
New York: United Nations.
United Nations Population Division (UNPD) (2010). World Population Policies 2009. New York: United Nations.
United Nations Statistical Division (UNSD) (2008). Statistics and indicators on women and men. [electronic resource]. http://unstats.un.org/unsd/demographic/.
Watson, N. and Wooden, M. (2002a). The household, income and labour dynamics in Australia (HILDA) survey: Wave 1 survey methodology, HILDA project technical paper series. (no 1/02). http://www.melbourneinstitute.com/hilda. Watson, N. and Wooden, M. (2002b). Assessing the quality of the HILDA survey wave
1 data, HILDA project technical paper series. (no 4/02). http://www.melbourneinstitute.com/hilda/.
Weil, D.N. (1999). Why has fertility fallen below replacement in industrial nations, and will it last? Population growth, dependency, and consumption. The American Economic Review 89(2): 251-255. doi:10.1257/aer.89.2.251.
Whitehouse, G., Baird, M., Diamond, C., and Hosking, A. (2006). The parental leave in Australia survey: November 2006 report. http://www.polsis.uq.edu.au/parental-leave/level1-report.pdf.
Wooden, M. and Watson, N. (2007). The HILDA survey and its contribution to economic and social research (so far). Economic Record 83(261): 208-231.
doi:10.1111/j.1475-4932.2007.00395.x.
Yusuf, F. and Siedlecky, S. (2002). Legal abortion in South Australia: A review of the first 30 years. Australian and New Zealand Journal of Obstetrics and Gynaecology 42(1): 15-21. doi:10.1111/j.0004-8666.2002.00015.x.
Appendix A
Table A1: Percentages or means of observations for women aged 15 to 44 by year of measurement: Australia 2001-2005 (N = 15,477)
Year
Variable 2001 2002 2003 2004 2005 All
Male unemployment rate 6.9 5.8 5.4 4.4 4.5 5.4 Female unemployment rate 7.6 6.4 6.4 5.6 5.4 6.3 Male labour force participation 71.9 71.2 71.5 71.4 72.0 71.6 Female labour force participation 55.1 55.3 55.6 55.9 57.1 55.8
Savings ratio 10.3 10.4 8.5 7.6 7.4 8.9
State GDP per head (A$’000) 11.1 11.7 12.2 12.6 13.1 12.1 Known work entitlements
Paid parental leave 35.7 31.3 33.1 34.2 39.8 34.7 Permanent part-time work 46.1 46.5 46.2 45.9 49.5 46.8 Home-based work 14.7 12.5 12.5 12.9 14.0 13.3 Flexible hours 37.1 33.2 32.8 35.5 36.7 35.1 Highest education
Bachelor’s degree or above 22.4 23.4 23.3 24.5 24.6 23.6 Diploma or certificate 21.3 22.1 23.3 23.2 24.1 22.8
Year 12 20.7 20.4 20.8 21.0 20.5 20.7
Year 11 or less 35.6 34.1 32.6 31.4 30.8 32.9 Full-time student 14.5 15.4 15.2 15.2 15.6 15.2 Real annual disposable income
(A$’000)
19.1 19.4 19.3 20.0 20.7 19.7
Current labour force status
Employed 66.5 67.5 67.5 68.7 71.3 68.3
Unemployed 4.3 4.9 4.9 4.8 4.1 4.6
Not in labour force 29.2 27.6 27.6 26.5 24.6 27.1 Occupation
Manager 5.1 5.7 5.6 5.8 5.2 5.5
Professional 17.7 17.9 18.0 17.9 19.0 18.1
Technician and trade 3.5 3.1 2.6 2.8 3.1 3.0 Community and personal service 9.3 9.7 10.2 10.3 11.3 10.2 Clerical and administrative 15.7 15.9 15.5 15.5 15.9 15.7
Sales 9.4 9.5 9.8 11.0 11.1 10.2
Machinery operators and drivers 0.7 0.6 0.6 0.6 0.8 0.7
Table A1: (Continued)
Year
Variable 2001 2002 2003 2004 2005 All
Birthplace
English-speakinga 6.5 6.4 6.0 5.8 5.3 6.0
Europeb 3.1 2.7 2.6 2.4 2.4 2.7
Asiac 6.7 6.1 5.8 5.8 5.5 6.0
Other overseas 3.5 3.2 3.2 2.8 3.0 3.1
Australia 80.2 81.6 82.4 83.2 83.7 82.2
Marital status
Married 47.5 46.4 43.9 43.8 42.1 44.8
Cohabiting 13.2 15.0 16.4 16.6 16.7 15.5
Separated, divorced, or widowed 7.8 7.8 7.5 6.7 6.3 7.2 Never married and not cohabiting 31.6 30.7 32.3 32.9 34.9 32.5
Age 31.1 31.1 30.8 30.7 30.4 30.8
Parity
0 42.7 43.9 45.5 45.9 48.2 45.2
1 13.6 12.9 13.2 14.0 13.1 13.4
2 23.5 23.9 22.3 22.0 21.2 22.6
3+ 20.1 19.4 18.9 18.0 17.5 18.8
Sources: HILDA survey Waves 3-7 for dependent variables and Waves 1-5 for most of the independent variables. ABS (2010b, 2010c) for the state- or territory-level macroeconomic variables.
a. Main English-speaking overseas: i.e., Canada, Ireland, New Zealand, South Africa, United Kingdom and United States. b. Excludes Ireland and United Kingdom.