in the population sciences published by the Max Planck Institute for Demographic Research Konrad-Zuse Str. 1, D-18057 Rostock · GERMANY www.demographic-research.org
DEMOGRAPHIC RESEARCH
VOLUME 11, ARTICLE 12, PAGES 335-356
PUBLISHED 10 December 2004
www.demographic-research.org/Volumes/Vol11/12/
DOI: 10.4054/DemRes.2004.11.12
Research Article
Education at home: the age-specific pattern
of migration between the Netherlands and
the former Dutch East Indies around 1930
Evert van Imhoff
Gijs Beets
1 Introduction 336
2 Historical background 338
3 The 1930 census and the missing teenagers 339
4 Cohort effect: historical births series 340
5 Age effect: an estimate via stable population theory 344
6 Age effect: children residing abroad 347
7 Dutch East Indies students in the Netherlands 347
8 Conclusions 352
Notes 355
Research Article
Education at home: the age-specific pattern of migration between
the Netherlands and the former Dutch East Indies around 1930
Evert van Imhoff 1
Gijs Beets 2
Abstract
The 1930 population census of the former Dutch East Indies (currently Indonesia) shows for the European population a striking shortage in the age range 10-20. This paper deals with the possible causes of this constriction in the age structure, in particular, the phenomenon of European children attending secondary education in the Netherlands. Using sample data from the city of The Hague, it is estimated that the proportion of students in the Netherlands born in the Dutch East Indies was about 3 per cent, implying that the teenager gap in the Dutch East Indies was for about half due to a cohort effect and for the other half due to the ‘education at home’ effect.
1
Due to his sudden and unexpected death in July 2004, Dr. Evert van Imhoff could unfortunately not contribute to the revision of this article after helpful comments and suggestions had arrived from two anonymous reviewers of Demographic Research.
2
1. Introduction
The colonial era of the Netherlands started in the late sixteenth century and came mostly to an end in the twentieth century with the independence of Indonesia in 1949 and of Surinam in 1975. Today, six islands in the Caribbean (the Dutch Antilles) are the only overseas territories left. By far the most important Dutch colony, by all standards, was the former Dutch East Indies (1), currently Indonesia. The economic and demographic significance of the Dutch East Indies for the Netherlands was immense. Following the Second World War, the Dutch East Indies became the independent Republic of Indonesia in 1949; in the aftermath of the independence, thousands of people of both Dutch and mixed Dutch / native Indonesian descent moved to the Netherlands, establishing the largest migrant sub-population in Dutch demographic history.
The most important category within the total Indo-Dutch population consists of or originates from persons who lived in the Dutch East Indies before and during the Japanese occupation of 1942-1945 and had the legal status of being ‘Dutch’. In the available pre-war population statistics, the group ‘Dutch’ is usually not distinguished separately, but included in the somewhat broader group ‘Europeans (including the formally assimilated)’, of which the Dutch comprised about 85-90 per cent. Also, detailed demographic data distinguished by age for the East Indies are most recently available from the census of 1930. Since age is obviously a crucial variable, any demographic reconstruction of the Indo-Dutch population (2) must start from the 1930 census.
The 1930 census age distribution of the Europeans in the Dutch East Indies is depicted in Figure 1 and has a very peculiar feature: a shortage in the age range 10-20. This peculiarity not only has several consequences for the demographic reconstruction of the Indo-Dutch population, but also has, to the best of our knowledge, never been described before in the demographic literature. We will denote it by the term ‘education
at home’ effect, which constitutes the main topic of the present paper. ‘Education at
4000 3000 2000 1000 0 1000 2000 3000 4000 0
5 10 15 20 25 30 35 40 45 50 55 60 65 70 75 80 85 90 95
men w omen
Figure 1: European population in the Dutch East Indies by age and sex, 1930 (absolute numbers)
Source: Census of 1930 in the Dutch East Indies (1933).
2. Historical background
The arrival of the first Dutchmen at the end of the sixteenth century ushered in a period of long-standing relationships between Europe and the Indian Archipelago. In this period, which was characterized by colonization, settlement and trade, much manpower was needed, in great majority from the mother country. At first, military men and traders (mostly staff of the Dutch United East Indies Company (3)) left for the colony, followed by civil servants and persons with other professions. Most of these persons were unmarried men, and those who were married left their wife and family back home in Europe in view of the harsh living conditions. Moreover, the arrival of married persons was almost impossible because of restrictions made by the authorities (Nieuwenhuys 1982). Until the mid-nineteenth century, the majority of the Dutch community in the Dutch East Indies consisted mostly of men. The number of Europeans (military men excluded) was estimated at 2,000 on the islands of Java and Madura in 1814. This number increased to 17,300 in 1852 next to some 4,800 on the other islands. Around 1860 there were some 43,000 European men and less than 1,000 European women.
The shortage of European women was instrumental for the conclusion of concubinages with native women. These mixed concubinages, as well as (to a lesser extent) mixed marriages, were the origin of the Indo-Dutch population in the Dutch East Indies (for a full account, see Taylor 1983). The Dutch United East Indies Company did not accept concubinage and the church council established a list of ‘sinners’. Nevertheless, by 1800 concubinage was widespread and in the capital city Batavia (currently Jakarta) it even was part of the city’s lifestyle. An unmarried concubine had the same status as a legal wife (Van Marle 1952).
In the early period of the colonization, men came to the Archipelago for their career, to earn money, and to return back home afterwards. These persons are noted as the so-called movers. However, over time, part of the Europeans began to consider the Archipelago as their home country, becoming stayers who remained for a longer time or even permanently. The core of these stayers consisted of families who settled from one generation to the next. This group increased in number by natural growth, as well as by the arrival of newcomers turning into stayers.
1880-1895 there were 500 women for 1,000 men among the European population. Around 1940 the number of men and women was almost equal. The settlement of Europeans became increasingly permanent. In 1900, Europeans and their descendants counted over 91,000, a rapid increase from 44,000 in 1860. By 1920, the size of the European population had increased further to 170,000, and by 1930 to 240,000.
Notwithstanding the improved and expanding infrastructure among which was the increase of the number and types of schools for Europeans as well as native people by the end of the nineteenth century, Europeans preferred to send their children to the home country for the purpose of secondary and higher education. These children were mostly aged 12 to 23 years. After finishing their studies, most children returned to the Dutch Indies to join their parents, to work and make a career. Some returned to the Netherlands after retirement from duty in the tropics (usually around age 50 in those days). Others remained, married to a European or native woman and continued their stay in the Archipelago. It also happened that children did not return to the Dutch Indies after their studies if for example their studies were only finished after the parents had returned from the Archipelago.
In 1942, this pattern of demographic development of the European population in the East Indies was rudely interrupted. In that year, Japan invaded the Archipelago and the Second World War occupation began. Immediately after the war, the nationalist movement took over and after four years of fruitless struggle, the Dutch granted independence to the Republic of Indonesia in 1949. In the wake of the war and the independence, a large number of the Indo-Dutch people and their descendants left for the Netherlands; a significant proportion of them arrived in that country for the first time in their life. Others went either directly or via the Netherlands to another country like the United States of America, Australia, New Zealand or South Africa. Only a small number opted for the Indonesian nationality and stayed.
3. The 1930 census and the missing teenagers
Since the mid-nineteenth century, vital statistics were reported yearly by the colonial administration. These statistics concerned births, deaths and marriages between Europeans and between Europeans and native persons, Chinese or other Asians. However, initially they did not cover the total area of the Dutch East Indies.
were not fully reliable. The results of the second census, held at 7 October 1930 were regarded reliable. In the second half of the 1930s preparations were made for a 1940 census and a test-census was conducted in two districts in 1938 (Gooszen 1994). The census of 1940 eventually did not take place because of the Second World War.
Figure 1, already given above, shows the composition by age and sex of the Europeans according to the 1930 Dutch East Indies census. A very striking feature of this graph is the relatively small share of the age range 10-20 years, i.e. the age category of secondary school students. Two possible explanations for the constriction in the age structure of the Dutch East Indies European population come to mind:
• The constriction is due to a cohort effect. The 10-20 year olds in 1930 are born in 1910-1920, and the birth levels in the Dutch Indies during this period were less numerous than before 1910 and in 1920-1930.
• The constriction is due to an age effect. The Indo-Dutch teenagers do exist, but they are not counted in the Dutch Indies census because they reside outside the Dutch East Indies. The most obvious reason for that absence is, that many children of Europeans (Dutch) attend secondary and higher education in Europe (the Netherlands).
Both these explanations will be scrutinized in the sections to follow.
4. Cohort effect: historical births series
0 1000 2000 3000 4000 5000 6000 7000
0 5 10 15 20 25
age 1930
stock 1930 births 1910-1930
Figure 2: Europeans 1930 and births among Europeans 1910-30, by age in 1930 (absolute numbers)
Source: Census of 1930 (stock), Colonial and Dutch East Indies Reports (births).
At first sight, it seems as if the age composition in 1930 corresponds quite nicely with the historical births series among Europeans in the Dutch East Indies. In other words: the constriction in 1930 seems to be a pure cohort effect. However, such a conclusion would be very premature, for several reasons.
First, mortality in the Dutch East Indies was far from negligible, also among Europeans and certainly among young children. Because of the effect of mortality, the distance between the curves ‘stock 1930’ and ‘births’ would have to grow larger with increasing age. This, however, is not the case.
amounted to about 15 per cent of annual births. Because of the effect of recognition, the distance between the curves ‘stock 1930’ and ‘births’ would have to grow smaller with increasing age, and the curve ‘stock 1930’ could even be located above the ‘births’ curve. However, figure 2 contains no evidence of this.
Third and last, we have to seriously question the reliability of the birth statistics from the Colonial and Dutch East Indies Reports. ‘All Europeans (including the formally assimilated) were registered with the department of Justice in Batavia and here also a civil registry of them was kept’ (Gooszen 1994: 55). However, it is not clear whether this civil registry provided truly reliable demographic data, especially before 1920.
0 2000 4000 6000 8000 10000 12000 14000 16000
1900 1905 1910 1915 1920 1925 1930 1935 1940
mig ra tio n 0 1000 2000 3000 4000 5000 6000 7000 8000 bi rt hs
births (axis right)
Immigration from Netherlands (axis left)
Emigration to Netherlands (axis left)
Figure 3: Migration between the Netherlands and the Dutch East Indies, 1900-40 (absolute numbers)
Source: Statistics Netherlands (migration: until 1936, 90% of the migration between the Netherlands and total Colonies); Colonial and Dutch East Indies Reports (births).
The trajectory of the births series shows only very limited correspondence to the trajectory of the immigration from the Netherlands. Whether such a correspondence should be there, is dependent on the question where those births originated from: if those births were primarily from Indo-Dutch men, then little correspondence would be expected; but if those births were to an important extent from ‘fresh’ Dutch couples, then much correspondence would be expected. However, the extent of the correlation between immigration and births is quite different, depending on the time period, and this is very hard to understand. The time trend of the migration pattern does not offer a clear explanation for a birth trajectory that until 1920 is almost linearly increasing and after 1920 all of a sudden changes into a structurally higher but at the same time more or less constant level.
due to a cohort effect, the extent of which is very difficult to assess with these demographic data.
5. Age effect: an estimate via stable population theory
In the previous section, we investigated whether the teenager gap can be a cohort effect. In contrast, the current section explores whether it can be an age effect, and how strong such an age effect would have to be.
It is quite likely that age effects operated in shaping the age structure of the European population in the Dutch East Indies. We know that the general pattern of the migration flows between the Dutch East Indies and Europe (the Netherlands) was highly age-specific: towards Europe by the end of primary school, towards the Dutch East Indies at the start of the labour career, and again towards Europe at the age of retirement. As a result, even with a relatively small net migration between Europe and the Dutch East Indies, migration still has a sizeable effect on the age structure of the Europeans.
Unfortunately, a number of problems occur when trying to reconstruct the age-specific migration pattern between the Dutch Indies and Europe (the Netherlands). There are no direct observations on the age distribution of those migrants, neither from the Colonial and Dutch East Indies Reports, nor from the Netherlands migration statistics. A possible approach could have been, to take the age structure of the Europeans from two consecutive censuses and to reconstruct the non-migration components (mainly births and deaths) by age for the intercensal period; the remaining difference between the two age structures would then be the age effect of migration. However, the age detail in the Dutch East Indies census of 1920 is insufficient for such an exercise. And even if we could have used the 1920 census, an intercensus period of 10 years is still too long to allow the accurate measurement of an ‘education at home’ effect which operates within a quite narrow age interval.
For these reasons, an indirect approach has been followed. In this approach, the age patterns of the immigration to and emigration from the Dutch East Indies are derived using the 1930 age structure alone. The method is based on three assumptions:
1. In 1930, the European population in the Dutch East Indies was approximately
stable. It is not very likely that the European population was truly stable, but
2. The European population of the Dutch East Indies in 1930 has been subject to mortality according to the estimated life table for Europeans in the Dutch East Indies around 1930. In the light of the gradual decline in mortality over time, this assumption holds by approximation only.
3. All irregularities in the stable population are the result of age-specific migration. This assumption is not completely acceptable, because for the European population in the Dutch East Indies also other components of age-specific population change were relevant, viz.: (a) recognition (an extramarital child is recognized by the father and as such obtains the status of European); (b) marriage surplus (a non-European woman obtains through her marriage to a non-European man the status of European); (c) formal assimilation (the government had the authority to grant the legal status of European to persons from other population categories, notably native Indonesians and Chinese). On the other hand, the gross migration flows (i.e. immigration and emigration counted separately) are numerically much more important than the aggregate of recognitions, marriage surplus, and formal assimilations.
0 1000 2000 3000 4000 5000 6000 7000 8000
0 10 20 30 40 50 60 70
age 1930
stock 1930 stable population
Figure 4: Observed and fictitious stable population, Europeans in the Dutch East Indies, 1930 (absolute numbers)
The immigration and emigration numbers constructed in this way exhibit a somewhat ragged age trajectory, obviously because the assumptions on which our method rests are only approximately valid. Nevertheless one can recognize a clear age pattern. Immigration takes place mostly between the ages 20 and 30 (start of the labour career). Emigration is mainly concentrated between the ages 10-15 (secondary school age) and 40-55 (retirement, or at least the ‘end of service in the tropics’). These age patterns are highly plausible.
The observed and fictitious age structures in figure 4 can also be used to estimate the size of the teenager gap. In the age range 10-20, about 14 thousand children are ‘missing’ in figure 4 (55 thousand in the stable population, 41 thousand in the observed population). This would imply that about 25 per cent of the European children of secondary-school age were residing in Europe (the Netherlands).
6. Age effect: children residing abroad
In the 1930 Dutch East Indies census, the questionnaire for Europeans contained the following question: ‘How many minor-aged children under your maintenance are residing outside the Dutch East Indies? a. boys, b. girls’. The results for this question (unfortunately, there is no corresponding question in the 1930 census in the Netherlands) give some direct insight into the size of the teenager gap, with one important restriction: the question can be answered only in case at least one parent or custodian is present in the Dutch East Indies; thus, the results do not include those students who are residing abroad together with their full family, e.g. because the father has been retired.
According to the 1930 Dutch East Indies census, 8 thousand minor-aged children residing abroad are maintained by Europeans residing in the Dutch East Indies (Census of 1930 in the Dutch East Indies, Part IV: 33-35). The census report suspects that this number is an overestimation, because the question has probably frequently been misinterpreted (e.g. many mature-aged students would erroneously have been counted as well). The ratio of boys to girls is virtually 50:50. As to the reasons for the absence of these children, the census report is crystal clear: ‘The lacking of a number of the children of this age range can largely be attributed to the Dutch Indies custom, to send children of secondary school and university age abroad, for the completion of their education, sometimes also for other reasons, in most cases to the Netherlands’ (p. 6; italics added).
The phenomenon ‘children outside the Dutch East Indies’ can be encountered, according to the census data, with about one in six of all family heads. In the previous section we gave as our estimated upper limit that 25 per cent of the European children is residing in Europe. In combination with the one in six result, this would imply that of the Dutch East Indies children in Europe, about 60 per cent is residing there without parents (i.e. the parents are in the Dutch East Indies) and about 40 per cent with parents (i.e. the parents have also migrated to Europe).
7. Dutch East Indies students in the Netherlands
Within the group of secondary school students, the share of those from the Dutch East Indies was naturally much larger: to wit, the Dutch East Indies children in the Netherlands almost by definition went to secondary schools, while this was certainly
not the case for the total Dutch population in 1930. A crude estimate indicates that the
participation rate in the more advanced types of secondary schools (5) in the Netherlands in 1930 was about 16 per cent, i.e. 24 thousand per birth cohort. Among these, the 1,500 Dutch East Indies students comprise 6 per cent, i.e. one or two students on average per classroom.
The participation in the more advanced types of secondary education among the Dutch East Indies Europeans cannot accurately be determined, but it was without doubt substantially above the 16 per cent for the total Dutch population. Although the estimated 25 per cent students abroad is an upper limit for the proportion that went to school in the Netherlands, we should not forget to add all those European children who went to school in the Dutch East Indies themselves. Especially after 1900, the school system in the Dutch East Indies expanded notably: ‘In 1880, the Dutch Indies already had three HBS institutions with a total of 378 students, by 1920 this number had increased to seven (government-owned) schools with a total of 2546 students. What was lacking in the Dutch Indies was a gymnasium [classical grammar school]’ (Mandemakers 1996: 198). Obviously, the high educational participation rate among the Indo-Dutch can be explained by the fact that the Dutch in the Dutch East Indies were a selective group, with a socio-economic status that greatly exceeded the average for the Netherlands as a whole.
All of the above estimates and calculations on the share of Dutch East Indies students in the Netherlands have been based exclusively on demographic data for the
Dutch East Indies. This yielded a proportion of Indo-Dutch among all students of at
most 6 per cent. In order to test for the likelihood of this number, one could also investigate the population in the Netherlands and find out the percentage originating from the Dutch East Indies. However, this is not as easy as it appears. Electronic datasets are hardly available for this time period. A manual search in the municipal population registers would be extremely time-consuming, particularly as a useful entry into these registers (e.g. ‘place of birth’) is lacking. And even if population register data, or individual data from the 1930 census, would have been available, it would still be extremely difficult to extract relevant information on the backgrounds of the migration to the Netherlands: what type of education was being attended, where were the parents, what type of housing conditions did one have, and so on.
including at the very least the place of birth. In order to get a sizeable number of Dutch East Indies students, it is advisable then to select a region with a large density of colonial personnel. The Hague is traditionally the city with by far the largest concentration of Indo-Dutch persons. In 1930 more than one-third of all Dutch people born in the Dutch East Indies lived in The Hague, and the share of the Dutch East Indies born was in The Hague no less than seven times the national average (cf. Table 1).
Table 1: Proportion of population born in one of the Colonies, 1899-1930
Total population of which born in one of the Colonies
percentage born in one of the Colonies Netherlands The Hague Netherlands The Hague Netherlands The Hague
1899 5,104,137 206,022 11,846 3,836 0.23% 1.86%
1909 5,858,175 271,280 15,031 5,191 0.26% 1.91%
1920 6,865,314 354,987 20,592 7,578 0.30% 2.13%
1930 7,935,556 437,665 32,616 12,244 0.41% 2.80%
Source: Censuses (the Netherlands).
The Municipal Archive of The Hague contains the archives of several schools in The Hague, of which some are useful for our purpose. All together, 3,717 cards with individual student information have been analysed. These data cover the period of approximately 1925-1939, and include four schools: one gymnasium, and three HBS schools (of which one for girls only).
24 per cent of all students is born outside the Netherlands, almost all of them in the Dutch East Indies. It was rather common that students from the Dutch East Indies (6) attended a school in the Netherlands for a short period only: the father has a year’s leave in the Netherlands, after which the family returns to the Dutch East Indies. If we weigh with school duration, the share of students born abroad falls to 20 per cent. If the factor ‘The Hague seven times the national average’ also applies to the age range of secondary school, this would imply that nationally about 3 per cent of the students in the advanced types of secondary education is originally from the Dutch East Indies. Since earlier we set 6 per cent as our ‘age effect only’ upper limit, the conclusion would have to be that the teenager gap in the Dutch East Indies is for about half due to an age effect and for the other half due to a cohort effect.
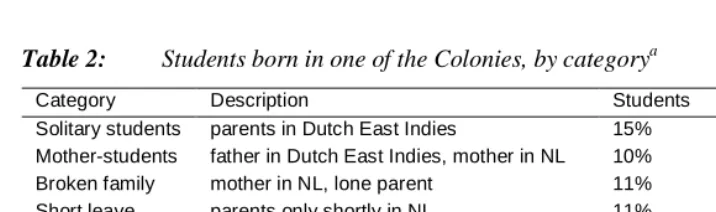
handwritten remark on the card). Broadly speaking, the following categories of ‘students from the Dutch East Indies’ can be distinguished:
• ‘Solitary students’: the parents resided in the Dutch East Indies, the student lived in the Netherlands. In most cases, the student lived with a relative, or with a private boarding house.
• ‘Mother students’: the father was working in the Dutch East Indies, the student had returned with his/her mother to the Netherlands. From the student cards, one gets the impression that in these cases the mother typically returned to the Netherlands
because the child went to secondary school.
• ‘Broken family’: the mother had returned with her children to the Netherlands, following a divorce or the death of the father. The distinction between
‘divorce/separation’ and ‘widowhood’ can quite frequently not be made on the basis of the student cards, which is why both categories have been combined into one. In either case, a compelling reason for mother and child to stay in the Dutch East Indies had ceased to hold.
• ‘Short leave’: the student came from the Dutch East Indies with his/her parents and returned after a short while (typically one year). This was especially common among civil servants. Because in the Dutch East Indies there were HBS schools but not a gymnasium, this category does not occur in the gymnasium sub-sample. • ‘Retired’: the father had retired from his job in the Dutch East Indies and had
returned with his family to the Netherlands. The retirement age in the Dutch East Indies was extremely low; in 1930, it was raised from 45 to 50 years (Van Doorn 2002: 23).
• ‘Other’: these are all other cases in which the student was in the Netherlands with his/her parents. Usually, the father had returned to the Netherlands for no ‘special’ reason, e.g. a change of job.
Table 2 summarizes the distribution of the Indo-Dutch students over these
distributions in the figures 1 and 4 suggest that from ages 40-50 onward, the numbers of European adults in the Dutch East Indies start to decline quite strongly. In this sense, the departure of the secondary-school aged children from the Dutch East Indies was certainly not always induced by the desire to continue the education in the Netherlands, but rather by the desire of the parents to return to the Netherlands.
Table 2: Students born in one of the Colonies, by categorya
Category Description Students Length of stay
Solitary students parents in Dutch East Indies 15% 15%
Mother-students father in Dutch East Indies, mother in NL 10% 9%
Broken family mother in NL, lone parent 11% 13%
Short leave parents only shortly in NL 11% 5%
Retired parents in NL, retired 28% 30%
Other parents in NL, other 25% 28%
N = 100% 907
students
2518 person years
a In the column ‘students’, each student has been counted with equal weight. In the column ‘length of stay’, each student has
been weighed with the number of years of attending the school. Since students with ‘short leave’ typically spent one year in the Netherlands only, their share in the column ‘length of stay’ is less than in the column ‘students’.
Source: The Hague Municipal Archive: student cards at four The Hague schools, ca. 1925-1939
The low percentage of students with one or both parents in the Dutch East Indies sheds a different light on the number of Europeans who in the 1930 (Dutch East Indies) census reported to have ‘minor-aged children under their maintenance outside the Dutch East Indies’. To recall (section 6), this concerned 8,000 children and one in six family heads. However, these numbers appear to be at odds with the combination of the The Hague student sample and the size of the ‘teenager gap’ in the Dutch East Indies census:
• The student gap in the Dutch East Indies was approximately 25 per cent per birth cohort, in total about 14,000 children.
• The The Hague sample data suggest that the student gap is for half due to a cohort effect (the missing children have never been born) and for half due to an age effect (the children were there, but not in the Dutch East Indies). The student gap is then 12 per cent per birth cohort, in total about 7,000 children.
• The The Hague sample data suggest that in only 30 per cent of the cases in which a student was residing in the Netherlands, at least one parent had stayed behind in the Dutch East Indies. The number of missing students for whom a parent in the Dutch East Indies could answer the census question, then amounts to just 2,100,
heads is harder to ascertain, because multiple children from one family could be missing. However, by all standards the ‘one in six’ proportion from the direct census question is much higher than can be reconciled with the The Hague sample data.
There are numerous possible explanations for the difference between the 8,000 from the 1930 census and the 2,100 from the combination of other sources. Perhaps (although not very likely) European children went in substantial numbers to other countries, not the Netherlands. Perhaps the popularity of The Hague for secondary-school aged children was less than seven times the national average. Maybe the four schools in the sample are not sufficiently representative, even not for the city of The Hague. And another possibility is that several Indo-Dutch adults, being a non-biological parent, reported to have a minor-aged child under their maintenance. However, lacking additional information, we can only largely guess at the causes of this difference.
8. Conclusions
The population census held in the former Dutch East Indies (currently Indonesia) in 1930 shows for the European population a striking shortage in the age range between 10 and 20 years, i.e. the age category of secondary school attendance. This paper has discussed the possible causes of this constriction in the age structure.
First, we investigated whether the constriction can be due to a cohort effect. Were the numbers of births in the Dutch East Indies during the period 1910-1920 substantially lower than those in the period 1920-1930? It was concluded that the available time series are such that this effect is very difficult to determine. Presumably, a cohort effect exists, but the extent to which it can explain the student shortage is unclear.
yielded a number of just 8,000 students, but the reliability of this figure is not fully clear.
If the number of 14 thousand students outside the Dutch East Indies were correct, it would imply that among the population in the Netherlands of students in the advanced types of secondary education around 6 per cent would be of Dutch East Indies origin. Using archives of four schools in the city of The Hague, we have checked whether this implication bears some correspondence to reality. This investigation yielded two main conclusions:
1. The proportion of students born in the Dutch East Indies is more likely to have been around 3 per cent than around 6 per cent. This indicates that the teenager gap in the Dutch East Indies was for about half due to a cohort effect and for the other half due to an age effect.
2. Among the students missing from the Dutch East Indies, those residing solitarily in the Netherlands constituted only a small minority. By far the majority of the Indo-Dutch students living in the Netherlands was missing in the Indo-Dutch East Indies because the complete family had migrated to the Netherlands, either because of retirement or for other reasons. This appears to be at variance with the large number of 8,000 students from the direct question in the 1930 census. However, without additional research the ‘why’ of this discrepancy can hardly be answered.
Thus, although the true number of Dutch East Indies born students can be established by approximation only, it can safely be concluded that the Indo-Dutch secondary school student in the Netherlands between the two World Wars was far from being exceptional. This holds in particular for the city of The Hague. From the available research data, we obtain the image of a numerous, and socially and economically privileged group, that in many respects left its marks in the governmental city. The pioneering spirit of the Dutch East Indies migrants is exemplified by various characteristics, including the very high participation in advanced types of secondary education, and the fact that this participation prevailed among boys and girls in equal measure.
Notes
1. The Dutch West Indies, in contrast, comprise Surinam and the Dutch Antilles.
2. Such a demographic reconstruction has recently been undertaken by NIDI, at the request of the Dutch government, in order to estimate the number of people eligible for a financial compensation to the Indo-Dutch community. This financial gesture was originally launched because of ‘presumed deficiencies in the restoration of rights after the Second World War’, and to compensate for ‘the policies of previous Dutch governments which were very indifferent, bureaucratic and formalistic’ (see www.gebaar.nl). For the demographic reconstruction, see Van Imhoff and Beets (2004).
3. The Dutch United East Indies Company (‘Verenigde Oostindische Compagnie’ or VOC) was founded in 1602, as the first company in world history with tradable shares. It marked the start of the worldwide orientation of the Netherlands, and of a period of strong economic and cultural growth. For the Indian Archipelago, however, it signified the start of more than three centuries of suppression and exploitation.
4. The migration statistics between the Dutch East Indies and the Netherlands are thought to be very accurate since they are based on migration data to and from the Dutch population registers (source: Statistics Netherlands).
5. This estimate is based on student numbers by type of school in 1930 (source: Statistics Netherlands) and an assumed average duration per type of school. As ‘advanced’ types have been counted: ‘ULO’, ‘Handelsdagschool’, ‘HBS’, ‘MMS’, ‘Gymnasium’. This notably excludes the various types of basic vocational education.
References
Census of 1930 in the Dutch East Indies (1933). Deel VI, Europeanen in Nederlandsch-Indië. Batavia: Departement van Landbouw, Nijverheid en Handel. [‘Europeans in the Dutch East Indies’, in Dutch].
Colonial and Dutch East Indies Report (several volumes). Batavia: Algemene Landsdrukkerij.
Gooszen, A.J. (1994). Een demografisch mozaïek, Indonesië 1880-1942. Doctoral dissertation, Wageningen University. [ ‘A demographic mosaic, Indonesia 1880-1942’, in Dutch].
Mandemakers, C.A. (1996). Gymnasiaal en middelbaar onderwijs: ontwikkeling,
structuur, sociale achtergrond en schoolprestaties, Nederland, ca. 1800-1968.
Doctoral dissertation, Erasmus University Rotterdam. [‘Secondary education: development, structure, social background and school achievements, Netherlands, ca. 1800-1968’, in Dutch].
Nieuwenhuys, R. (1982). Komen en blijven: tempo-doeloe – een verzonken wereld:
fotografische documenten uit het oude Indië, 1870-1920. Amsterdam: Querido.
[‘Photographic documents from the old Dutch Indies, 1870-1920’, in Dutch].
Taylor, Jean G. (1983). The social world of Batavia: European and Eurasian in Dutch
Asia. Madison: University of Wisconsin Press.
Van Doorn, M. (2002). Het leven gaat er een lichten gang. Den Haag in de jaren
1919-1940. Zwolle: Waanders Uitgevers. [‘The Hague during the period 1919-1940’,
in Dutch].
Van Imhoff, E., Beets, G. (2004). A demographic history of the Indo-Dutch population, 1930-2001. Journal of Population Research, 21(1): 47-72.