in the population sciences published by the Max Planck Institute for Demographic Research
Konrad-Zuse Str. 1, D-18057 Rostock·GERMANY
www.demographic-research.org
DEMOGRAPHIC RESEARCH
VOLUME 17, ARTICLE 9, PAGES 211-246
PUBLISHED 13 OCTOBER 2007
http://www.demographic-research.org/Volumes/Vol17/9/ DOI: 10.4054/DemRes.2007.17.9
Research Article
Effects of current education on second- and
third-birth rates among Norwegian women and
men born in 1964:
Substantive interpretations and methodological
issues
Øystein Kravdal
c
°2007 Øystein Kravdal
1 Introduction 212
2 Mechanisms that may link education and fertility in contemporary Norway 215
2.1 The causal effect of enrolment 215
2.2 The causal effect of educational attainments 216
2.3 The reverse causality 219
2.4 Confounding factors 219
2.5 The possible link between attainment and goals 220
3 Data 221
4 Hazard regression analysis 222
4.1 The motivation for the simultaneous-equation approach 222
4.2 Detailed specification of the model 223
5 Results 225
5.1 Introductory description 225
5.2 Hazard regression results 226
6 Discussion and conclusion 235
6.1 Interpreting the positive education effects among women and men 235
6.2 Comparison of models 237
6.3 The bottom line 239
7 Acknowledgements 240
Effects of current education on second- and third-birth rates
among Norwegian women and men born in 1964:
Substantive interpretations and methodological issues
Øystein Kravdal1
Abstract
A variety of approaches have been employed to assess the importance of womenŠs educa-tion for their second- or third-birth rates. Some researchers have included the educaeduca-tional level measured at a relatively high age in their models, whereas others have included cur-rent education. A few have taken selection into account by modelling first-, second-, and higher-order birth rates jointly, with a common unobserved factor. The corresponding education-fertility relationships among men, however, has not attracted any attention. In this study, based on Norwegian register data for the 1964 cohort, a high current educa-tional level for a woman is found to stimulate her second- and third-birth rates. Con-trolling for selection through joint modelling turns out to be quite unimportant, but the results are very different if the educational level attained by age 39 is included instead of current education. It is important to be aware of such sensitivity to the specification of education. The corresponding effects for men are also positive, but not more strongly positive than those for women. These results may suggest that we should not take for granted that womenŠs education generally reduces fertility, and that it does so because of higher opportunity costs for the better educated. However, it is also possible that a high current educational level is linked with modest aspirations for further schooling, which would tend to stimulate subsequent fertility, that it is partly caused by some individual, family or community characteristics that also lead to high fertility, or that it even to some extent is a result of plans to have a child fairly soon. These alternative interpretations are discussed.
1. Introduction
Much of the research on the education-fertility relationship has focused on the total num-ber of children per woman and the transition to motherhood (United Nations 2004). In addition, some investigations, largely from developed countries, have addressed the ed-ucational (and other) differentials in the progression from first to second or from second to third child2. This interest in the reproduction after the first birth has been stimulated by the access to more detailed survey and register data, as well as the concern about below-replacement fertility, which to a large extent is a result of “too few” second and third births. However, much remains to be known about how education affects parents’ inclination to have more children.
The better educated tend to have their first child at a higher age than the less edu-cated (e.g. Rindfuss et al. 1988), which also reduces their chance of having yet another child, because of the shorter exposure time for further childbearing, and because remain-ing childless up to an older age may stimulate interests that compete with the parental role (e.g. Morgan and Rindfuss 1999). In statistical models for second-birth rates, one typically includes a control for the current age of the first child and the current age of the mother (or her age when the first child was born) to see whether there is an effect of educa-tion on second births beyond the effect of later entry into motherhood. Similarly, the age of the second child and the age of the mother (at second birth) are included in third-birth models. Effects of education are often positive in such models (e.g. Hoem and Hoem 1989; Kreyenfeld and Zabel 2005; Köppen 2006), which apparently challenges common ideas about better-educated women having the highest opportunity costs of childbearing and therefore the lowest fertility. Either such opportunity cost differentials do not exist (any more) or the opportunity cost effect is outweighed by various contributions in the opposite direction.
However, the statistical models that have been used to analyse second or higher-order births may produce a wrong impression about the importance of education. One potential problem is that there are educational differentials in the selection of women who, at a given age, have already had their first (second) child and therefore are exposed to the chance of having a second (third) child. If we, for example, compare among one-child mothers of age 27 with a 2-year old child, the sub-group with high education must have had a high score on certain unobserved fertility-stimulating factors compared to what is usual in this educational category, in which the average age at first birth is much higher. If we compare at a higher age, the better educated have a score closer to the average, while the less educated will tend to have a low score. This “advantage” of the better-educated sub-group may affect also the subsequent childbearing, so that, for example,
2In recent years, some attention has also been devoted to the field of education and not only the level
a positive effect of education is estimated in a model for the second-birth rate even if there is actually no influence of education specifically at this stage of the reproduction. In other words, we do not get a clean picture of how education affects the parity transition in focus, but mix in the educational differentials in the timing and quantum of the earlier transition(s). To solve this problem, a few researchers have estimated models for first-, second-, and third-birth rates simultaneously, with a common unobserved factor (defined to be drawn at random at the start of the reproductive period, using the same distribution for everyone regardless of educational attainment). In such studies, effects of education on second- and third-birth rates have tended to be less positive than in the separate models, and in some cases the sign has even flipped to a negative one (Kravdal 2001; Kreyenfeld 2002).
Another problem is that several studies of second and third births (e.g. Kravdal 2001; Kreyenfeld 2002), or fertility more generally (e.g. Martin 2000), have considered educa-tion at an age when reproduceduca-tion is largely completed. The estimates from such models are confounded by reverse causality: childbearing may have affected a woman’s interest in and opportunities for taking further education. Whereas lack of attention to selection produces an education effect that is more positive than the true causal effect, as explained above, the use of education at a high age pushes the estimates in the opposite direction (Hoem and Kreyenfeld 2006; Kravdal 2004). One obvious way to handle the problem of reverse causality is to include a measure of current educational attainment (perhaps along with enrolment) in the models, though that also has its limitations, as discussed below. Such an approach requires that the researcher has access to detailed education biographies, which is often not the case. Imputation of an education history on the basis of the level finally achieved, as done for example by Köppen (2006), can give misleading results (Kravdal 2004). Unfortunately, authors who have had access to the necessary data and entered current educational level and enrolment into their models for second or third births (e.g. Hoem and Hoem 1989; Kreyenfeld and Zabel 2005) have not combined this with the simultaneous modelling of first and higher-order births to also take selection into account. The only exception is the study by Hoem et al. (2001). That study was not based on a joint-model approach, but the use of “relative age at previous birth” as a control vari-able probably solves the selection problem to some extent (see note 10 below). When this variable was included, the positive effect of education on the third-birth rate vanished.
some researchers have based their analysis of demographic education effects on a natural-experiment situation (e.g. Skirbekk et al. 2004; Arendt 2005), while others have modelled educational and various demographic transitions simultaneously, with correlated unob-served factors (Upchurch et al. 2002). Such approaches have not been tried yet in studies of second or higher-order births, though.
To summarize, several estimates of how a woman’s education affects her childbearing beyond the first child have been published, but there are good reasons to question these estimates. It would obviously be valuable to see results from a more appropriate statis-tical approach. In addition, it would be interesting to compare a set of good estimates for women with corresponding estimates for men. More positive or less negative effects for men might suggest that the opportunity cost argument, which typically does not ap-ply to them, still has some relevance for women, although there are also other possible explanations. Unfortunately, our knowledge of the determinants of men’s birth rates is very modest. There seems to have been a general lack of interest in analysing fertility from a male perspective, and data have also been scarce (Coleman 2000; Greene and Bid-dlecom 2000; Goldscheider and Kaufman 1996; Forste 2002). The very few studies of the link between education and men’s fertility have focused on first births (Liefbroer and Corijn 1999; Winkler-Dworak and Toulemon 2007; Dribe and Stanfors 2006). No one has addressed the importance of education for fathers’ chances of having more children.
In this study, hazard models for first-, second- and third-birth rates are estimated si-multaneously, for men as well as women, and current educational level and enrolment are included. This has not been done earlier, although the study of women’s third births by Hoem et al. (2001) perhaps comes close. When such an approach is used, one does not run up against the reverse causality problem that is so obvious when final educa-tional attainment is used. Besides, the selection into the exposure for higher-order births is controlled for. One goal is to see whether the effects for women differ substantially from those reported in earlier investigations, based on other approaches. Another goal is to compare the effects for women with those for men, for whom education effects on second- and third-birth rates have not been estimated with any type of model, and to dis-cuss how the effects for the two sexes can be explained. However, also the use of current education introduces certain problems, which are discussed as well. In addition, since so little is known about men’s fertility, the paper includes a brief and simple description of educational differentials in completed fertility and parity progression ratios for both sexes, as a backdrop for the presentation of hazard model estimates.
The estimates are, of course, not necessarily representative of the situation in other countries. Education effects depend on a number of factors that vary across countries.
2. Mechanisms that may link education and fertility in
contemporary Norway
Several aspects of education may be important for fertility. Obviously, being enrolled in school, and having plans to continue schooling in order to attain certain educational goals, may have an impact. In addition, credentials are important in obtaining jobs that are interesting, flexible and high paying. Further, one may be influenced by the way of thinking one is exposed to by being in an academic environment, as well as the general or job-specific skills that are taught.
2.1 The causal effect of enrolment
Starting with the first of these components, female students may want to postpone (fur-ther) childbearing for several reasons. First, a child needs to be cared for. Unless child care can be purchased at a reasonable price, the mother may have to leave school, at least for a while, and may not be able to complete her education. That may have serious con-sequences for later occupational achievements and incomes. Second, childbearing entails short-term expenses that may be difficult for students to meet. Depending on the part-ner’s situation, the mother may have to work to cover both childcare and other costs, with similar implications for educational achievements and long-term incomes. Alternatively, she can continue in school and finance childbearing by taking up more loans or making relatively large cuts in the consumption. However, it may be seen as an advantage to de-lay childbearing until the family income is higher so this can be avoided (i.e. synchronize childbearing costs with the income). A decline in purchasing power resulting from child expenses will matter less at higher incomes, and borrowing may be costly (Happel et al., 1984). A third issue is that there may be norms against childbearing while being a student, as suggested by for example Blossfeld and Huinink (1991).
2.2 The causal effect of educational attainments
Income and childbearing cost. It is a cornerstone of economic-demographic theory that, given childbearing costs, a high income increases fertility desires. However, as the in-come increases, it is likely that childbearing costsdochange, because richer people may want to spend more on each child. Therefore, it is possible, but far from obvious, that a high income contributes to high fertility (e.g. Becker 1991). Further, since people with higher levels of education tend to have jobs with higher wages because of their skills and knowledge, as well as the credentials themselves, it is possible that better-educated men have generally high fertility, except during school enrolment.
The effect of the higher wage potentials among better-educated women is even harder to predict. On the one hand, a larger contribution to the family income may increase fertility, as just pointed out (the “income effect”). On the other hand, women with a high wage potential have also more to lose economically per time-unit out of the labour force to care for a child (in terms of immediate incomes and perhaps the long-term ones). This opportunity cost effect is usually thought to dominate.
As non-family high-quality childcare becomes more available and acceptable, as in Norway3, the depressing effect of women’s education through opportunity costs becomes smaller (Ermisch 1989). To see the argument, assume that a mother can return to work, say, one year earlier by using child care than she otherwise would have been able to do4. This would reduce her opportunity costs, and the reduction would be particularly large if she has a high education and thus high wage. In principle, this advantage for the better educated may be set off against the higher child care costs that those with high incomes may have to or want to pay, but these differences in child care costs over a one-year period are typically much lower than the differences in annual incomes5.
It should also be noted that the better educated often have jobs with some flexibil-ity regarding when during the day and week the job needs to be done, and flexibilflexibil-ity in bringing some of the work home to perform when the children are sleeping or otherwise occupied (e.g. Swanberg et al. 2005). Such aspects of the jobs of the better educated
3For example, 80% of Norwegian children aged 1-5 were enrolled in a day care centre in 2006 (Statistics
Norway 2007a).
4Also other factors facilitate mothers’ return to paid work. For example, parents have a right to stay home
with sick children 20-30 days per year, and the mother is entitled to a two-hour break each day to breast-feed. Further, parental leave has been steadily expanded. It is currently 48 weeks with full wage compen-sation (for further details see Rønsen 2004).
5The day care centres may be private or public, but both types are heavily subsidized, and the price varies
can also reduce the depressing effect of women’s education through opportunity costs by facilitating an earlier return to the labour market.
Contraception, norms and preferences. Knowledge acquired in school might affect fer-tility also through other channels than those mentioned above. For example, it is possi-ble that there is an educational gradient in the knowledge of contraception even in post-demographic transition societies. It is also possible that the better educated have other attitudes to risk-taking and therefore are more careful to use contraception. If inadequate contraceptive use is not completely compensated for by abortion, such differentials would affect both the timing and quantum of fertility. Social differentials in unplanned pregnan-cies or unmet need for contraception have indeed been reported from some countries (e.g.. Henshaw 1998; Kost et al. 1995; Klijzing 2000), and in a recent analysis of Norwegian adults who did not want more children, Træen et al. (2002) found a relatively poor use of contraception among the small group with only compulsory education.
Moreover, education promotes the ability to think for oneself and critically examine arguments put forth by others. To the extent that there is or was a normative pressure to have two children, as suggested by Blake (1968), the better educated may question or resist such pressure more than others. In fact, some have argued that more education leads people to take individual decisions with respect to family behaviour, rather than being driven by, for example, religiously based traditions (e.g. Lesthaeghe and Surkyn 1988).
Finally, it is possible that education influences people’s childbearing preferences, given incomes, childbearing costs and norms. More specifically, it has been suggested in the literature on developing countries that schooling may contribute to opening peo-ple’s eyes to alternatives to childbearing, such as various leisure activities or a higher consumption (e.g Easterlin and Crimmins 1987). Some evidence from developed coun-tries supports the idea that education may weaken childbearing preferences, especially among women (Miller 1992), but by and large, we know so little about this that it should be considered an unsettled issue. Indeed, the opposite effect also seems plausible. Having children typically increases the amount of housework that needs to be done, and even if a child is in full-time day care, there is much care that still needs to be provided by the parents. Some studies have shown that better-educated women and men share housework more equally with their partners than the less educated (e.g. Kitterød 2002; Bianchi et al. 2000)6. This may possibly increase at least the women’s interest in having (more) children, though the existing evidence for a fertility effect is rather blurred (e.g. Torr and
6The lesser amount of household work among better-educated women may be a result of modern attitudes
Short 2004; Olah 2003).
Finding a partner. At any age, the chance that the person has a child depends in part on whether he or she is in a relationship at that time, which in turn is influenced by edu-cation. The type of the relationship is also important. Although it is very common for cohabitants in Norway to have children (Kravdal 1997; Statistics Norway 2007c), fertility is still higher among the married. However, the direction of causality is ambiguous, as childbearing (plans) may also affect the partnership status.
A classic economic argument with respect to marriage formation and extended more generally to partnership formation is that specialization constitutes an important compo-nent of the value of a relationship, so that the couple having the most to benefit from forming a relationship would be a man with high wage potential and a woman with lower wage potential, all else similar (e.g. Becker 1991). This would advantage men with higher levels of education. Similarly, women with the highest level of education may be less likely to ever enter a partnership that produces a child. On the other hand, education does not only affect people’s wages. There are also other characteristics associated with education, such as being an interesting discussion partner or a good problem-solver, and these may increase both a woman’s and a man’s attractiveness as a marriage partner.
The argument related to wages may be less relevant these days than when it was first launched, given that family instability has made specialization more risky, and many of the services traditionally produced in the home are less time-consuming or can be purchased. For example, Oppenheimer (1994) has argued that it is a pooling of resources that now produces the economic benefits from living in a union, rather than specialization, so that men prefer wives with a high wage potential, just as women prefer rich husbands. The implication of this would be that better-educated women are the most prone to marry or form a partnership, once their lower marriage rates during enrolment are taken into account.
To summarize, while all arguments suggest that men with the lowest level of education are least likely to form a partnership, it is less obvious what one should expect for women. Possibly, there has been a development away from the specialization strategy, so that effects of women’s education have become less negative or perhaps even positive over the last few decades.
the corresponding net effects of a man’s education are less negative or more positive than indicated by a corresponding male-oriented model.
Summary. To conclude, there are several reasons why educational attainment may af-fect fertility, though their relevance may vary somewhat across parity. Some mechanisms contribute to push the birth rate up, others to depress it. On the whole, it seems likely that the positive contributions count more heavily for men than for women.
2.3 The reverse causality
As mentioned above, the effect of enrolment hinges partly on young people’s assumptions about childbearing making further schooling difficult (especially for the mother). This as-sumption is, of course, well rooted in reality. Some women do drop out of school because they have a child, an issue that has received considerable attention in the U.S. (Geron-imus and Korenman 1993; Hoffman et al. 1993; Hofferth et al. 2001). Conversely, others may have taken more schooling than originally intended because it turned out that they never became parents or had the second child that they wished. A relationship between education measured at a certain age and fertility up to that age does not only reflect the impactof educationonfertility, but also this reverse effectofchildbearingonsubsequent education.
The education may also be influenced by plans about childbearing. In particular, young women who want to have many children may see less need to invest in education, depending on their ideas about how difficult it is to combine work and motherhood. An-other mechanism may be that students who want to have a child may work very eagerly to complete their education before the child is born, assuming that it may be more difficult afterwards.
2.4 Confounding factors
spu-rious relationship between education and fertility. For example, people who have grown up in a city may have been strongly exposed to an urban life style characterized by pref-erences for activities that compete with parental responsibilities. Further, a strong interest in prestigious jobs or expensive leisure activities may be linked with a modest interest in spending time with children. On the other hand, having rich parents or being energetic may well contributepositivelyto fertility.
Presumably, such individual, family and community characteristics do not only influ-ence the educational level finally attained, but also the age at which this level is attained. As an illustration, let us consider people who eventually take a Master’s degree. At the age of, for example, 26 some may already have taken their degree, while others may have no more than a high school education, but want to return to school later. The latter have perhaps a lower score on some of the determinants of high education that were mentioned above, or other types of factors with a special importance for the timing of education may be involved. One possibility is that temporary health problems or other stressors may have led some people to take a break in their educational careers without having much impact on the final level achieved. Besides, some people may be more interested than others in combining education with gainful work in order to have a higher consumption while they are young, at the expense of fewer years with high income after the education is completed. Such factors may possibly also influence fertility.
To summarize, the relationship between fertility and having a high level of final edu-cational attainment is partly a result of certain characteristics affecting both the inclination to ever take a high education and the reproductive behaviour. These confounding factors can push the education-fertility relationship in either direction. Also the relationship be-tween fertility and having a high education at a relatively low age may reflect factors affecting the chance of ever taking a high education. In addition, it may be shaped by factors with a special importance for the chance of taking the high education early, given that it is taken at all.
2.5 The possible link between attainment and goals
re-main in school for a long time, while the better educated perhaps only take some shorter courses to make themselves even more qualified, and are less eager to continue.
3. Data
The data are taken from various Norwegian registers that cover the entire country and that are linked together by means of a personal identification number. Because the educational histories are only complete from 1980, when those born before 1964 already could have taken some education beyond the compulsory level, only the 1964 cohort is included in the analysis. When those who were born outside Norway were excluded, as well as those who did not live in Norway at age 39, the data included 30377 women and 32720 men.7 The analysis covers the years up through 2003, when the 1964 cohort reached age 39. (If younger cohorts had been included, the last years of their reproductive period would not have been observed.)
The birth histories, which include date of birth for each child for whom the person is registered as a parent, are essentially complete for the women, and there is very modest underreporting for men. (For less than 2% of the births in Norway during the relevant years, a father was not registered). In contrast, men tend to underreport the number of children they have had in retrospective fertility surveys, especially if they no longer co-reside with the child and have limited contact with him or her (e.g. Juby and Bourdais 1999).
The education module includes information about the educational level attained as of 1 October each year 1980-2003 and whether the person was enrolled in school at those dates. The educational level was coded according to the 2000 standard (Statistics Nor-way 2001), using five categories: i) only compulsory education (10 years of schooling), ii) lower-secondary education (11-12 years)8, iii) higher-secondary education (13 years), iv) some college or university education, up to and including the Bachelor level (14-17 years)9, and v) all college education taking 5 or more years, for example the Master’s
7In the models that included current educational level and enrolment instead of the education at age 39, one
could have include also the men and women not living in the country at age 39, but censored at the time of death or emigration. This was tried and gave the same results.
8It should be noted that the distinction between compulsory and lower-secondary education is somewhat
diffuse: Until the mid-1990s, those who set out to take a theoretical higher-secondary education were reckoned to have no more than compulsory education until they had graduated from high school. If they dropped out, they would remain registered with the compulsory level. Students on a vocational track, however, were registered as passing through a lower-secondary level. This means that some of those at the compulsory level actually have taken some secondary education, which may have added to their real qualifications.
9The “some college” category is a very broad one. Passing a one-semester course at a college may be all
degree (18 or more years). In addition, there is a small group of people (approximately 1%) with unknown education or compulsory school not completed. They were included as a separate category (estimates not shown).
The educational system in Norway is flexible, in the sense that students generally have good opportunities to change from one track to another, exit and return several times, and study part-time. As a result, many take degrees at fairly high ages. For example, 17% of the women who were born in 1964 and who were recorded with some college education by the time they were 39, had taken this education after age 30 (see further examples below). Many also spend more years as formally enrolled in school than would be strictly needed to reach the educational level under consideration (i.e. a high age at graduation is not only a result of interruptions). The person may have studied part-time or taken several courses at the same academic level that add to their real qualifications without leading to higher credentials. For example, among those who ever took the equivalent of a Master’s degree, 70% were recorded with more than the 8 years of schooling beyond the compulsory that are officially stipulated for this level (assuming that enrolment 1 October is a good indicator of full enrolment that school year). On the other hand, 12% were recorded withlessthan 8 years. While it is not impossible that they have actually managed to pass quicker through the system, it may also be an indication of some underreporting of enrolment. Another, and probably better, indication of underreporting may be that 18% reached a higher-secondary level with less than 3 years of enrolment. At this stage, it is difficult to cut corners. Anyway, there is probably much less misreporting of school enrolment in these register data than when people are asked in surveys to report their educational histories, and no attempt has been made to correct the data.
4. Hazard regression analysis
4.1 The motivation for the simultaneous-equation approach
A common approach has been to estimate separate models for second and third births and, of course, include duration since last previous birth and either current age of the mother or her age at last birth, along with education, to see whether there is an effect of educa-tion beyond that stemming from a late entry into parenthood among the better educated.
However, it is better to estimate models for first, second and third births simultaneously, with a common unobserved factor. The idea was briefly explained in the Introduction, but some elaboration may be needed. Note first that those with high education tend to have their first child later than those with low education, for a number of reasons discussed above. Assume further that their average ages at first birth are, say, 30 and 25 years, respectively. When a model is estimated separately for second births and includes age and duration since last previous birth, one essentially compares the second-birth rates of women with different educational level who have the same age, let us say 27 years, and whose first child have the same age, let us say 2 years. Those with high education in this group have had a much earlier first birth (25) than usual for their educational category (30). Therefore, they must have had a higher score on some fertility-promoting factors than what is usual for women in this educational category, while this is not the case for those with low education, who are more “on time”. For example, the sub-group of better-educated women with such an early birth have perhaps a fecundity (a factor that probably varies little by education) above average; perhaps they have relatively strong affinity to care roles; or perhaps they have certain interests and attitudes that lead them to take less well-paid jobs compared to those held by most others in their educational category. These characteristics may also tend to push their second- and higher-order birth rates up, and the intention behind the simultaneous-equation modelling is to get rid of that contribu-tion to arrive at a more reasonable measure of how educacontribu-tion affects these birth rates in particular10. A few recent studies have shown that this technique gives markedly differ-ent results, and for example can wipe out positive education effects appearing in models estimated separately for second or higher-order births (Kravdal 2001; Kreyenfeld 2002).
4.2 Detailed specification of the model
In this study, the individuals are followed from January the year they turned 18 until the end of the year they turned 39 (2003). The first-birth rate is assumed to depend on age.
10An alternative approach might have been to include age at previous birth compared to the average for that
Second- and third-birth rates are, in addition, assumed to depend on duration since the previous birth.11 Besides, there is a covariate vector X that includes education variables. In the first-birth equation, X also includes interactions between education and age.12 This is because several studies have shown that first-birth rates for women who end up with high education tend to be particularly low in the teens and low twenties, while they may be higher than those for the less educated at a later age (e.g. Kravdal 1994; Rindfuss et al 2007; Santow and Bracher 2001). Although this pattern may be partly a result of selection, there are also reasons to believe that other mechanisms are involved, so that the interactions should be included even in this model that takes account of selection.
More specifically, this is the model that is estimated:
logh(1)=β(1) 0 +β
(1)
1 A(1)(a, v1, v2, v3, v4, v5) +β (1)
3 X(1)+δ logh(2)=β(2)
0 +β (2)
1 A(2)(a, v10, v20, v03, v40) +β (2)
2 D(d, z1, z2, z3, z4) +β (2)
3 X(2)+δ logh(3)=β(3)
0 +β (3)
1 A(3)(a, v20, v30, v04) +β (3)
2 D(d, z1, z2, z3, z4) +β (3)
3 X(2)+δ
wherehis a birth rate and(1),(2) and(3)are symbols for first, second and third births,
respectively. In these equations,β0 is a constant, andA(1) is a piecewise linear spline
transformation of age, with nodesv1, v2, v3, v4 and v5 at the end of the years when the person turned 20, 23, 27, 32, and 37, respectively.13 β1 is the corresponding row vector of associations. AlsoA(2) andA(3), which are included for second and third
births, are age splines, with nodes at 20 (only for second births), 25, 30 and 35 years, andD is a duration spline with four nodes at 2, 4, 6 and 8 years. In the first set of models that is estimated,Xincludes the educational level at age 39. In the next step, that
11 All three variables “current age”, “duration since previous birth”, and “age at previous birth” are likely to
affect the birth rates, in addition to picking up certain background factors. However, only two of them can be included, and the education effects turned out to be insensitive to the choice.
12To illustrate how to interpret the parameters, let us consider for example a model where the unobserved
factorδis set to 0 and where X includes the education at age 39 and two interactions, one that is a product of education at age 39 and a dummy for age below 25 (called low-age interaction below) and one that is a product of education at age 39 and a dummy for age above 29 (called high-age interaction below). Assume further that the educational level is categorical with compulsory as the reference level. Estimates from a model of this type are shown in column 1 of Table 2. With such a specification, the first-birth rate for those with compulsory education is given by the constant term and the age pattern (a spline with five nodes; see definition below). For those with, for example, higher-secondary education, the first-birth rate is the same except that it is increased (on the log scale) by the main effect of education (which turns out to be -0.16) at age 25-29, and by the main effect of education plus the low-age interaction (-0.16 - 0.45) at ages below 25, and by the main effect of education plus the high-age interaction (-0.16 + 0.21) at ages above 29.
13More precisely, the spline is defined as a column vector whose transpose is At = (min[a, v1],max[0,min[a−v1, v2−v1]],max[0,min[a−v2, v3−v2]],max[0,min[a−v3, v4−
education variable is substituted by the educational level and enrolment in October in the year before the previous. This corresponds to a lag of 15-27 months, which should be appropriate given a 9-month pregnancy and a typical waiting time of about half a year between a first attempt to conceive and actual conception. A one year shorter lag gave very similar results, though. The third step is to combine the two education variables to better understand why their effects are different and, finally, a few potentially confounding factors are added. All models are estimated for women and men separately, using the aML software (Lillard and Panis, 2000).
δis an unobserved factor assumed to be drawn independently for each person at the start of the reproductive period and sticking to that person through age 39. Further, the distribution from which it is drawn is assumed to be normal, with zero mean and a stan-dard deviation to be estimated. This distribution is approximated by 10 support points, which is sufficient (20 points always gave the same results). For comparison, results from separate modelling of each parity transition are also shown. This corresponds to excluding
δ.
One might assume time-education interactions to be relevant also for second and third births (i.e. interactions between education and duration since last birth). One education group might, for example, end up with just as many second births as another group (same “quantum”), but have these births earlier or later (different “spacing”). Additional effects of education at durations below 3 years or after 6 years were included in some models, but there were no clear patterns in these interactions, and the education effects had the same sign at all durations. Therefore, these interactions were ignored in the final models.
5. Results
5.1 Introductory description
Completed fertility decreases with increasing educational level among women born in 1964 (Table 1). The small group (7%) with only compulsory education had 2.18 children at age 39, while the much larger groups with some (29%) or full (27%) high school education had 2.09 and 2.02 children, respectively. Those with up to 4 years of college education (32%) had 1.92 children, and the small group (5%) with the equivalent of a Master’s degree had 1.73. This is a result of both more childlessness and lower subsequent fertility among the better educated. The latter pattern appears most clearly in the third-birth progression ratios, and to a lesser extent in the second-third-birth progression ratios.
high fertility, the period total fertility rate has been in the 1.8-1.9 range since 1988 (Statis-tics Norway 2007d), which is far above the European Union average of approximately 1.4 (e.g. Sardon 2000).
A very different pattern appears for men. Completed fertility is somewhat higher
among those with college education (>1.7) than among those with lower-secondary or only compulsory education (1.6). Again, the pattern in the completed fertility accords with that seen in the childlessness as well as in the childbearing among parents, but as opposed to the situation for women, the positive gradient in the childbearing after the first child is especially pronounced for the second birth, rather than the third. This positive gradient is particularly noteworthy given that there is a positive relationship between edu-cation and age at first birth also among men, though not quite as sharp as among women.14
5.2 Hazard regression results
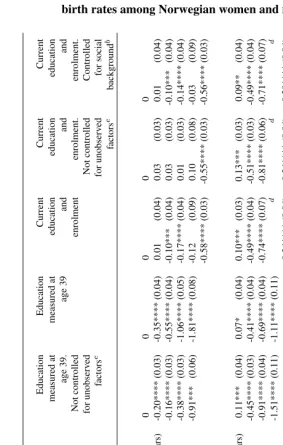
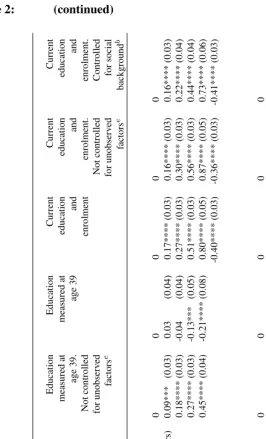
Effects of educational attainment at age 39. Among women, the educational attainment at age 39 is negatively associated with both the second- and third-birth rates, net of the higher age at first birth among the better educated. This is shown in the second column of Panel A in Table 2. In accordance with earlier findings, however, the education effects are significantlypositivewhen it is not controlled for selection by including a constant unobserved factor (first column of Panel A).
14The educational gradient in men’s completed fertility would have been even more positive if measurement
Table 1: Fertility measures at age 39 for women and men born in 1964, by educational level at age 39
Proportion Completed Proportion Completed Average Proportion in this fertility childless fertility age at first proceeding category (%) among birth among from parity (%) those not those not 1 to 2 2 to 3
childless childless (%) (%)
WOMEN
Educational level at age 39
Compulsory (10 years) 6.8 2.18 11.2 2.46 22.7 82.5 51.6 Lower-secondary (11-12 years) 28.9 2.09 12.0 2.38 24.0 83.7 47.5 Higher-secondary (13 years) 27.0 2.02 11.5 2.28 25.7 83.5 42.4 Some college (14-17 years) 31.6 1.92 15.4 2.27 27.5 83.3 43.1 Higher degree (18+ years) 5.3 1.73 20.4 2.18 30.0 80.4 38.9
Totala 2.00 13.5 2.32 25.8 83.3 44.6
MEN
Educational level at age 39
Compulsory (10 years) 8.7 1.60 26.2 2.17 26.5 75.7 40.6 Lower-secondary (11-12 years) 23.1 1.59 27.4 2.19 27.0 75.1 43.9 Higher-secondary (13 years) 35.4 1.76 20.5 2.22 27.7 80.3 40.7 Some college (14-17 years) 24.0 1.71 22.8 2.22 29.4 81.0 40.7 Higher degree (18+ years) 8.2 1.76 21.6 2.25 30.6 83.0 42.0
Totala 1.69 23.4 2.21 28.1 79.2 41.5
aIncludes about 1% with unknown or less than compulsory education.
As shown in the second column of panel B, the corresponding effect among men is strongly positive. This effect more than compensates for the fact that the better-educated men become fathers relatively late, so that a positive relationship between education and second-birth progression ratios appears (Table 1). For third births, these two components almost exactly offset each other, so that third-birth progression ratios vary little with ed-ucation. The control for unobserved factors turns out to be much less important for men than for women, probably because of the weaker link between education and first-birth rates among men (compare first and second column).
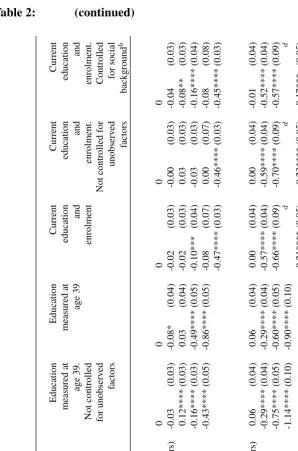
Table 2: Effects of various education variables on first-, second- and third-birth rates among Norwegian women and men born in 1964a
The change is in the same direction for men, but much less pronounced (third column of panel B). Enrolment has a depressing effect, as one would expect, but only for second births, and more for women than for men. (Leaving enrolment out changed the effects of the educational level very little; not shown).15
Note also that the control for selection is much less important when current education is included. For example, leaving out the unobserved factor only increases the effects of college education among women by 0.05-0.09 (4th column of Panel A). This may partly reflect that current educational level and enrolment pick up more of the variation than the educational level at age 3916, leaving a smaller standard deviation of the unobserved factor
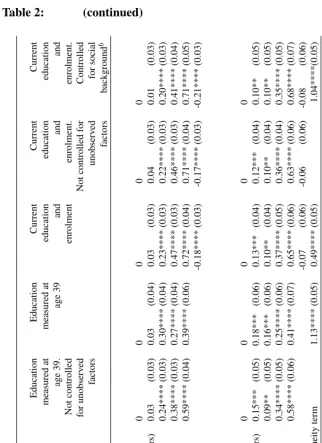
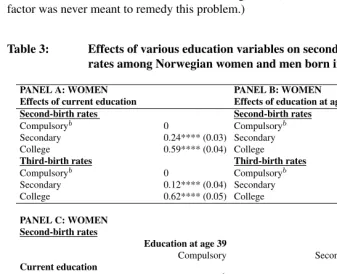
Effects of a combined education variable. To better understand the differences between the effects of current education and those of education at age 39, the next step is to in-troduce a combined variable but ignore enrolment (and still use the joint-model approach with a common unobserved factor). For simplicity, only three levels of education are defined: compulsory education, some or full high school education, and at least some college or university education. However, before presenting the effects of the combined education variable, let us first take a look at the effects that appear when only one of these three-level education variables are included: For women, the effect of current education is positive (Table 3, Panel A), while the effect of education at age 39 is weakly negative (Panel B). According to the model with a combined education variable, this pattern is linked to the very low birth rates among those who end up with a higher education than they currently have (off-diagonal elements in Panel C). Taking education at this stage is quite common. For example, 35% of those with compulsory education at the time of first birth had moved to a higher level by age 39, and 10% of those with some or full high school education had done so. Conversely, 23% of the mothers with at least some college education at age 39 were registered with only a secondary education at the time of first birth, while 14% of the college-educated women with two or more children were registered with only a secondary education at the time of theirsecondbirth (calculations by the author). In other words, the women under exposure for second and third births who currently have, for example, a compulsory education, are a varied group. Some may be quite satisfied with the level they have reached, while others may want to take more
15We get essentially the same effects of educational level if a combined enrolment-level variable is defined
and everyone who is enrolled, regardless of level, is included in the enrolled category.
16Part of the variation in fertility between individuals at the same level of final education may be a result of
education but never manage to do so. Yet another group actually attain a higher level, and their fertility is relatively low.
The corresponding effects of schooling after first birth among men are much less negative (off-diagonal elements in Panel D), which is the reason why effects of current education are more similar to those of education at age 39.
Control for some background factors. As explained earlier, certain characteristics of the family of origin may have had a bearing on both the educational careers of the young women and men and their fertility. This may influence both the estimated effects of cur-rent education and those of the education at age 39. (The inclusion of the unobserved factor was never meant to remedy this problem.)
Table 3: Effects of various education variables on second- and third-birth rates among Norwegian women and men born in 1964a
PANEL A: WOMEN PANEL B: WOMEN
Effects of current education Effects of education at age 39
Second-birth rates Second-birth rates
Compulsoryb 0 Compulsoryb 0
Secondary 0.24**** (0.03) Secondary 0.03 (0.04) College 0.59**** (0.04) College -0.15*** (0.05)
Third-birth rates Third-birth rates
Compulsoryb 0 Compulsoryb 0
Secondary 0.12**** (0.04) Secondary -0.10** (0.05) College 0.62**** (0.05) College -0.16*** (0.05)
PANEL C: WOMEN Second-birth rates
Education at age 39
Compulsory Secondary College
Current education
Compulsory 0b -0.32**** (0.06) -0.41**** (0.12)
Secondary 0.10*** (0.04) -0.50**** (0.06)
College 0.14*** (0.05)
Third-birth rates
Education at age 39
Compulsory Secondary College
Current education
Compulsory 0b -0.34*** (0.10) -0.81**** (0.19)
Secondary -0.07 (0.05) -0.69**** (0.08)
Table 3: (continued)
PANEL D: MEN Second-birth rates
Education at age 39
Compulsory Secondary College
Current education
Compulsory 0b 0.23**** (0.06) 0.03 (0.15)
Secondary 0.21**** (0.04) -0.17*** (0.06)
College 0.36**** (0.04)
Third-birth rates
Education at age 39
Compulsory Secondary College
Current education
Compulsory 0b 0.12 (0.10) 0.32 (0.24)
Secondary 0.18*** (0.05) -0.10 (0.10)
College 0.29**** (0.05)
aThese estimates are based on a joint modelling of first-, second- and third-birth rates. The specification is as
in the third column of Table 2, except that other education variables are used. Panel A shows estimates from a model that includes current education, Panel B shows estimates from a model that includes education at age 39, and Panels C and D show estimates from models including a combination of current education and education at age 39. Effects on first births are not shown. The models also included a dummy for unknown or less than compulsory education, age and (only second and third births) duration since previous birth. “Secondary education” means Lower- or Higher-secondary, and “College” means Some college or Higher degree.
bReference category
*p <0.10; **p <0.05; ***p <0.01; ****p <0.001
The corresponding effects of schooling after first birth among men are much less negative (off-diagonal elements in Panel D), which is the reason why effects of current education are more similar to those of education at age 39.
Control for some background factors. As explained earlier, certain characteristics of the family of origin may have had a bearing on both the educational careers of the young women and men and their fertility. This may influence both the estimated effects of cur-rent education and those of the education at age 39. (The inclusion of the unobserved factor was never meant to remedy this problem.)
interactions were tried for parents’ education, which turned out to be the most influential variable, but were not important for the estimates in focus.
Some of these variables exert significant effects on the birth rates. For example, a high education of parents depresses especially the first-birth rates (not shown). However, their inclusion has modest impact on the education effect estimates (fifth column of Panels A and B of Table 2).
6. Discussion and conclusion
6.1 Interpreting the positive education effects among women and men
For women born in 1964, there is a negative relationship between the educational attain-ment at age 39 and completed fertility beyond the first child. For men, the corresponding relationship is positive. However, in hazard regression models, where it is controlled for the later age at first birth among the better educated, negative effects are hardly visible for women, and when the focus is turned to current education, the effects are positive for both sexes. We cannot know whether these positive effects are a new phenomenon, since limitations of the education biographies make it impossible to estimate similar models for older cohorts, but it is worth noting that other types of measurements based on Norwegian register data indicate a movement towards less negative or more positive relationships be-tween education and fertility over the last couple of decades (Kravdal and Rindfuss 2007). No earlier study has provided so strong evidence of positive effects of current educa-tion on second- and third-birth rates. Hoem et al. (2001) are the only other investigators who have considered current education and taken selection into account, although with another approach that has never been compared with the one used here. They found no significant effects in their Austrian data. Other studies reporting positive effects of current education have ignored selection. However, to the extent that the results from the present analysis can be generalized, ignoring selection may not produce much of a bias after all.
These positive effects of current education in Norway may reflect that the knowledge, skills and attitudes resulting from education actually have a stimulating effect on fertility, as discussed immediately below. In addition, the effects may capture other mechanisms. These are dealt with later.
ed-ucation are more negative or less positive for women than for men. Alternatively, if the there still is a negative opportunity cost contribution, this must be offset by some factors that contribute in a particularly positive way for women.
One of the potentially positive contributions is the “income effect”. Assuming that the advantage of a higher purchasing power is not completely outbalanced by an inclination among the rich to spend more on each child, a high education may push fertility up by increasing the income. This argument is relevant for both sexes, but less so for women than for men if they stay long out of the labour market as a result of childbearing.
Another possibly positive contribution may come from the marriage and partnership pattern. Better-educated men in particular may have a larger chance than the less educated of being and remaining in a reasonably stable relationship that encourages childbearing. There may be such a positive effect also for women these days, though perhaps weaker than for men because women are typically still seen as less important wage earners.17 It should be noted, however, that inclusion of marital status in some additional models did not change the estimates much (not shown). Such modelling is problematic, of course, since many non-married are cohabitants, and since causality may also runfrom childbear-ingtomarriage, but the estimates provide at least a weak indication that the explanation must be sought elsewhere.
A related issue is positive assortative mating. In principle, part of the positive effect of women’s education may reflect that they have a better-educated partner, which stimulates fertility (Kreyenfeld 2002; Köppen 2006). Conversely, the education effect for men may reflect that a better-educated man tends to have a better-educated female partner. If a weak positive effect had been estimated for women and a strong positive effect had been estimated for men, one might suspect that the independent effect of women’s education was zero or even negative, while the effect of men’s education was even more strongly positive. However, when so similar positive effects show up for the two sexes, the effect among women can hardly be fully explained by this type of mechanisms. In support of that, the spouse’s education was included in additional models, and both the woman’s and her husband’s education turned out to have stimulating effects on second- and third-birth rates. Interestingly, those of the wife’s education were actually the strongest (not shown), again with the warning that such models are problematic.
With respect to the other factors that have been linked to education in the literature, any total contribution to fertility might be possible. To the extent that there is a difference in the efficiency of the contraceptive use, one would expect the better educated to be the most advanced users. The better educated are perhaps also the ones who feel most free not to abide by any two-child norm, should it still exist. However, their preferences for
17The proportion of women who had married by age 39 did not differ much across education in the 1964
childbearing (given norms, purchasing power and childbearing costs) are not necessarily particularly weak. They could just as well be relatively strong. Our knowledge about such issues is very limited.
Other explanations. One other reason for the observed positive effect of current education is that some of the women who currently have little education set out to reach a higher educational level, and actually manage to do so, and therefore also have particularly low birth rates. In addition, this group may show low fertility compared to those who currently have high education partly because the latter situation may be a signal of an intention to have a child soon (i.e. the educational transition is hastened in anticipation of subsequent childbearing). Besides, selection factors are perhaps involved. In principle, it is possible that those who take their higher education at a late age have another background than those who take it early, and that this also makes their birth rates lower.
However, the low birth rate among the women with low current education who pro-ceed to a higher educational level (and which makes the effects of education at age 39 less positive than those of current education, or even negative) is not the only explanation for the positive effect of current education: also those who remain at a low educational level show somewhat lower fertility than those at a currently high level. This is either a result of the causal effects mentioned above or two other mechanisms. First, it is always possible that a high current education signals certain individual, family or community re-sources that also may stimulate fertility.18 Some factors were controlled for in the models, but these are unlikely to have picked upallimportant background factors. Second, one may speculate whether also those whoremainat a relatively low level of education have considered taking more education some time later and expected that this would become more difficult if they had another child.
6.2 Comparison of models
The education-fertility relationship is easy to deal with in a setting where no one has ed-ucational goals beyond primary schooling and where that education is completed well before the start of the reproductive period, and if the data only provide information on
18To elaborate a little on this idea, consider for example 26-year old one-child mothers. Perhaps those who
the number of children ever born. In that case, one could simply compute a relationship between this measure of fertility and the educational level, and if it were not for the possi-bility that the social background or other factors might affect both education and fertility, one could interpret the relationship as a causal effect on fertility of knowledge, skills and attitudes developed at school.
However, the analysis gets much more complicated when there is a possibility of reverse causality, and if richer fertility data are available, allowing the researcher to assess parity-specific differentials. If one wants to find out how education is related to second- or higher-order birth rates, but remove the component stemming from the timing of the ear-lier transition(s), some sort of hazard model with an age variable included is an obvious option. However, which type of model should be chosen?
If the intention is to get as clean measure as possible of how education is related to the parity transition in focus, a simultaneous modelling of all transitions should make good sense. The estimates from such a model may differ markedly from those from a model estimated separately for the second- or higher-order birth rates, especially when it is the final educational achievement that is considered. When current education (and enrolment) are included instead, this control for selection appears to be of little importance. How-ever, one should be careful to generalize from that. Until a similar conclusion is reached in other empirical studies or substantiated by statistical-mathematical arguments, it would be a good strategy to always check whether simultaneous modelling gives different esti-mates.
Another question is whether one should include the educational level finally achieved or the current educational level (and enrolment)? The two may indeed differ, because it is quite common in many countries, including Norway, to take more education after first birth. In this study, the sign of the education effect was the same in these two specifica-tions as long as the models were estimated separately for second or third births, but in the simultaneous model approach, they were different.
and iv) the fact that they did not have a second child immediately after age 26 made it easier to continue schooling.
If we instead consider education and enrolment at age 26, the fourth type of expla-nation is not relevant, of course. A birth immediately after age 26 cannot influence the educational level at age 26. Surely, the education at that age is a result ofearlier child-bearing, but that is not a relevant issue here. What we essentially do in such a model where current education is included is that we compare the fertility immediately after age 26 among women with different educational levels at age 26 who have the same earlier childbearing history up to that age. However, there are other problems: The education at age 26 may be a result ofplansabout further childbearing, and in addition to picking up a causal effect of for example the knowledge developed at school, current education may be linked with educational goals. Those who have relatively little education at age 26 may consider the possibility of taking more education and therefore refrain from further childbearing (with the lowest fertility being seen among those who actuallydotake more education, of course).
Moreover, a problem that would hamper the analysis regardless of whether education at age 26 or education at age 39 is used, is that some factors inadequately captured by the included control variables may have a bearing on both education and fertility. When it is the current education (at low ages) that is considered, the factors promoting a quick speed through the educational system become relatively more important as potential con-founders. Should these factors be more strongly related to fertility than those affecting the chance ofevertaking high education - which we do not know much about - it would weaken the case for using current education in the analysis.
In a practical situation, it may be even more difficult to decide on a model specification than suggested above. This is because many researchers do not have data on educational histories, in which case the question is not whether to use current education or finally achieved education, but whether to use a measure of current education imputed from finally achieved education or the finally achieved education. As shown in Kravdal (2004), results may be quite sensitive to the assumptions made when imputing.
6.3 The bottom line
Norway than the negative ones, although it is also possible that the estimates reflect other mechanisms than the causal effects of educational level. Whether the situation is differ-ent in countries with less generous family policies and other gender ideologies is another issue.
The other main message is that the various models that seem most relevant to use may give widely different results, and that none of them gives an entirely clean picture of the causal effect of the educational level. The use of final education may seem particularly unsatisfactory because the estimates are contaminated by reverse causation, but the use of current education is not unproblematic either. That variable picks up a variety of factors, some of which may be different from those picked up by the final educational level. These differences between estimates, and the problems related to interpretation, should be taken into account when choosing an approach in original research, and when synthesizing results from earlier investigations.
7. Acknowledgements
References
Arendt, J. N. (2005). Does education cause better health? A panel data analysis using school reforms for identification.Economics of Education Review, 24:149–160. Becker, G. (1991).A Treatise on the Family.Enlarged edition. Harvard University Press:
Harvard.
Bianchi, S. M., Milkie, M. A., Sayer, L. C., and Robinson, J. P. (2000). Is anyone doing the housework? Trends in gender division of household labor. Social Forces, 79:191– 228.
Blake, J. (1968). Are babies consumer durables? Population Studies, 22:1–25.
Blossfeld, H.-P. and Huinink, J. (1991). Human capital investments or norms of role transition? How women’s schooling and career affect the process of family formation.
American Journal of Sociology, 97:143–168.
Coleman, D. (2000). Male fertility trends in industrial countries: Theories in search of some evidence. In Bledsoe, C., Lerner, S., and Guyer, J. I., editors,Fertility and the male life- cycle in the era of fertility decline, pages 29–60. Oxford: Oxford University Press.
Dribe, M. and Stanfors, M. (2006). Education, work and parenthood: The experience of young men and women in post-war sweden. Presented at PAA Los Angeles.
Easterlin, R. A. and Crimmins, E. M. (1987).The Fertility Revolution. A Supply-Demand Analysis. Chicago University Press:Chicago.
Ermisch, J. (1989). Purchased child care, optimal family size and mother’s employment.
Journal of Population Economics, 2:79–102.
Forste, R. (2002). Where are all the men? A conceptual analysis of the role of men in family formation. Journal of Family Issues, 23:579–600.
Geronimus, A. T. and Korenman, S. (1993). The socioeconomic costs of teenage child-bearing: Evidence and interpretation.Demography, 30:281–290.
Goldscheider, F. K. and Kaufman, G. (1996). Fertility and commitment: Bringing men back in. Population and Development Review, 22(S):87–99.
Greene, M. E. and Biddlecom, A. E. (2000). Absent and problematic men: Demographic accounts of male reproductive roles.Population and Development Review, 26:81–115. Happel, S. K., Hill, J. K., and Low, S. A. (1984). An economic analysis of the timing of
childbirth.Population Studies, 38:299–311.
Henshaw, S. (1998). Unintended pregnancy in the United States. Family Planning Per-spectives, 30:24–29.
Hoem, B. (1996). The social meaning of education for third-birth fertility: A method-ological note on the need to sometimes respecify an intermediate variable.Yearbook of Population Research in Finland, 33:333–339.
third births in modern Sweden.Population Studies, 43:47–67.
Hoem, J. M. and Kreyenfeldt, M. (2006). Anticipatory analysis and its alterna-tives in life-course research. Part I: The role of education in the study of first childbearing. Demographic Research, 15:461–484. online at www.demographic-research.org/Volumes/Vol15/16.
Hoem, J. M., Neyer, G., and Andersson, G. (2006). Educational attainment and ultimate fertility among Swedish women born in 1955-59.Demographic Research, 14:381–404. online at www.demographic-research.org/ Volumes/Vol14/16.
Hoem, J. M., Prskawetz, A., and Neyer, G. (2001). Autonomy or conservative adjust-ment? The effect of public policies and educational attainment on third births in Aus-tria, 1975-96.Population Studies, 55:249–261.
Hofferth, S. L., Reid, L., and Mott, F. L. (2001). The effects of early childbearing on schooling over time.Family Planning Perspectives, 33:259–267.
Hoffman, S. D., Foster, M., and Furstenberg, F. F. (1993). Re-evaluating the costs of teenage childbearing.Demography, 30:1–14.
Juby, H. and Bourdais (1999). Where have all the children gone? - Comparing mothers’ and fathers’ declarations in retrospective surveys. Canadian Studies in Population, 26:1–20.
Kitterød, R. H. (2002). Utdanning og ulikhet? En diskusjon av utdanningsnivåets betyd-ning for deling av husarbeidet blant småbarnsforeldre. Sosiologisk tidsskrift, 10:179– 208.
Klijzing, E. (2000). Are there unmet family planning needs in Europe? Family Planning Perspectives, 32:74–81.
Köppen, K. (2006). Second births in western Germany and France. Demographic Re-search, 14:295–330. online at www.demographic-research.org/ Volumes/Vol14/14. Kost, K. and Forrest, J. D. (1995). Intention status of U.S. births in 1988: Differences by
mothers’ socio-economic and demographic characteristics. Family Planning Perspec-tives, 27:11–17.
Kravdal, Ø. (1994). The importance of economic activity, economic potential and eco-nomic resources for the timing of first birth in Norway. Population Studies, 48:249– 267.
Kravdal, Ø. (1997). Wanting a child without a firm commitment to the partner: Interpre-tations and implications of a common behaviour pattern among Norwegian cohabitors.
European Journal of Population, 13:269–298.
Kravdal, Ø. (2001). The high fertility of college educated women in Norway: An artefact of the separate modelling of each parity transition.Demographic Research, 5:187–216. online at www.demographic-research.org/ Volumes/Vol5/6.
esti-mation methods? Demographic Research, 6:241–262. online at www.demographic-research.org/ Volumes/Vol6/9.
Kravdal, Ø. (2004). An illustration of the problems caused by incomplete educa-tion histories in fertility analysis. Demographic Research, S3:135–154. online at www.demographic-research.org/special/3/6.
Kravdal, Ø. and Rindfuss, R. R. (2007). Changing relationships between education and fertility - a study of women and men born 1940-64. Working Paper 2007-11. Depart-ment of Economics, University of Oslo.
Kreyenfeld, M. (2002). Time-squeeze, partner effect or self-selection? An investiga-tion into the positive effect of women’s educainvestiga-tion on second birth risks in West Ger-many. Demographic Research, 7:15–48. online at www.demographic-research.org/ Volumes/Vol7/2.
Kreyenfeld, M. and Zabel, C. (2005). Female education and the second child: Great Britain and Western Germany compared. Schmollers Jahrbuch - Zeitschrift für Wirtschafts- und Sozialwissenschaften, 125:145–156.
Lappegård, T. and Rønsen, M. (2005). The multifaceted impact of education on entry into motherhood.European Journal of Population, 21:31–49.
Lesthaeghe, R. and Surkyn, J. (1988). Cultural dynamics and economic theories of fertil-ity change.Population and Development Review, 14:1–45.
Liefbroer, A. C. and Corijn, M. (1999). Who, what, where, and when? Specifying the impact of educational attainment and labour force participation on family formation.
European Journal of Population, 15:45–75.
Lillard, L. and Panis, C. W. A. (2000). aML Multilevel Multiprocess Statistical Software. Release 1.0. EconWare, Los Angeles, California.
Martin, S. P. (2000). Diverging fertility among U.S. women who delay childbearing past age 30. Demography, 37:523–533.
Martin-Garcia, T. and Baizan, P. (2006). The impact of the type of education and of educational enrolment on first births. European Sociological Review, 22:259–275. Miller, W. B. (1992). Personality traits and developmental experiences as antecedenst of
childbearing motivations.Demography, 29:265–285.
Morgan, S. P. and Rindfuss, R. R. (1999). Reexamining the link of early childbearing to marriage and to subsequent fertility. Demography, 36:59–75.
Olah, L. S. (2003). Gendering fertility: Second births in Sweden and Hungary.Population Research and Policy Review, 22:171–200.
Oppenheimer, V. K. (1994). Women’s rising employment and the future of the family in industrialized countries.Population and Development Review, 20:293–342.
Rauan, E. C. (2006). Undersøking om foreldrebetaling i barnehager,januar 2006. Notater 2006/32. Statistics Norway. Oslo-Kongsvinger.