STAR: Improved Algorithm based on Sliding Window for
Trust-Aware Routing in WSNs
Mouhebeh Sadat Katebi
Hassan Shakeri
Farzad Tashtarian
Abstract: This research with attention to the establishment of trust in WSNs and with the goal of increment in energy supply and growth in malicious node detection accuracy by using of improved sliding window, is saving energy by using computation of the previous periods. Also, this research calculates the trust in aspect of transferring information, based on subjective logic model and incremented the detection rate of malicious node by proposing two algorithms for identifying these nodes. Then, this method increases the speed of routing. The results of simulation of STAR compared to EDTM (Jiang, et al., 2015) shows 11.99% increment in the residual energy of network and growth of 1.52% in detecting the accuracy of malicious nodes.
Keyw ords: Trust - Wireless Sensor Network – Subjective Logic Model – Sliding Window – Confidence – Routing.
1. Introduction
Since the wireless sensor networks spread everywhere and they are being targeted by many security attacks, it is necessary to provide and maintain security in these networks. Moreover, older security measures should be replaced by new ones. Trust establishment between nodes must be able to evaluate trust among all nodes because the survival of wireless sensor networks is dependent on the trust between the nodes and their participation.
On the other hand, algorithms of trust based systems, as computational loads go up, the nodes would experience lack of energy and life time reduction. Therefore, while designing trust based networks, we must consider the factors such as amount of energy, computational limits, and node and memory limitations in order to build a fully efficient network.
Can be expressed, in general, establishing trust in wireless sensor networks is down with two main objectives: to improve cooperation and increase security (Ishmanov, et al., 2015). Because of the collaboration between sensor nodes in wireless sensor networks, it is crucial to maintain the operation of a network. Also, the trust can be as an important component to gain confidence to obtain data in WSNs.
Manuscript received ; July 20, 2018. Accepted October 30, 2018.
* M. S. Katebi, Dept. of Computer Engineering, Mashhad Branch, Islamic Azad University, Mashhad, Iran, [email protected]. H. Shakeri, Dept. of Computer Engineering, Mashhad Branch, Islamic Azad University, Mashhad, Iran, [email protected].
F. Tashtarian, Dept. of Computer Engineering, Mashhad Branch, Islamic Azad University, Mashhad, Iran. [email protected].
2. Material and methods
In this study, the trust computation system is implemented on WSNs using the improved sliding window and the Subjective Logic (SL) model. The manner of calculating the trust is based on three factors such as residual energy, node behavior and interval of sending and receiving. The residual energy factor, because of being considered as an important feature in node ability, runs a very important role in establishing trust. Node behavior would be determined based on its suspicious behavior or by node's failure to send (transfer) packets to the next nodes. Also, the interval of packet sending/receiving factor is considered for investigating the delay in receiving the packet. To detect the malicious nodes and prevent them to be selected in the routing process, two different algorithms were introduced with the goal of distinguishing two types of different behaviors. The first algorithm is to examine the tapering of the trust node and the second is considered the node cooperation in sending messages to the neighbor node.
This study implemented the trust computation system on WSNs by using the improved sliding window and SL model (Josang, et al., 2006). In this section, the concepts that are used in this research are defined.
2.1. Preliminary definitions 2.1.1. Trust
From the perspective of decision-making, trust means "the desire to confide". From this perspective, trust can be defined as follows:
Trust is the willingness to rely on something or someone in a certain situation which is characterized by a sense of relative security at the same time. Also, it will consider the possible implications (Gambetta, 1988).
This definition, in addition to the level of destination trustworthiness, considers the conditions that must be taken in decision-making. This includes numerous other options for cooperation, risk or profit and loss of interaction or lack of interaction.
2.1.2. Trust-aware routing
34 M. S. Katebi et.al: STAR: Improved Algorithm based on Sliding Window for Trust-Aware…
trustworthiness of nodes participating in the routing process and it tries to make the main goal which is the security of path by observing the certain constraints of any network such as energy constraint. On this basis and considering the fact that WSNs is one of the most popular networks for implementing the Smart City; trust-aware routing protocols will have a critical role in the security of this network.
2.1.3. Confidence
Believe to the truth of trust estimation.
The difference between trust and confidence: trust is taken into account as an agent, but confidence is about the value of trust evaluation.
2.1.4. Sliding window
The window that includes several slices which in any of it, in every slicing time, a value is placed. With arriving a new value, the oldest value will be removed from the window. 2.1.5. Piggybacking
It is a bidirectional data transmission in the network layer (in the OSI model). This approach is prompted by the data frames (that sent from receiver to sender) to add an acknowledgment that indicates that the data frame is received by the receiver successfully (ACK) and this means that instead of sending a separate ACK package, this package adheres over the data that are scheduled to be sent.
2.2. Related Work
Nowadays, there are different studies in trust-based systems domains in WSNs, especially in the trust base routing field. For encrypting communications between the two nodes and the routing packets in WSNs, in 2008, a dynamically and symmetric key distribution method was proposed by Lewis et al (Lewis, et al., 2008). In this method, each sensor node can distribute the common key. Each node can choose one of the neighboring nodes to distribute a key pair to communicate between two nodes. This selection is based on the local computing of obtained trust value from the requesting node. In this study, we present a trust-based routing method that each node employs this method in its routing. Use of direct and indirect trust, has a long history. A trust-aware routing that contains distributed trust model is based on direct and indirect trust information proposed in 2010. The innovation of this trust-aware routing algorithm is a defense against wide attacks using supervision method and awareness from energy. This also leads to better load balancing and more flexibility against attacks.
In 2012, for solving the loss of data integrity problem that was caused by invalid data injection by unauthorized nodes in the network, the researchers (Chakrabarti, et al., 2012) proposed a model that introduces a three layer architecture based on trust framework to also detect unauthorized nodes
from authorized ones and to separate fake data from others.
The base station keeps the sequence of nodes trust values and also the nodes in a cluster save a sequence of trust values of their cluster heads. According to the study, the trust value is affected by energy value, receiving data model (binary or possibility) and a difference in the received data from a node in comparison with the received data from neighbor nodes.
With the aim of finding the trusted nodes and running the routing on these nodes, in 2014, the plan co-worker (Latha & Palanivel, 2014), introduced a secure routing algorithm that detected and ranked the trusted node by using the packet Message Authentication Code (MAC) model and it also gives a chance to the untrusted node to show its honesty. The model provides security features with high performance and a minimum of overload. In the first stage, the source node achieves the MAC value by the message secret code and sends it to its neighbor node. The neighbor node achieves the received message MAC value by the same key. Then both of MAC values would be compared with each other. If each of both values meet together, ACK message would be sent to the sender. If the sender did not receive the ACK message, its neighbor node would be placed in a different list as an untrusted node. In the second stage, the nodes that were detected as trusted are ranked based on the number of packets they send and also the quality of their behavior with other neighbors. In the third stage, as soon as the source node receives a signal, it starts the routing process for its packets using predetermined nodes, and then ranking would be done based on the second stage. In the fourth stage, the trustworthiness of the nodes that are kept in the list would be reevaluated. In another study, in 2014, the requirement for routing protocols based on trust was studied in research (Vasudha & Gajkumar Shah, 2014). In this study, the nodes that have low security are detected and then are equipped with the defense system by using clustering methods and path discovery algorithms that are based on trust.
In 2015, in a study of security threats and energy constraints in multi-hop WSNs, (Raza, et al., 2015) proposed an energy storage routing protocol that is safe and based on trust. This protocol supervised the trustworthiness and reputation of nodes and it maintains a history of interactions between nodes to determine the safety and trustworthiness of the paths. The protocol has three phases for detecting the neighbors, cluster, head selection and data sharing. In 2015, a trust framework was designed for secure routing in WSNs by (Hoceini, et al., 2015), that is based on network architecture structure. This approach can effectively reduce the costs of trust evaluations and guarantee the selection of most secure paths leading to the base station. The protocol evaluates the trustworthiness of sensor nodes according to acknowledges of the base station and the recommendations of the neighbor nodes. To protect WSNs against multi-hop path corrupter attackers, (Chavan, et al., 2015) a model that has a strong framework was implemented to trust-aware routing for WSNs, in 2015. This model provides an energy-efficient and trustworthiness path without synchrony and GIS. More importantly, this model has an efficient definition against attacks that produce fake ID. In 2015, in terms of energy saving and guaranteeing the secure data transmission for WSNs, a routing protocol based on a potential field and trust was proposed by (He & Zhao, 2015). For node and valid cluster head selection process, considered three factors such as residual energy, trust value and distance.
value is completely achieved by direct experiences of node A with node B, this model is called direct trust, otherwise, a recommendation trust model is built. In the multi-hop model, when node A received a recommendation from other nodes for node B, then the indirect trust model is built. The direct trust between two neighbor nodes is calculated using Equation 1:
𝑇𝑛−𝑑𝑖𝑟𝑒𝑐𝑡 = 𝑊𝑐𝑜𝑚𝑇𝑐𝑜𝑚+ 𝑊𝑒𝑛𝑒𝑇𝑒𝑛𝑒+ 𝑊𝑑𝑎𝑡𝑎𝑇𝑑𝑎𝑡𝑎 (1)
where Wcam , Wene and Wdataare the weight of communication, energy and data trust, respectively.
Authors introduced Equations 2 and 3, to calculate the indirect trust in two steps of finding the multi-hop recommenders between two nodes and trust propagating.
𝑇𝑛−𝑖𝑛𝑑𝑖𝑟𝑒𝑐𝑡(𝐶𝐵 1) = {
𝑇𝐶1∗ 𝑇𝑐𝐵1, 𝑖𝑓 𝑇𝑐𝐵1< 0.5
0.5 + (𝑇𝑐1− 0.5) ∗ 𝑇𝑐𝐵1, 𝑒𝑙𝑠𝑒
(2)
𝑇𝑛−𝑖𝑛𝑑𝑖𝑟𝑒𝑐𝑡(
𝐵 𝐶𝑖+1)
=
{
𝑇𝐶𝑖+1∗ 𝑇𝑛−𝑖𝑛𝑑𝑖𝑟𝑒𝑐𝑡(
𝐵
𝐶𝑖) , 𝑖𝑓 𝑇𝑛−𝑖𝑛𝑑𝑖𝑟𝑒𝑐𝑡(
𝐵 𝐶𝑖) < 0.5
0.5 + (𝑇𝑐𝑖+1− 0.5) ∗ 𝑇𝑛−𝑖𝑛𝑑𝑖𝑟𝑒𝑐𝑡(
𝐵
𝐶𝑖) , 𝑒𝑙𝑠𝑒
(3)
In 2016, researchers (Kaur, et al., 2016) suggested a trust-based key management routing framework in WSNs that creates a secure and trustworthiness path dependent on the current and past interactions. Then, the path is updated by the separation the malicious nodes or vulnerable nodes. In this model, the network parameters can be determined such as the network deployment area, the number of nodes, the rate of the malicious node in the network (if the effect of attacks and transmission range of a node are taken into account). Using a distributed trust model for the discovery and the separation of the misbehaving nodes, a secure and energy/trust-aware protocol was introduced by (Ahmed, et al., 2016) in 2016. This protocol uses a polymorphism routing method which considers trust level, residual energy and hop number of neighbor nodes, during the routing. This method not only guarantees data release through the trustworthiness nodes but also keeps the energy balance through trustworthiness nodes. This model contains four modules such as trust estimator, trust database, decision-making path and bootstrap path. The idea of integration of fault tolerance and secure routing for WSNs was present in 2016 by (D. Devanagavi, et al., 2016). The goal of this model is establishing a secure path from the source to the base station, even in the presence of malicious nodes. In this idea, the agent-base trust model is used. Data is also transferred from a safety path and without malicious or compromiser nodes to the base station. Also in 2016, (Salehi, et al., 2016) proposed a trust-base compromising routing protocol for WSNs. The protocol is used for direct relations between the sensor nodes and it benefits from a novel watchdog mechanism considering not only the forwarding behavior of the nodes but also the quality of the links between them. In a sophisticated algorithm, choose the next node for net hop, according to three criteria of link quality, geographic location and trust level.
3. Calculation of trust in the STAR
3.1. Network topology model
In this network, each node has a unique identification that cannot be assigned to the other. However, the nodes in this network are immobile and all of them are homologous in terms of storage capacity, initial energy, power supply and computing power. Also, each node holds a list of last neighbor nodes trust value that previously interacted with them, in a table with the name of "Information List" (IL). The structure of this table includes the sliding window improved plan. Also, in order to remove the malicious node from the routing process, information of the mentioned node was recorded in the "Malicious Node List" (MNL) which each node has it.
For the storage of trust, the values will be considered in the range of (0-15), because if values are stored as the binary form or stored between 0 and 4, it leads to reducing the trust accuracy and if its data type be as decimal, it finished to increase the computing space and subsequently led to reduction in the computation speed. Therefore, this choice has the advantage that it reduces the memory and communication overhead through the computation of trust in this range of storing.
3.2. Information List and present sliding window improved structure.
Each node needs appropriate space to store the information of nodes that interact with them to access them when required, the accession must be able to do search, insert and delete operations. Thus, the IL structure is introduced as below:
IL structure contains two priority levels (Fig 1.a). High priority is for nodes that have more interaction with the source node and so their values remain longer in the sliding window. Therefore, a low priority is assigned to other nodes. The node with low priority changes to high priority after it was used Nusing times in the routing. The implementation of this list has a major advantage that there is not needed to broadcast the trust value from base station and the nodes will not be required to share the trust value. Use this list, as well, increase efficiency of system resource by reducing in network communication overhead.
In each node, IL includes the number of cells and the structure of each cell includes node identification number, sliding window that its width is Lsw and residual chance. (Fig 1.b)
The proposed structure of the sliding window also includes three items. The first item is computing the trust time, the second item is the trust value and the third item is the interaction number. The sliding window is organized in IL (Fig 1.b).
3.3. Computation of performance based on network trust in interactions
36 M. S. Katebi et.al: STAR: Improved Algorithm based on Sliding Window for Trust-Aware…
placed in proportional new location according to the current time. The scenario can be explained as follows:
1. Starter node (node A), determines the destination node (node B) that is going to interact with it.
2. Check the presence or absence of node B is addressed in the IL of node A.
High priority
Low priority
a. Information List Structure
b. Structure of any cell of Information List
Node ID
Residual Chance
Improved structure of
Sliding Window Time
Trust Interaction No
Fig 1. a. The IL structure, b. The structure of any cell of IL
There is the address of node B in IL of node A.
2.1.1. If the trust of node B, was unacceptable, node A passes up from interacting with node B and then terminates. 2.1.2. If the trust information retrieved from the list is
acceptable, compare the time of the trust value recorded with the current time.
2.1.2.1. If this interval was acceptable, node A is going to interact with node B and inserts trust information of node B and the current time in the right location of IL and then terminates.
2.1.2.2. If this interval is not acceptable, go to the next step. 2.2. Address of node B does not exist in IL of node A or is
not acceptable the interval then:
2.2.1. Node A sends a recommendation request package about declaration individual trust of each neighbor node to node B and asks their opinion about node B.
2.2.2. Any neighbor nodes send its direct or indirect opinion according to this scenario.
2.2.3. Node A, collects the received opinions. The opinions that have lower trust from threshold trust, are removed. 2.2.3.1. If the number of remover opinions is more than half
plus one of total opinion, the final opinion of node A about node B, will be based on distrust to node B and terminate the process.
2.2.3.2. If the number of remover opinions is less than half plus one of the total opinion, node A arranges the gained opinions values base on trust value of its first next node. Then compute the weighted mean and then if the gained result is acceptable, the new trust of node B and its time, are stored in IL of node A. Therefore, node A will decide to interact with node B and choose the path that reports greatest trust value. If more than one path, declares the same trust value, the path of creating the interaction will be the path that has the minimum hop.
3.3.1. Methods of detection of malicious nodes
Based on the assumptions, there will be two kinds of malicious nodes: the node that its trust is reducing successively and the node that prevents from sending an
information packet to the destination. Thus, two separate algorithms are introduced to detect malicious nodes:
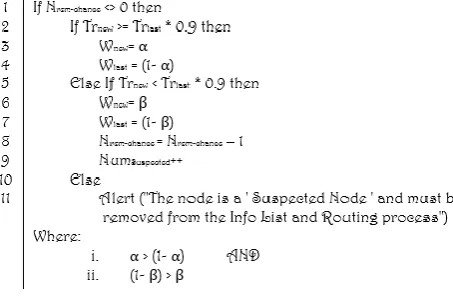
3.3.1.1. Computation of Node Descending Trust (CNDT)
If there are Nuse-chance consecutive times, as much as 0.9% reduction
in the latest trust (Trnew) evaluation of a node than last trust value
(Trlast), the mentioned node has been identified as a suspicious node
and is removed from IL and routing operations and their subsequent monitoring will be a duty of their neighbors. This is because it is believed that the trustworthiness of a node - that its trust value is reducing consecutively as much as 0.9 of last calculated trust value - is being questioned and needs supervision. To implement this approach, residual chance factor was used. In this way that by the initialization of residual chance for each node, as soon as the observation of condition (when trust value of Trnew is reduced 0.9%
than Trlast), a unit of a residual chance factor is deducted and its
value will be stored for future use. The Pseudo-code algorithm of CNDT can be seen in:
Fig 2. CNDT algorithm pseudo-code
Here, the values of different W, are the weight of trust values or the impact factor of the history.
It should be pointed out that this algorithm, in addition, to identifying malicious nodes, provides the required weights for use in Equation 14, that will affect the history of the last trust value in the new value.
3.3.1.2. Computation of Node Association (CNA)
If the number of packets sent from a node such as A is greater or equal to Percentpacket_sent percentage of its neighbor nodes and the
participation of a specific neighbor node like B exists in less than Percentassociation percentage of interactions of node A, then node B
recognized as suspicious node, is used from chance and will be monitored. The Pseudo-code algorithm of CNA can be seen in Fig 3:
Fig 3. CNA algorithm pseudo-code
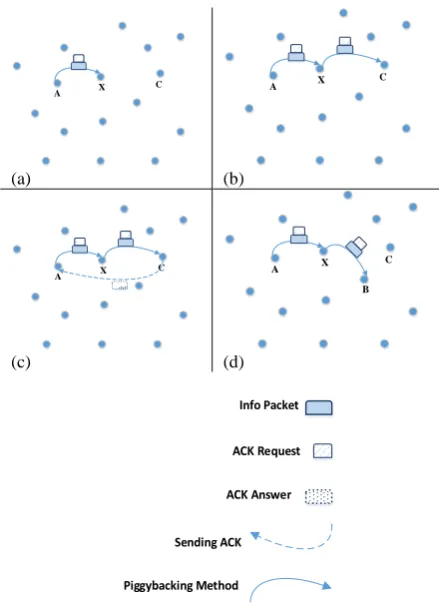
3.3.2. Monitoring phase
When a node detects that another node (such as X) has been suspicious, it informs its neighbors by sending a packet to them. Each node that was made aware of its malicious or suspected neighbor, after the time of tdet_mal from while node X detected as malicious or suspicious, then will be monitored the node X in a period of time, as follows: 1. If nodes A and C are as the neighbors of node X and are
considered to be supervisor of X, then when node A wants to send data (including request Acknowledgement) to node C, then its data is sent via node X and waits for ACK message from node C (Fig 4-.a).
2. In this case, it is assumed that node X sends this packet to node C (Fig 4-.b). Also, node C which knows that node X is a malicious mode, sends an ACK message to senders of the packet which is received from node X (Fig 4-c) and then sends the received packet with node X information to the next node by the piggybacking method.
3. If after the twait, did not receive any ACK message from node C, that means that node X did not perform routing appropriately and sent the packet to its arbitrary node, such as node B (Error! Reference source not found.3.d). Therefore, node A will resend its data and information of node X also, by the piggybacking method.
A X
C
(a)
A X C
(b)
A X
C
(c)
A X C
B
(d)
ACK Request
ACK Answer
Sending ACK
Piggybacking Method Info Packet
Fig 4. Steps of monitoring phase. a- Node A sends its packet via node X to node C. b- Node X sent the packet of node A to node C. c- Node C. When it received a packet of node A, it sends ACK message. d- Node X, doesn’t send the packet to its destination.
Now we can consider a situation that malicious or suspect node X, wants to produce fake ACK and performing this action with the aim of deceiving the sender node (node A), certifies this node to arrive data to node C. Therefore, to
ensure the arrival of the data packet to true destination, when a node A wants to send data to node X with the aim of monitoring it, node A informed the neighbors of node X. Neighbor node also, controls the arrival or non-arrival of the packet of node A to node C, through overhearing. Then node A after receiving the ACK, determines whether the ACK message is real or fake. Through voting results have been reported by neighbor nodes. The result of evaluation of of node X with gained information, including the amount of trust that has been evaluated and a number of times to monitoring, is stored in the base station to record the history. Each node that detects as malicious Ndet_mal times, is removed from routing cycle and is not monitored never.
3.3.3. Distribution the information of malicious node between nodes and base station
The suggestion of distributing the information of malicious nodes will be based on this approach that each node in its interactions in several times, sends trust value of the node that was detected as a malicious node to base station via the piggybacking method. The base station also, in a certain interval, declares these values to neighbor nodes of the aforementioned node.
3.3.4. Method of interaction with new node and initialization of the trust value
The suggestion of how to deal with the node that has not recorded its interaction, would be considered a temporary trust based on its residual energy. This temporary value is the same initial value of trust for each node in starting the network. Then, the considered node will be tested on the verification test. If the result of the test is positive, interaction with this node will be started. Otherwise, the history of node evaluation will be stored as its trust value and it will be monitored by its neighbor nodes.
The verification test could be considered such that after the node A is sent its packet that includes of ACK request from node C, to node X (node X that is tested), after the appropriate time, the positive or negative result is determined through receiving or not receiving the ACK message from node C.
3.3.5. Calculation of energy parameters
The affecting factors in energy consumption, are the cost of sending and receiving the packet and passes up from the cost of energy for computation due to insignificance of the matter. To initialize the primary energy of any sensor node and energy consumption in receiving and sending the packet activities, the values that are proposed in (Zho, et al., 2015) have been used.
3.3.6. Decision and calculation of trust, based on subjective logic model
38 M. S. Katebi et.al: STAR: Improved Algorithm based on Sliding Window for Trust-Aware…
threshold, then its decisions are made based on trust value that is fetched and otherwise, node A computes the new trust value (Trnew). It should be noted that the consideration of this case, has the important advantage that it will increase the speed of routing.
To calculate the amount of trust, the requester node use of these factors for evaluating the trust of the node considers: the amount of successful (NS) and unsuccessful (NUS) interactions, the amount of residual energy (Erem), the number of known as suspected node from evaluator node (Nsus), the number of monitored because of being known as malicious node from neighbor nodes (Nmal) and finally the interval of sending and receiving the packet by considering node (tsr). To use any of these parameters first the amount of effect of any parameter must be investigated independently and ultimately, the resultant of all obtained relationships should be introduced as the final evaluated trust value. Subsequently, the trust value in the fields of energy, behavior and packet sending is computed.
The energy trust is calculated using Equation 4:
𝑇𝑟𝑒𝑛𝑒𝑟𝑔𝑦= 𝐸𝑟𝑒𝑚/𝐸𝑖𝑛𝑖 (4)
Here, Eini represents the value of initial energy of each node and Trenergy illustrates the trust of the perspective of energy.
Due to Equation 5 of computing the trust in node behavior area, the effect of two parameters of Nsus and Nmal on trust value, fit into one equation:
𝑇𝑟𝑏𝑒ℎ𝑎𝑣𝑖𝑜𝑢𝑟= (1 − 𝑁𝑠𝑢𝑠 /𝑁𝑚𝑎𝑥−𝑠𝑢𝑠)
∗ (1 − 𝑁𝑚𝑎𝑙/𝑁𝑚𝑎𝑥−𝑚𝑎𝑙) (5)
Where Nmax-sus is the maximum number of times that a node can monitor as a suspicious node and Nmax-mal is the maximum number of times that a node can monitor as a malicious node. Trbehavior illustrates the trust of the perspective of node behavior.
According to the Equation 5, it can be argued that if the outcome of Nsus /Nmax−sus or Nmal/Nmax−mal is zero, this
means the complete trust in its area (The first fraction illustrates the suspicious and the second fraction expresses the malicious) and vice versa. If we have value one or close to one, this means subtracting the same amount of trust in the same field. The production of two parentheses also proves that if a node was detected as malicious node (that it's mean is 1 − Nsus /Nmax−sus = 0 or1 − Nmal/Nmax−mal= 0), if one of the parenthesis being zero, the other will lose its cost; because it has been terminated its chance for malicious or suspicious and in each of these scenarios (malicious is known, or suspected), it has been established malicious of node.
To make-decision for the success or failure of sending a packet, the differences of the interval of sending and receiving of a packet must be calculated. But since it is inevitable that a packet might be missing in the networks, to consider the effects of this case, the calculation by (Faridi, et al., 2010) was used, first, the probability of packet loss in calculating the RTT was will be considered as follows:
When a node wants to send a packet and at the same time, another node or its neighbor nodes are also sending a packet,
then the possibility of collision occurs. In this case, one or all of the packets are lost and the sender must resend its packet. What can occur in an information transmission, is the failure to access the channel, collision of packet or success in sending the packet.in (Faridi, et al., 2010), is considered as two modes for packet losing, one is the failure mode and another is the collision. So, based on the result of (Faridi, et al., 2010). The calculation of the probability that is the outcome of a packet is terminated to one of the modes of failure or collision obtained by Equations 6 and 7:
𝑃𝐹𝐴𝐼𝐿= ∏(1 − 𝑦𝑖) 𝑀
𝑖=0
(6)
𝑃𝐶𝑂𝐿= 𝑃𝑐𝑜× (1 − 𝑃𝐹𝐴𝐼𝐿) (7)
In Equation 6, y is the possibility of access to the channel, M is number of channel detection states (CCA) and𝑃𝐹𝐴𝐼𝐿, is
the possibility of failing in channel access and in Equation 7,
𝑃𝑐𝑜, is the probability of collision for each node and finally,
𝑃𝐶𝑂𝐿, is the possibility of network collision.
Therefore, by applying the effect of the collision event, for obtaining a successful result or achieving an unsuccessful result in a particular interaction, Pseudo code of Fig 5 can be used:
Fig 5. Pseudocode of result of successful or unsuccessful in a sending
Here, RTT is the trip time (packet sending) and back (getting ACK) and Tmax is the threshold value of RTT whose value is obtained for each node, by using Equation 8:
𝑇𝑚𝑎𝑥(𝑖) = 𝑇ℎ𝑟𝑒𝑠ℎ𝑜𝑙𝑑𝑅𝑇𝑇+ 𝑃𝐶𝑜𝑙(𝑖) (8)
The concept of this equation is that for every node i can be added to the delay in receiving the packet, two values of RTT threshold and a measure of the probability of collision in packet sending for same node i.
By calculating each of subjective logic model parameters, the evaluated trust is computed based on SL model (Equations of 9, 10 and 11). S, F, b, d and u expressed success, failure, belief, disbelief and uncertainty, respectively:
𝑏 = (𝑆/𝑆 + 𝐹 + 1) (9)
𝑑 = (𝐹/𝑆 + 𝐹 + 1) (10)
𝑢 = (1/𝑆 + 𝐹 + 1) (11)
It is considerable that obtained value of u parameter is the confidence value that illustrated the amount of trust accuracy and for applying its effect on the trust value, the SL model is used.
𝑇𝑟𝑝𝑎𝑐𝑘𝑒𝑡 = 𝑏 + 𝑎𝑢 (12)
That the parameter "a" is usually considered as 0.5 and
Trpacket is expected value of trust in packet sending field.
Now, with having obtained trust values of each field (i.e. Equations of 4, 5 and 12), the final trust of a node is gained by adding and multiplying the weight of these trust values, according to Equation 13:
𝑇𝑟𝑛𝑒𝑤 = 𝛼 ∗ 𝑇𝑟𝑝𝑎𝑐𝑘𝑒𝑡+ 𝛽 ∗ 𝑇𝑟𝑒𝑛𝑒𝑟𝑔𝑦+ 𝛾
∗ 𝑇𝑟𝑏𝑒ℎ𝑎𝑣𝑖𝑜𝑢𝑟
𝑊ℎ𝑒𝑟𝑒 𝛼 + 𝛽 + 𝛾 = 1
(13)
In this equation, values of coefficient of α ،β and γ, are variable and show the amount of effect of each obtained trust. The value of Trnew is the newest computed trust value
of a certain node.
The method of entering and exiting trust value in sliding window and computing the impact factor in trust value can be calculated as defined in Equation 14:
𝑤𝑖= 𝜌𝜀Δ𝑇𝑖 (14)
And finally, the result of history (Trlast is the result of trust value in three past interactions), is calculated according to Equation 15:
𝑇𝑟𝑙𝑎𝑠𝑡= 𝑊3∗ 𝑇𝑟3+ 𝑊4∗ 𝑇𝑟4+ 𝑊5∗ 𝑇𝑟5 (15)
To save new trust in a sliding window by applying weighted (weights derived from algorithm Pseudo code CNDT), the new value of the last trust, Trfinal, is obtained from Equation 16:
𝑇𝑟𝑓𝑖𝑛𝑎𝑙 = 𝑊𝑙𝑎𝑠𝑡∗ 𝑇𝑟𝑙𝑎𝑠𝑡+ 𝑊𝑛𝑒𝑤∗ 𝑇𝑟𝑛𝑒𝑤 (16)
4. Simulation results
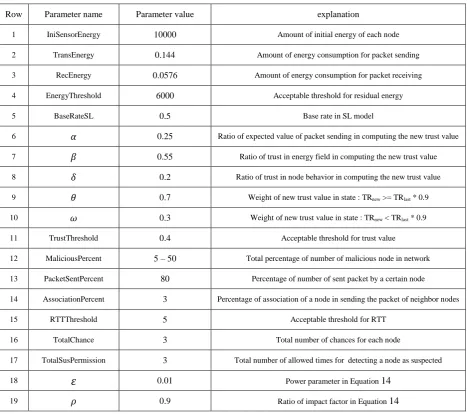
The wireless sensor network of STAR has been 200 nodes that established in spatial of dimensions of 40 × 40 square meters. Each node has a different number of neighbors and has radio radius of eight meters. The parameters that using in this network and values of trust computation parameters is observed in Error! Not a valid bookmark self-reference.
Table 1. parameter of implementation
Row Parameter name Parameter value explanation
1 IniSensorEnergy 10000 Amount of initial energy of each node
2 TransEnergy 0.144 Amount of energy consumption for packet sending
3 RecEnergy 0.0576 Amount of energy consumption for packet receiving
4 EnergyThreshold 6000 Acceptable threshold for residual energy
5 BaseRateSL 0.5 Base rate in SL model
6 𝛼 0.25 Ratio of expected value of packet sending in computing the new trust value
7 𝛽 0.55 Ratio of trust in energy field in computing the new trust value
8 𝛿 0.2 Ratio of trust in node behavior in computing the new trust value
9 𝜃 0.7 Weight of new trust value in state : TRnew >= TRlast * 0.9
10 𝜔 0.3 Weight of new trust value in state : TRnew < TRlast * 0.9
11 TrustThreshold 0.4 Acceptable threshold for trust value
12 MaliciousPercent 5 – 50 Total percentage of number of malicious node in network
13 PacketSentPercent 80 Percentage of number of sent packet by a certain node
14 AssociationPercent 3 Percentage of association of a node in sending the packet of neighbor nodes
15 RTTThreshold 5 Acceptable threshold for RTT
16 TotalChance 3 Total number of chances for each node
17 TotalSusPermission 3 Total number of allowed times for detecting a node as suspected
18
𝜀
0.01 Power parameter in Equation 1440 Katebi et.al: STAR: Improved Algorithm based on Sliding Window for Trust-Aware…
4.1. Comparative evaluation of STAR with EDTM
In this section, the result of comparing the residual energy and detection percentage of the malicious node in STAR, with EDTM (Efficient Distributed Trust Model) will be analyzed that was proposed by (Jiang, et al., 2015).
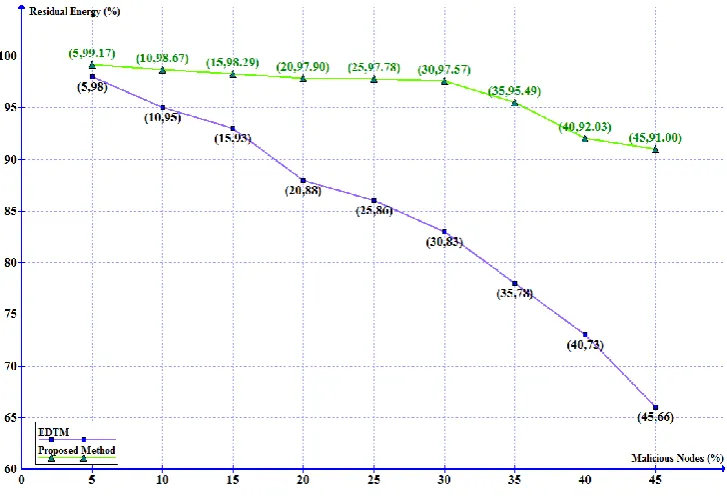
4.1.1. Evaluation and analysis the residual energy of total of network
For achieving the residual energy of total of network, after each time determining the percentage of the number of malicious node and termination of simulation, the percentage of residual energy of total network is computed. The result of comparing the simulation of STAR and EDTM, presented in the graph of Fig. 6.
As the same time, STAR, is shown by having 11.99% increase compared to EDTM, it can better preserve the residual energy of network with a final value of the energy 867.9 MJ while, the residual energy of network in EDTM, is 760 MJ. This difference occurred due to storing the energy of sensor nodes by not forwarding the packet to malicious nodes that are placed in their neighborhood. Because after the simulation of malicious nodes detection algorithms, and again, because of the report of the detector node to base station, the neighbor nodes of the malicious node via base station declaration, are kept from interaction with malicious node without any energy, time and relation consumption. The providence in interaction creation, is useful in broadcasting a packet by a node to its neighbor nodes, because the malicious node exists in MNL of the sender node and then does not send any packet to it. Therefore, this led to more storing the energy of sender node. Also, using
improved sliding window with impact factor, helps each node to use the latest trust values in sliding window instead of creating new interactions, the last trust value is used in sliding window structure and benefits from the previous actions in the detection and evaluation of that node, without any need to renewed consumption of energy.
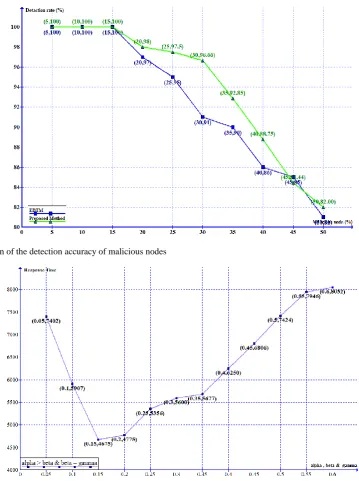
4.1.2. Evaluation and analysis of the detection accuracy of malicious nodes
In the simulation, MaliciousPercent parameter grows from 5% to 50%, that in each increasing the malicious nodes number, the simulation is done and the amount of malicious nodes detection is evaluated. The result of this evaluation illustrates an increase in detection of the precision of STAR than EDTM model. The result is shown in graph of Fig. 7.
This comparison demonstrates that STAR increased the ability of malicious node detection to 94.02% by 1.52% increasing than EDTM design. However, the detection accuracy of EDTM model is 92.5%. But as you can see in the above figure, in STAR, the amount of detection accuracy from 30% damage to the next, has downfall by more coefficient than EDTM. This is because that in simulation and with the action of malicious nodes algorithms specially, and also, because of that some nodes it is placed near the more malicious nodes and is forced to use from residual neighbor nodes in their packet sending and some of these neighbor node after do not have enough energy for sending packet and then are detected as malicious nodes step-by-step, so if real malicious node is close to these nodes and that they are identifiable only through this nodes, then the suspicious nodes would remain hidden.
Fig. 7. Comparison of the detection accuracy of malicious nodes
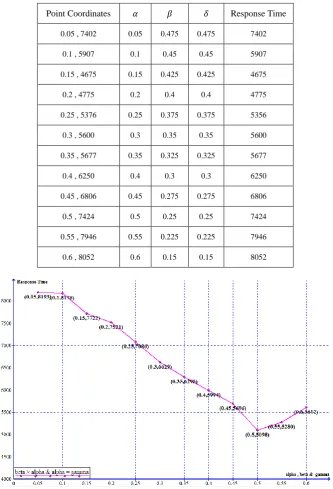
Fig. 8. Discussion of optimal value of 𝛼 and response time
4.2. Analysis of the performance of STAR
In this section, the parameters of the simulation are discussed and based on the obtained curves of several runs of simulation, the optimal value is achieved.
4.2.1. Evaluation the effect of trust computation coefficients on network performance
In this evaluation, the purpose of trust computation coefficients is the coefficients used in Equation 13 that are recognized in simulation by the names of 𝛼, 𝛽 and 𝛿. So, for presentation of the amount of access speed of malicious nodes detection – that is one of goals of this study – for different values of the coefficients and the malicious percent equal to 5%, the graphs of the Figure 8 Figure 1 to are provided that express the amount of access speed of
malicious nodes detection based on different values of coefficients of 𝛼, 𝛽 and 𝛿. In all of the graphs, the numerical value of obtained points response time in each change of 𝛼,
𝛽 and 𝛿 values, is the yield of result mean of simulation run in three times. Other parameters are initialized according to the Tabel 1..
Remind that 𝛼 is the TRpacket coefficient in Equation 13. In the graph, the below situations for 𝛼, 𝛽 and 𝛿 are considered.
𝑎𝑙𝑝ℎ𝑎 > 𝑏𝑒𝑡𝑎 & 𝑔𝑎𝑚𝑚𝑎 𝑏𝑒𝑡𝑎 = 𝑔𝑎𝑚𝑚𝑎
Since that sum of three coefficients is equal to one, each point in the graph of Fig 8. The 𝛼, 𝛽 and 𝛿 values of Table 2 follow.
42 M. S. Katebi et.al: STAR: Improved Algorithm based on Sliding Window for Trust-Aware…
optimal point is explanatory that the increment in expected value of packet sending, from out of this range, led to an increment in response time and then this event is accented that two coefficients of 𝛽 and 𝛿 are also important,.
The same process is running for 𝛽 and 𝛿 coefficients in graphs of Fig. 9 Fig. 9and a similar value of Table 2.
The state of coefficients in Fig. 9. is as follow:
𝑏𝑒𝑡𝑎 > 𝑎𝑙𝑝ℎ𝑎 & 𝑔𝑎𝑚𝑚𝑎 𝑎𝑙𝑝ℎ𝑎 = 𝑔𝑎𝑚𝑚𝑎
and in
Fig. 10, is as follow:
𝑔𝑎𝑚𝑚𝑎 > 𝑏𝑒𝑡𝑎 & 𝑎𝑙𝑝ℎ𝑎 𝑎𝑙𝑝ℎ𝑎 = 𝑏𝑒𝑡𝑎
It is pointed out that the 𝛽 in Equation 13 the TRenergy coefficient exists.
As the same shown in Fig. 9 Fig. 9the optimal value of 𝛽 is in the range of (0.45, 0.55). This graph shows that although the response time is decreasing by increasing the energy trust coefficient value to 0.5, but after this amount and further increasing the energy trust coefficient, the response time will be increased. That means that although residual energy amount is the more effective factor in response time, but at the same time, the amount of trust in packet sending and in node behavior in the interaction with neighbors, has its appropriate value, too. The graph of
Fig. 10, shows the discussion of 𝛿 that is TRbehavior coefficient. The optimized value of 𝛿 is in the range of (0.15, 0.25).
Table 2. 𝛼, 𝛽 and 𝛿 values in discussion the optimal value of 𝛼
Point Coordinates 𝛼 𝛽 𝛿 Response Time
0.05 , 7402 0.05 0.475 0.475 7402
0.1 , 5907 0.1 0.45 0.45 5907
0.15 , 4675 0.15 0.425 0.425 4675
0.2 , 4775 0.2 0.4 0.4 4775
0.25 , 5376 0.25 0.375 0.375 5356
0.3 , 5600 0.3 0.35 0.35 5600
0.35 , 5677 0.35 0.325 0.325 5677
0.4 , 6250 0.4 0.3 0.3 6250
0.45 , 6806 0.45 0.275 0.275 6806
0.5 , 7424 0.5 0.25 0.25 7424
0.55 , 7946 0.55 0.225 0.225 7946
0.6 , 8052 0.6 0.15 0.15 8052
Fig. 10. Discussion of optimal value of 𝛿 and response time
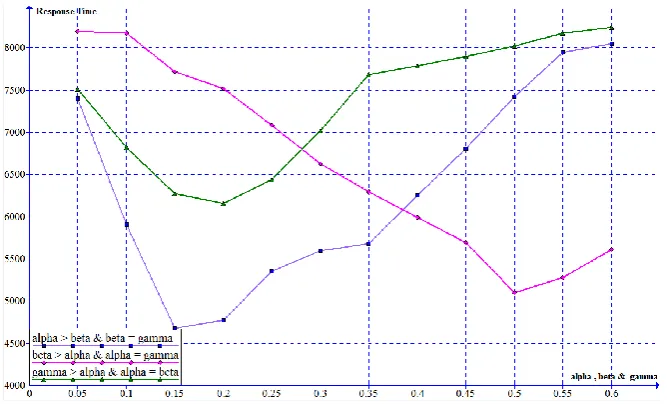
Fig 11. Comparison of response time in 𝛼, 𝛽 and 𝛿
For comparison and designing how to select the coefficients values of 𝛼, 𝛽 and 𝛿, all three graphs are plotted in Fig. 11.
Based on the chart, we can say according to the proof of the significance and the effect of energy in decreasing the response time, the criterion of choosing 𝛼, 𝛽 and 𝛿 values is based on priorities of energy, expected value of packet sending and node behavior. The obtained value for 𝛽 coefficient (0.55), reflects the fact that the residual energy of a sensor node in the trustworthiness of the same node, has more importance than the node behavior between neighbor nodes. On the other hand, it seems reasonable that if a subject node is going to choose a node for its interactions, between two sensor nodes that the first node has high trustworthiness in packet sending (TRpacket) or in behavior (TRbehavior) and has minimum of energy, and against the trustworthiness of packet sending or behavior of second node was lower than
the first node but its residual energy was greater, the starter node will choose the second node, because the probability of reaching the packet. By the node that has more energy than a node with lower energy, is much higher. Also, according to this graph and with comparing the minimum point on all three graphs, about the 𝛿 curve that has upper minimum point than the 𝛼 and 𝛽 curves, we can say that the impact of node behavior in STAR, than the impact of energy and the expected value of packet sending, is lower. In other words, the high important of energy and expected value of packet sending in routing process is reflected.
4.2.2. Evaluation of the accuracy of STAR
In this section, the accuracy of STAR is evaluated based on Precision, Recall and F1-measure factors.
44 M. S. Katebi et.al: STAR: Improved Algorithm based on Sliding Window for Trust-Aware…
rate among the predicted data.
𝑃𝑟𝑒𝑐𝑖𝑠𝑖𝑜𝑛 = 𝑇𝑃/(𝑇𝑃 + 𝐹𝑃) (17)
The Recall factor (Equation 18) shows the ratio of predicted data to a total number of expected data for prediction.
𝑅𝑒𝑐𝑎𝑙𝑙 = 𝑇𝑃/(𝑇𝑃 + 𝐹𝑁) (18)
Also, F1-measure (Equation 19), is the weighted mean between Precision and Recall.
𝐹1= 2 ∗ ((𝑃𝑟𝑒𝑐𝑖𝑠𝑖𝑜𝑛 ∗ 𝑅𝑒𝑐𝑎𝑙𝑙)/(𝑃𝑟𝑒𝑐𝑖𝑠𝑖𝑜𝑛 +
𝑅𝑒𝑐𝑎𝑙𝑙)) (19)
Therefore, it can be plotted in
Table 3 that shows Precision, Recall and F1-measure values in malicious nodes detection for different percentages of malicious nodes (Malicious Percent).
Table 3. Accuracy of STAR between predicted data
MaliciousPercent Precision Recall F1-measure
55 1 1 1
10% 1 1 1
15% 0.88 1 0.93
20% 0.84 0.97 0.9
25% 0.81 0.98 0.88
30% 0.8 0.96 0.87
35% 0.78 0.92 0.84
40% 0.78 0.92 0.84
45% 0.78 0.86 0.81
50% 0.74 0.82 0.77
According to the Precision values in
Table 3 that illustrate the obtained accuracy, it is observed that although with the increment in the malicious rate of nodes, the detection accuracy has a descending flow, but achieving the values more than 0.7 show the detection with appropriate accuracy. Also, Recall values are explanatory that even by an increment in malicious nodes percent, the STAR has a very good ability for detection of the really malicious nodes. Similarly, the F1-measure factor emphasizes on verification the resulting values of two criteria of Precision and Recall.
5. Conclusion and future works
The result of this research has shown that by using the STAR it can be performed up to very substantial saving in energy consumption and at the same time, adding to previous
achievements, the accuracy of detection of malicious nodes is increased. Increased accuracy in malicious nodes detecting is a factor for the speed growth of routing. This is because if detection accuracy is higher, the participating malicious or suspicious nodes in selecting and applying in the path of packet sending is decreased and then the packet will arrive earlier and more securely.
In the future we can regulate the chance factor for each node based on function of neighbor opinions until the number of chance for a node that has more trust value with view of its neighbors can be much more than a node that does not have this advantage, because the factor is an important agent in the postponement of detection a node as malicious node. So the node that cannot have trust value from views of its neighbors, has less chance of having the opportunity and will be introduced earlier as a malicious node. In addition to the above, in order to reduce the number of nodes that are known to malicious node wrongly, the base station can evaluate the received information and if it confirms the existence of malicious behavior, votes not to trust reported node and then introduces this node to the network as malicious. We can also present the strategies for resisting the STAR against the attacks, especially on-off attacks and bad mouthing attack in future.
References
[1] Ahmed, A., Abu Bakr, K. & Channa, M. I., "A Secure Routing Protocol with Trust and Energy Awareness for Wireless Sensor Network", Mobile Networks and Applications, 21(2), pp. 272-285, (2016).
[2] Chakrabarti, A., Parekh, V. & Ruia, A., "A Trust Based Routing Scheme for Wireless Sensor Networks", Bangalore, India, Springer Berlin Heidelberg, pp. 159-169, (2012).
[3] Chavan, P. A., Aher, R. D., Khairnar, K. V. & Sonawane, H. D., "Enhanced Trust Aware Routing Framework against Sinkhole Attacks in Wireless Sensor Networks", Engineering and Technical Research (IJETR), 3(1), pp. 22-25, (2015).
[4] D. Devanagavi, G., Nalini, N. & C.Biradar, R., "Secured routing in wireless sensor networks using fault-free and trusted nodes", Communacation Systems, 29(1), pp. 170-193, (2016).
[5] Faridi, A., Dohler, M. & Grieco, L. A., Comprehensive Evaluation of the IEEE 802.15.4 MAC Layer Performance With Retransmissions. IEEE TRANSACTIONS ON VEHICULAR TECHNOLOGY, 59(8), pp. 3917-3932, (2010).
[6] Gambetta, D., "Can we trust trust", Trust: Making and breaking cooperative relations. pp. 213-237, (1988). [7] He, S. & Zhao, H., "Trust and potential field-based
routing protocol for wireless sensor networks", Ningbo, Signal Processing, Communications and Computing (ICSPCC), (2015).
[9] Ishmanov, F., Won Kim, S. & Yeob Nam, S., A "Robust Trust Establishment Scheme for Wireless Sensor Networks", Sensors, Volume 15, pp. 7040-7061, (2015). [10] Jiang, J. et al., "An Efficient Distributed Trust Model for Wireless Sensor Networks", PARALLEL AND DISTRIBUTED SYSTEMS, 26(5), pp. 1228 - 1237, (2015).
[11] Josang, A., Gray, L. & Kinateder, M., "Simplification and Analysis of Transitive Trust Networks", Web Intelligence and Agent Systems Journal, 4(2), pp. 139 - 161, (2006).
[12] Kaur, J., Sandeep, S. G. & Balwinder, S. D., "Secure Trust Based Key Management Routing Framework for Wireless Sensor Networks", Journal of Engineering, pp. 1-9, (2016).
[13] Latha, D. & Palanivel, K., "Secure Routing Through Trusted Nodes in Wirels Sensor Networks – A Survey", Advanced Research in Computer Engineering & Technology (IJARCET), 3(11), pp. 3792-3799, (2014). [14] Lewis, N., Foukia, N. & G. Govan, D., "Using trust for
key distribution and route selection in Wireless Sensor Networks", Salvador, Bahia, s.n, (2008).
[15] McKnight, D. H. & Chervany, N. L., "The Meanings of Trust", s.l.: University of Minnesota, Management Information Systems Reseach Center, (1996).
[16] Olmedilla, D., Rana, O. F., Matthews, B. & Nejdl, W., "Security and Trust Issues in Semantic Grids", Dagstuhl, Germany, Internationales Begegnungs- und Forschungszentrum Informatik (IBFI), (2006).
[17] Raza, S., Haider, W. & Durrani, N. M., "Trust Based Energy Preserving Routing Protocol in Multi-hop WSN. In: Networked Systems", s.l.:Springer International Publishing, pp. 518-523, (2015).
[18] Salehi, M., Boukerche, A. & Darehshoorzadeh, A., "Towards a novel trust-based opportunistic routing protocol for wireless networks", Wireless Netw, 22(3), p. 927–943, (2016).
[19] Vasudha, N. & Gajkumar Shah, P., "Requisite Trust Based Routing Protocol for WSN", International Journal of Innovative Research in Advanced Engineering (IJIRAE), 01(05), pp. 138-142, (2014).
[20] Zahariadis, T. et al., "Implementing a Trust-Aware Routing Protocol in Wireless Sensor Nodes", London, s.n, (2010).