Experimental Analysis of the Deviation from Circularity of
Bored Hole Based on the Taguchi Method
Ihsan Korkut1,* - Yilmaz Kucuk2 1
Department of Mechanical Education, Faculty of Technology, Gazi University, Turkey 2
Department of Mechanical Engineering, Engineering Faculty, Bartin University, Turkey
In this study, the effects of cutting parameters, boring tool material and the overhang ratio of boring tool (tool clamping length) on the deviation from circularity of a bored hole were examined experimentally. The optimal cutting condition can be estimated by the analysis of the signal to noise (S/N) ratio in Taguchi method. The individual contributions of each factor on the deviation from circularity were calculated by using the Analysis of Variance (ANOVA). Therefore, at the determined condition, it could be observed whether a factor is significant or not. Also, it was observed that the values of deviation from circularity increased significantly with an increase in the effective tool length at the lower depth of cut values. In addition, the circularity could be improved with increasing the depth of cut values for the same tool clamping lengths.
©2010 Journal of Mechanical Engineering. All rights reserved.
Keywords: boring, machining, experimentation, optimization, Taguchi method, analyze
0 INTRODUCTION
The boring process has to ensure precise application condition due to the close dimensional tolerances and the need for a good surface finish. Due to the geometrical constraints of the hole surface, the boring bar should be long and slender, so it is easily subjected to static and dynamic deflections [1]. The boring process enlarges the diameter of previously drilled holes and this application should ensure some qualities for bored hole surface i.e., the straightness, parallelism, positional accuracy, size control, surface finish. In addition, the improved accuracy of the dimensions and the tolerance of holes, the elimination of any possible eccentricity is another significant requirement. The cutting forces are closely related to the chip geometry, which is determined by the cutting insert, tool geometry and feed rate. The cutting forces can cause tool/workpiece deflection and weak damping in the turning process [2]. However, the instability and/or uncontrolled cutting forces have detrimental effects on machining applications. Several researchers have tried to predict the cutting force and stability of boring process [3] to [7]. Subramani et al. studied on simple geometric relations for chip load calculations of boring tools [3]. Kuster concentrated on regenerative chatter analysis in the cutting dynamics [4]. Jayaram et
predicting chatter stability in boring operations [5] and [6]. Atabey et al. investigated the cutting coefficients of the combination of the tool and workpiece for boring process [7]. Grum and Kisin [8] examined the influence of microstructure in terms of workpiece material and the cutting force in turning and in another study, they investigated the cutting force amplitude using the three Al-Si alloys during fine turning [9]. Understanding effects of the cutting forces on the tool deflections is related to the analytical solving for machining process. The oblique boring forces (OBFs) at the front end of the boring tool creates torsion and bending moments during the boring process in such a way that the moments create deflection on the boring bar. The three force components i.e.,
cause worse surface hole quality. Hence, the cutting vibrations which occur during boring should be controlled and minimized to eliminate dimensional deviations of the bored hole. The main types of cutting vibrations can be classified as the self-excited vibration and the forced vibration [12]. The self-excited vibrations are the most important type of vibration in the machining processes [13]. The surface quality of the bored hole, including the desired dimensional accuracy, is dependent on selecting the appropriate boring process conditions [14]. Changing the cutting forces leads to cutting vibrations and for the reason that the tool deflection is inevitable. The entering angle and the tool nose radius are also significant factors which should be suitable to the boring operation. The insert radius value of the tool should be smaller than the depth of cut value. Furthermore, higher values of the insert radius are not suitable for the boring operation as this increases the radial forces and the deflection of the tool nose. Varying tool deflections induce the variations at the depth of cut values and therefore, the cylindricity of the bored hole can not be obtained in the desired quality.
In this paper, it was assumed that obtaining good hole quality in terms of cylindricity was related to the selection of effective tool length (tool clamping length) and the tool material factors in addition to the optimum cutting parameters. Thus, the values of the deviation from circularity of the bored hole were measured and analyzed to evaluate the individual effects of the test factors. To reduce the time and cost of experiments, the experimental design technique is common practice. Taguchi developed a methodology for the application of designed experiments, including a practitioner’s handbook [15]. Taguchi’s methodology took the design of experiments from the exclusive world of the statistician and brought it more fully into the world of manufacturing [16]. By means of the Taguchi method, an alternative approach is used to determine the desired cutting conditions [17] and [18].
1MATERIALS AND METHODS
1.1 Test Samples and Equipment
In this study, AISI 1040 steel was selected as workpiece material due to its widespread use in the manufacturing industry. The chemical composition of the material is given in Table 1. All of the cutting tests were carried out in dry cutting conditions. According to Taguchi’s
method, the L27 standard orthogonal array (OA)
was selected for five factors with three levels. As
L27 standard OA has 27 rows, twenty seven test
samples were prepared in cylindrical form, 60 mm in length and 60 mm in diameter. The prepared test materials were bored to 36 mm internal diameter throughout all along.
The tests were carried out on a Takisawa EX 106 CNC lathe. Uncoated cemented carbide inserts with the geometry of TCMT 110304-PM 4225 were used. The nose radius of the insert was 0.4 mm. The insert was fixed on a head with a code 570-STFCR-25-11-B1. This head could be easily fixed on the boring bar. The selected boring bar diameter was 25 mm. The minimum process diameter of the tool head was 32 mm. The boring tool bar, the head and the inserts were produced by Sandvik Coromant Co. The entering angles recommended for internal turning were between 75 and 90°. According to the accessibility of the hole profile, the most suitable entering angle should be selected. In this study, the entering angle was selected at 90°.
A new insert was used for each of the trial combinations to prevent the negative effects of insert wear. For each sample, the beginning and ending hole diameters were measured and recorded by Mitutoyo QM- 3D measuring device in laboratory conditions. Thus, the deviation values from the circularity of bored holes were determined. The results were calculated and evaluated by using the Taguchi module in demo version of the Minitab statistical analysis program.
Table 1. Chemical composition of the workpiece material (AISI 1040) (% weight)
1.2 Selection of the Test Factors and their Levels
The selection of cutting parameters is a significant factor in order to obtain a high cutting performance. An experimental design must satisfy two objectives. Firstly, the number of trials must be determined. Secondly, the conditions for each trial must be specified. The test factors and their levels should be determined before achieving these objectives [19]. For this study, five factors with three levels i.e., the effective tool length (L/D ratio), the tool material and the cutting parameters (cutting speed, feed rate and depth of cut) were selected. The levels of tool material were selected as steel boring bar, cemented carbide boring bar and anti-vibration boring bar from the 1st level to the 3rd level, respectively. The levels of tool overhang ratio (L/D ratio) were determined as 3, 5 and 7. The factors selected for boring operations are given in Table 2.
1.3 Assigning the Factors and their Levels to the Orthogonal Array’s Columns
Standard L27 Orthogonal Array (OA)
enables the experimental design for five factors with three levels. These factors were assigned to
suitable columns in the selected L27 OA. The
combinations of the trials assigned in L27 OA and
the corresponding S/N ratios calculated in
accordance with the quality characteristic are given in Table 3.
In this study, selected test factors are called the independent factors and with no interactions among them. Thus, the interactions among the factors were not taken into consideration because of calculating the individual effect of the independent factors. Taguchi determined that the factors could be assigned in columns with random order for this kind of experimental design. The OA provides equal repetitions of the factors at each column. With the selection of the OA, examination of a small part of all the existing possibilities is possible [19]. Thus, the optimum condition can be estimated.
2 ANALYSIS OF RESULTS
The optimum condition is identified by
The main effects indicate the general trend of the influence of the factors. The knowledge of the contribution of individual factors iskey in deciding the nature of the control to be established in a production process.
The ANOVA is the statistical treatment most commonly applied to the results of the experiment to determine the percent contribution of each factor. The study of the ANOVA table for a given analysis helps to determine which of the factors need control and which do not.
In the Taguchi method, the term ‘signal’ represents the desirable value (mean) for the output characteristic while the term ‘noise’ represents the undesirable value for the output
characteristic. Taguchi uses the S/N ratio to
measure the quality characteristic deviating from the desired value [15].
The aim of any experiment is always to determine the highest possible S/N ratio for the result irrespective of the type of the quality characteristics. A high value of S/N implies that the signal is much higher than the random effects of noise factors [20].
There are three categories of quality characteristics, i.e. the-smaller-the-better, the- nominal-the-better, and the-bigger-the-better.
To obtain optimal cutting performance, the-smaller-the-better quality characteristic for deviation from circularity must be taken. The S/N
ratio defined as:
) . . log( 10
/N MSD
S =− , (1)
where M.S.D. is the mean-square deviation for the output characteristic. The M.S.D for the-smaller-the-better quality characteristic can be expressed as:
n y y
y D S
M. . ( ... n )/
2 2
2 2
1 + + +
= , (2)
where y1, y2, …, yn, are the responses of quality
characteristic for a trial condition repeated n
-times.
From the Eqs. (1) and (2) the S/N ratios were calculated for the experimental results. The
S/N response table is shown in Table 4.
Regardless of the category of the quality characteristic, a greater S/N ratio corresponds to better quality characteristics.
Table 2. Test Factors and their levels
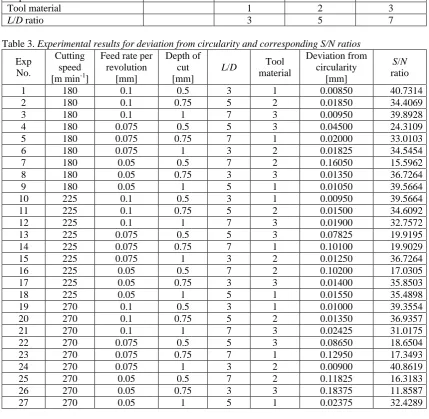
Table 3. Experimental results for deviation from circularity and corresponding S/N ratios
Exp No.
Cutting speed [m min-1]
Feed rate per revolution
[mm]
Depth of cut [mm]
L/D Tool
material
Deviation from circularity
[mm]
S/N
ratio
1 180 0.1 0.5 3 1 0.00850 40.7314 2 180 0.1 0.75 5 2 0.01850 34.4069
3 180 0.1 1 7 3 0.00950 39.8928
4 180 0.075 0.5 5 3 0.04500 24.3109 5 180 0.075 0.75 7 1 0.02000 33.0103 6 180 0.075 1 3 2 0.01825 34.5454 7 180 0.05 0.5 7 2 0.16050 15.5962 8 180 0.05 0.75 3 3 0.01350 36.7264 9 180 0.05 1 5 1 0.01050 39.5664
10 225 0.1 0.5 3 1 0.00950 39.5664
11 225 0.1 0.75 5 2 0.01500 34.6092
12 225 0.1 1 7 3 0.01900 32.7572
13 225 0.075 0.5 5 3 0.07825 19.9195 14 225 0.075 0.75 7 1 0.10100 19.9029 15 225 0.075 1 3 2 0.01250 36.7264 16 225 0.05 0.5 7 2 0.10200 17.0305 17 225 0.05 0.75 3 3 0.01400 35.8503
18 225 0.05 1 5 1 0.01550 35.4898
19 270 0.1 0.5 3 1 0.01000 39.3554
20 270 0.1 0.75 5 2 0.01350 36.9357
21 270 0.1 1 7 3 0.02425 31.0175
22 270 0.075 0.5 5 3 0.08650 18.6504 23 270 0.075 0.75 7 1 0.12950 17.3493 24 270 0.075 1 3 2 0.00900 40.8619 25 270 0.05 0.5 7 2 0.11825 16.3183 26 270 0.05 0.75 3 3 0.18375 11.8587
27 270 0.05 1 5 1 0.02375 32.4289
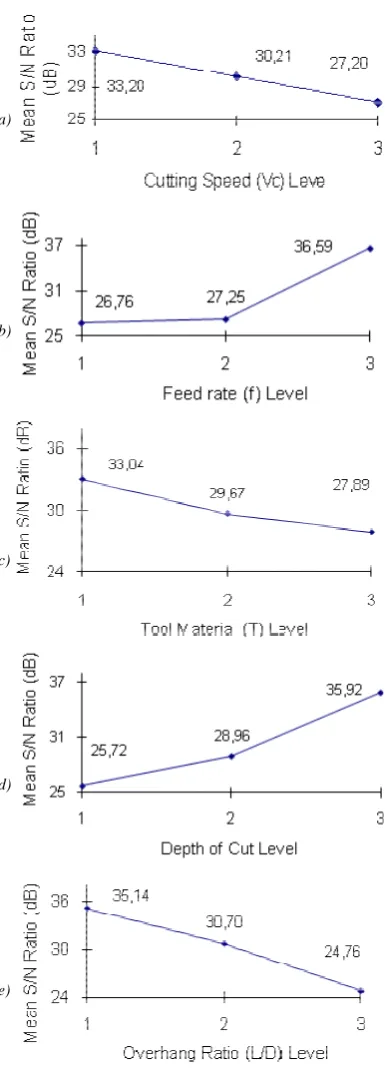
Table 4.S/N response table for deviation from circularity
Symbol Factor Mean S/N ratio (dB)
Level 1 Level 2 Level 3 Max-Min
Vc Cutting speed 33.2 30.21 27.2 6
fn Feed rate 26.76 27.25 36.59 9.83
ap Depth of cut 25.72 28.96 35.92 10.2
L/D Overhang ratio 35.14 30.7 24.76 10.38
T Tool material 33.04 29.67 27.89 5.15
Cutting parameters Unit Level 1 Level 2 Level 3
Cutting speed m min-1 180 225 270
Feed rate per revolution mm 0.1 0.075 0.05
Depth of cut mm 0.5 0.75 1
Tool material 1 2 3
a)
b)
c)
d)
e)
Fig. 1. The optimum levels of the test factors a) cutting speed, b) feed rate, c) tool material,
d) depth of cut, e) overhang ratio
Since the highest value of the mean S/N
level, the optimum test combination was
determined as the 1st level for the cutting speed
(Vc), the 3rd level for the feed rate per revolution (fn), the 3rd level for the depth of cut (ap), the 1st level for the overhang ratio (L/D) and the 1st level for the tool material (T).
Individual contribution of each factor can be determined by means of the ANOVA calculation. The results of ANOVA for the deviation from circularity criteria are given in Table 5. Table 5 shows that the feed rate (23.92%), the depth of cut (21.21%) and the tool overhang ratio (21.15%) are the significant factors for the deviation from circularity criteria in the boring operation. The cutting speed and the tool material factors are of a lesser importance than the others.
2.1Confirmation Test
Once the optimal level of the process parameters is selected in accordance with the calculated S/N ratios for each factor, the final step is to predict and verify the improvement of the performance characteristic using the optimal level of the process parameters.
The estimated S/N ratio ηe using the optimal level of the process parameters can be calculated from Eq. (3) [3].
) (
1
m q
i i m
e η η η
η = +
∑
−=
, (3)
where ηm is the total mean of the S/N ratio, ηi, is the mean S/N ratio at the optimal level, and q is the number of the process parameters that significantly affect the performance characteristics.
Table 5 shows the results of the confirmation test using the optimal cutting parameters for deviation from circularity.
A good agreement between the predicted machining performance and the actual machining performance were determined, which is shown Table 6.
An increase in the S/N ratio, which is
between the initial and optimal cutting parameters, is 16.04 dB. Based on the result of the confirmation test, it has been observed that the deviation from circularity could decrease by 6.33 times.
3 CONCLUSIONS
The following conclusions can be drawn from this study:
• The experimental results demonstrate that
the three factors i.e., feed rate, the depth of cut and the tool overhang ratio are the main parameters among the five controllable factors (the cutting speed, the feed rate, the depth of cut, the tool overhang ratio and the tool material) affecting the deviation from the circularity of the bored hole in internal turning of the AISI 1040 steel.
• The confirmation tests were conducted to
verify the optimal cutting parameters. The contribution values of the feed rate, the depth of cut and the tool overhang ratio were found as 23.92%, 21.21% and 21.15%, respectively.
• In the boring operation, for specific test
combinations, it can be recommended that the 1st level of feed rate (0.05 mm/rev), the
3rd level of depth of cut (1 mm) and
minimum tool clamping length (L/D=3)
ensure the best result.
• The best condition regarding the deviation
from circularity of the bored hole can be obtained from the determined optimum combination and improved about 6.33-times.
This research shows that the Taguchi’s parameter design for optimizing machining performance provides an important advantage regarding minimum cost and time for the industrial readers.
4 REFERENCES
[1] Yussefian, N.Z., Moetakef-Imani, B., El-Mounayri, H. (2008). The prediction of cutting force for boring process. International Journal of Machine Tools & Manufacture, vol. 48, p. 1387-1394.
[2] Arnold, R.N. (1946). The mechanism of tool
vibration in cutting of steel. Proceedings of
the Institution of Mechanical Engineers, vol. 154, p. 261.
[3] Subramani, G., Suvada, R., Kapoor, S. G., DeVor, R.G., Meingast, W. (1987). A model for the prediction of force system for cylinder
boring process. Proceedings of the XV
NAMRC, p. 439-446.
[4] Kuster, F. (1990). Cutting dynamics and stability of boring bars. Annals of CIRP, vol. 39, no. 1, p. 361-366.
[5] Jayaram, S., Iyer, M. (2000). An analytical model for prediction of chatter stability in
boring. Transactions of the of NAMRI/SME
2000, vol. 28, p. 203-208.
Table 5. Results of ANOVA for deviation from circularity
Symbol Factor Degrees of
freedom
Sum of square
Mean square (Variance)
F (Variance Ratio)
Contribution (%)
Vc Cutting speed 2 162.1 81.03 2.64 7.03
fn Feed rate 2 551.5 275.75 8.98 23.92
ap Depth of cut 2 489 244.5 7.96 21.21
L/D Overhang ratio 2 487.5 243.74 7.93 21.15
T Tool material 2 123.5 61.75 2.01 5.35
Error 16 491.6 30.02 21.32
Total 26 2305.1
Table 6. Results of the confirmation test for deviation from circularity
Initial parameters Optimal parameters
Prediction Experiment
Level A2B2C2D2E2 A1B3C3D1E1 A1B3C3D1E1
Deviation from circularity (mm) 0.019 0.002 0.003
S/N ratio (dB) 34.41 53.09 50.45
[6] Budak, E., Ozlu, E. (2007). Analytical modeling of chatter stability in turning and boring operations: Part II experimental
verification. Journal of Manufacturing
Science and Engineering, vol. 129, p. 733-739.
[7] Atabey, F., Lazoglu, I., Altintas, Y. (2003). Mechanics of boring processes. Part I.
International Journal of Machine Tools and Manufacture, vol. 43, p. 463-476. [8] Grum, J., Kisin, M. (2003). Influence of
the microstructure on surface integrity in turning - Part II The influence of a microstructure of the workpiece material on cutting forces. International Journal of Machine Tools and Manufacture, vol. 43, no. 15, p. 1545-1551.
[9] Grum, J., Kisin, M. (2006). The influence of the microstructure of three Al-Si alloys on cutting force amplitude during fine
turning. International Journal of Machine
and Manufacture, vol. 46, no. 7-8, p. 769-781.
[10] Mendi, F. (1996). Machine tools; Theory and calculations (in Turkish); 72 TDFO Ltd. Sti.: Ankara.
[11] Nagano, S.T., Koizumi, T., Fujii, T., Tsujiuchi, N., Ueda, H., Steel, K. (1997). Development of a composite boring bar.
Composite Structures, vol. 38, p. 531–539.
[12] Moradi, H., Bakhtiari-Nejad, F.,
Movahhedy, M.R. (2008). Tunable vibration absorber design to suppress vibrations: An application in boring
manufacturing process. Journal of Sound
and Vibration, vol. 318, p. 93-108.
[13] Merrit, H.E. (1965). Theory of self-excited machine-tool chatter: contribution to machine-tool chatter research-1. Transactions of ASME - Journal of Engineering for Industry B87, no. 4, p. 447-454.
[14] Taskesen, A., Mendi, F., Kisioglu, Y.,
Kulekci, M.K. (2006). Deformation analysis of boring bars using analytical and finite
element approaches. Strojniški vestnik -
Journal of Mechanical Engineering, vol. 52, no. 3, p. 161-169.
[15] Taguchi, G. (1990). Introduction to quality
engineering, Asian Productivity Organization, Tokyo.
[16] Nalbant, M., Gökkaya, H., Sur, G. (2007). Application of Taguchi method in the optimization of cutting parameters for surface
roughness in turning. Materials and Design,
vol. 28, p. 1379-1385.
[17] Abuelnaga, A.M., El-Dardiry, M.A. (1984). Optimization methods for metal cutting. Int J Mach Tool Design Res, vol. 24, no. 1, p. 11-18.
[18] Chua, M.S., Rahman, M., Wong, Y.S., Loh, H.T. (1993). Determination of optimal cutting conditions using design of experiments and
optimization techniques. Int J Mach Tools
Manuf, vol. 33, no. 2, p. 297-305.
[19] Roy, R.K. (1990). A primer on the Taguchi
method, Van Nostrand Reinhold, New York, p. 1-28, 40-155, 211.
[20] Singh, H., Kumar, P. (2005). Optimizing cutting force for turned parts by Taguchi’s
parameter design approach. Indian J