DOI: 10.7508/pj.2017.02. 011
Print ISSN: 2383-451X Online ISSN: 2383-4501 Web Page: https://jpoll.ut.ac.ir, Email: [email protected]
Evaluation of the status of heavy metal pollution in surface water
and sediments of the Nil River (
North Eastern Algeria)
Krika, A.1* and Krika, F.2
1.Department of Environmental Sciences and Agronomic Sciences, Faculty of Nature Life and Sciences, University of Jijel BP 98 Ouled Aissa, Jijel 18000, Algeria
2. Department of Process Engineering, Faculty of Technology, University of Laghouat, BP 37G, Laghouat 03000, Algeria
Received: 6 Nov. 2016 Accepted: 4 Dec. 2016
ABSTRACT: Water and sediment samples were collected from six different stations, located along the Nil River between February and June 2015. Concentrations of cadmium, lead, zinc, and copper were determined. The extent of the sediment pollution was assessed, using the multiple pollution indices, namely contamination factor (CF), pollution load index (PLI), and the geoaccumulation index (Igeo). The results showed that the level of metals in water samples exceeded background concentrations for Cd and Pb, and the average values for those elements were higher than those of Zn and Cu, ranked as the following: Pb (0.58)> Zn (0.38)> Cd (0.32)> Cu (0.061). For sedimentary samples, the results showed that Zn and Pb concentrations were greater than the concentrations of Cu and Cd, exceeding the background values (except for Cu). The concentration of the tested heavy metals decreased to the following order: Zn (96.2)> Pb (61.5)> Cu (38.83)> Cd (2.34). The Igeo values revealed that Cd (2.87) and Pb (1.61) had accumulated significantly in the Nil River. Contamination factor (CF) confirmed that the sedimentary samples were moderate to very high in terms of Cd, Pb, and Zn contamination. The Pollution Load Index (PLI) values were above one (>1), indicating an advanced decline of the sediment quality. Also, the results showed that the stations, located at the middle portion of the river (S3, S4, and S5) have higher levels of metals than the other stations (S1, S2, and S6). The assessment of heavy metals' levels in water and sedimentary samples indicated that river water and the sediments in the study area were strongly impacted by agricultural activities and domestic waste water.
Keywords: Algeria, heavy metals, Nil River, sediments, water.
INTRODUCTION
Today, river and sedimentary contamination with different pollutants presents a complicated, long-term environmental problem, particularly in areas with high anthropogenic pressure (Ferati et al., 2015; Islam et al., 2016). Heavy metals are among
Corresponding Author, E-mail: [email protected];
Tel:+213 662081901
some level of exposure and absorption. Under certain environmental conditions, heavy metals may accumulate to form a toxic concentration, causing ecological damage (Ramos et al.,1999; Segura et al., 2006; Du Laing et al., 2008). Heavy metals, which may result from chemical leaching of bedrock, water drainage, runoff from banks, and the discharge of urban, industrial, and rural agricultural wastewaters are widely present in rivers, serving as important indicators of water environmental quality (Gupta et al., 1996; Bai et al., 2012).
Usually, concentrations of heavy metals in aquatic ecosystem are determined by measuring their concentration in water and sediments (Camusso et al., 1995) that generally exist at low levels in water and attain a considerable concentration in the sediments (Namminga & Wilhm, 1976).
The geoaccumulationindex (Igeo), contamination factor (CF), and Pollution Load Index (PLI) are among different statistical indexes that can be used to determine the source and magnitude of metal pollution. These pollution indices methods have been widely utilized in river and marine sediments (Muller, 1969; Bryan & Langston, 1992; Buccolieri et al., 2006; Vaezi et al., 2016).
Nil River is known as an important water source which is not only limited to supply water to the consumers but is also used for other purposes such as recreation, fishing, effluent discharge, and irrigation. Recently, the river was exposed to different pollution problems such as industrial effluent, domestic sewage, and agriculture activities.
The current work aims to (i) determine the levels and distribution of the toxic heavy metals in Nil River's water and sediment; (ii) explore the degree of contamination and pollution impacts by using the following pollution indicators, including contamination factor (CF), pollution load index (PLI), and geo-accumulation index (Igeo); and (iii) establish baseline data on the present status
of the river that can be used by relevant authorities as well as other researchers. MATERIALS AND METHODS Study area
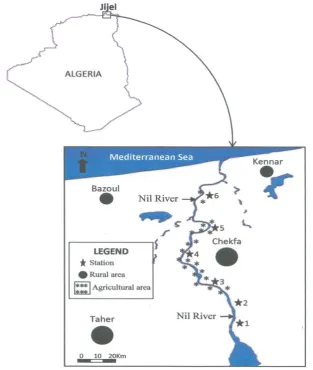
Nil River is one of the longest rivers in Jijel district, 120 km long with a total watershed area of 303 km2. The study area lies within a longitude of 5°56'14.32′′E and latitude of 36°49'40.04"N (Fig. 1). People, living on the bank of this river, use its water for agricultural and other purposes, such as bathing their cattle, washing their cloth, etc. Once used, water is generally discharged into the river from agricultural and sewage systems. In fact, the water quality of the river has considerably deteriorated as a result of such human activities. The climate in the study area is of Mediterranean type with dry warm summers and wet winters. During the winter months (November-February), there is an 80% of precipitation. The average temperature is 09°C in January and 28°C in July.
This region is characterized by a few natural lakes and swamps, the most notable examples of which are located downstrea: Ghedir Beni Hamza in the north-east and Ghedir el Merdj in the north-west (Boufekane & Saighi, 2013).
Pollution evaluation indices
Three indices of geo-accumulation index (Igeo), contamination factor (CF), and Pollution load index (PLI) were used to gain information about the sources of metal pollutants and to assess the metal pollution status.
Geoaccumulation index (Igeo)
According to Müller (1981),
geoaccumulation index (Igeo) for metals was determined using the following equation:
geo 2
I
1.5
n
n
log B
concentration of the metal (n). Factor 1.5 is the background matrix correction factor due to lithogenic effects. The crustal abundance data of Krauskopf and Bird (1995) were used as background data.
The geoaccumulation index consists of seven grades or classes (Table 1).
Contamination Factor (CF)
The contamination factor (CF) of a single trace element was calculated, as suggested by Min et al. (2013) and Kerolli-Mustafa et al. (2015). It was used to evaluate the contamination of the single heavy metal in our samples.
Fig. 1. Location of different sampling sites along Nil River
Table 1. Descriptive classes for Igeo values (Müller, 1981)
Sediment quality Igeo IgeoClass
Unpolluted Igeo<0 0
Unpolluted to moderately polluted 0< Igeo≤1 1
Moderately polluted 1< Igeo≤2 2
Moderately to heavily polluted 2< Igeo≤3 3
Heavily polluted 3< Igeo≤4 4
Heavily to extremely polluted 4< Igeo≤5 5
The formula to calculate contamination factor (CF), used to evaluate the pollution of the single heavy metal in our sediment samples, is:
CF i sample i reference C
C
where CF is the contamination factor for a heavy metal;Csamplei , the measured value of the heavy metal in the sediment; and i
reference
C ,
the calculation parameter.
The contamination levels were classified based on their intensities on a scale, ranging from 1 to 6, as shown in Table 2 (Hakanson, 1980).
Table 2. Sediment contamination levels, based on contamination factor (CF) value (Hakanson, 1980)
Contamination factor level CF value
Low Contamination CF<1
Moderate Contamination 1< CF≤3 Considerable Contamination 3< CF≤6 Very High Contamination CF >6
Pollution Load Index (PLI)
The PLI was originally proposed by Tomlinson et al. (1980) to determine the pollution load of the sediments. It can also give a simple and relative means for the evaluation of metal pollution degree (Tomlinson et al., 1980). This parameter is expressed as:
PLI n 1 2 3 .
Cf Cf Cf Cfn
where n is the number of metals and Cf is the contamination factor. The pollution load index can be classified as no pollution (PLI< 1), moderate pollution (1< PLI< 2), heavy pollution (2< PLI< 3), and extremely heavy pollution (3< PLI) (Tomlinson et al., 1980).
Water and sediment sampling
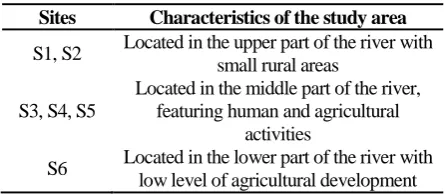
Water and sediment samples were collected from six sites, namely S1 to S6, used by the local people for domestic and agricultural purposes. Table 3 gives the characteristics of the sampling stations. All samples were collected during the period
from February to June 2015 in three replicates in each sampling sites.
Table 3. Characteristics of sampling stations at NiL River basin
Sites Characteristics of the study area
S1, S2 Located in the upper part of the river with small rural areas
S3, S4, S5
Located in the middle part of the river, featuring human and agricultural
activities
S6 Located in the lower part of the river with low level of agricultural development
All water samples were obtained using cleaned polyethylene bottles, which were washed with hydrochloric acid and then rinsed with distilled water. Subsequently, water samples were filtered through 0.45 μm millipore filters, acidified to pH<2 with 2 ml HCl (6N) and transported to the laboratory for analysis (APHA, 1998).
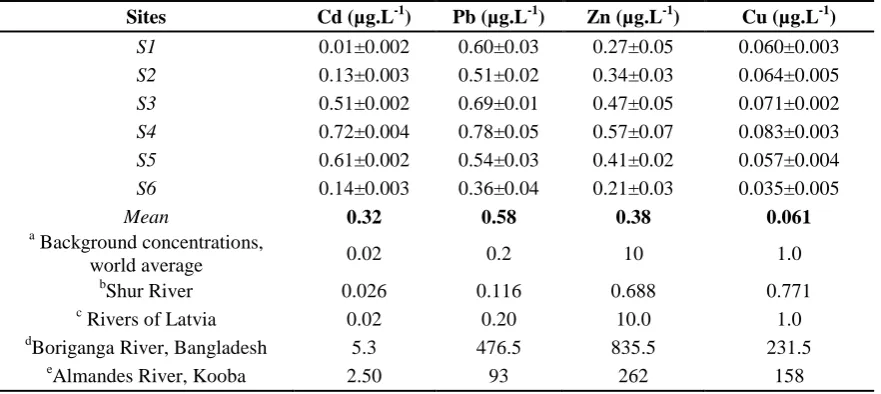
Table 4. Mean concentration of metals in the Nil River water compared to Background concentrations and selected rivers in the world
Sites Cd (µg.L-1) Pb (µg.L-1) Zn (µg.L-1) Cu (µg.L-1)
S1 0.01±0.002 0.60±0.03 0.27±0.05 0.060±0.003
S2 0.13±0.003 0.51±0.02 0.34±0.03 0.064±0.005
S3 0.51±0.002 0.69±0.01 0.47±0.05 0.071±0.002
S4 0.72±0.004 0.78±0.05 0.57±0.07 0.083±0.003
S5 0.61±0.002 0.54±0.03 0.41±0.02 0.057±0.004
S6 0.14±0.003 0.36±0.04 0.21±0.03 0.035±0.005
Mean 0.32 0.58 0.38 0.061
a Background concentrations,
world average 0.02 0.2 10 1.0
b
Shur River 0.026 0.116 0.688 0.771
c Rivers of Latvia 0.02 0.20 10.0 1.0
dBoriganga River, Bangladesh 5.3 476.5 835.5 231.5
eAlmandes River, Kooba 2.50 93 262 158
a
Klavins et al. (2000),
b
Karbassi et al. (2008)
c
Wang et al. (2011)
dMohiuddin et al. (2011) e
Olivares-Rieumont et al. (2005)
Results showed that the concentrations of heavy metals in water fluctuate a lot, with the mean concentration of these metals decreasing in the following order: Pb> Zn> Cd> Cu.
Generally, the highest mean
concentrations of Cd, Pb, Zn, and Cu in water appeared at sites S3, S4, and S5, while the lowest mean concentrations belonged to sites S1, S2, and S6. Discharge of sewage and poultry waste- largely in an untreated form- may be the most likely causes of elevated levels of these metals in water (Tao et al., 2012; Kansal et al., 2013).
To better understand the status of heavy metals in the study area, these pollutants' concentrations were compared with those reported in other rivers of the world (Table 4). The mean concentrations of Cd and Pb were higher than Shur River (Karbassi et al., 2008) and Rivers of Latvia (Wang et al., 2011), but lower than Boriganga River (Mohiuddin et al., 2011) and Almandes River (Olivares-Rieumont et al., 2005). The concentrations of Zn and Cu were
below that of Shur, Rivers of Latvia Boriganga, and Almandes Rivers.
In order to assess the potential hazardous impacts, the heavy metal levels in water were compared with Background concentrations (Klavins et al., 2000) (Table 4), with this comparison indicating that Cd and Pb may be the major pollutants in our case, thus more attention should be paid to these heavy metals, since they may have main impacts on the river sediments and, in turn, on organisms and humans.
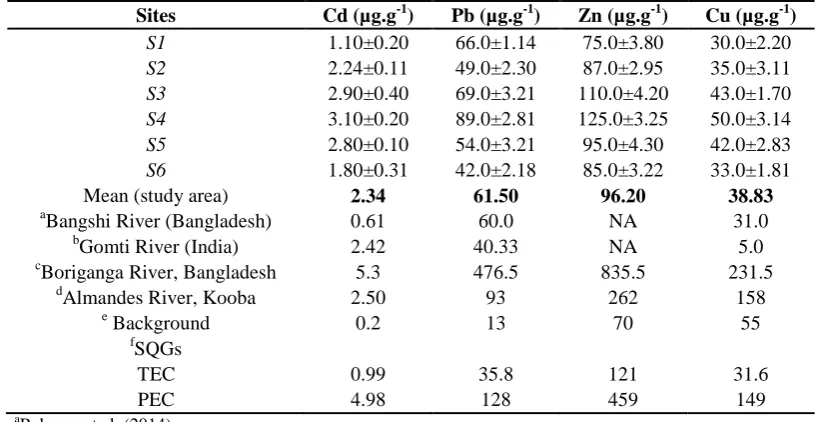
Heavy metal concentration in sediment Table 5 shows the mean contents of the total Cd, Pb, Zn, and Cu in surface sediments along Nil River.
According to Table 5, the mean concentrations of Cd, Pb, and Zn in river sediments greatly exceed the background levels (except for Cu). Generally, Zn showed the highest mean level, followed by Pb, Cu, and Cd.
Table 5. Mean concentrations of metals in the Nil River, compared to background values, selected rivers in the world and sediment quality guidelines (SQGs)
Sites Cd (µg.g-1) Pb (µg.g-1) Zn (µg.g-1) Cu (µg.g-1)
S1 1.10±0.20 66.0±1.14 75.0±3.80 30.0±2.20
S2 2.24±0.11 49.0±2.30 87.0±2.95 35.0±3.11
S3 2.90±0.40 69.0±3.21 110.0±4.20 43.0±1.70
S4 3.10±0.20 89.0±2.81 125.0±3.25 50.0±3.14
S5 2.80±0.10 54.0±3.21 95.0±4.30 42.0±2.83
S6 1.80±0.31 42.0±2.18 85.0±3.22 33.0±1.81
Mean (study area) 2.34 61.50 96.20 38.83
aBangshi River (Bangladesh) 0.61 60.0 NA 31.0
b
Gomti River (India) 2.42 40.33 NA 5.0
c
Boriganga River, Bangladesh 5.3 476.5 835.5 231.5
d
Almandes River, Kooba 2.50 93 262 158
e Background 0.2 13 70 55
fSQGs
TEC 0.99 35.8 121 31.6
PEC 4.98 128 459 149
a
Rahman et al. (2014)
b
Singh et al. (2005)
c
Mohiuddin et al. (2011)
d
Olivares-Rieumont et al. (2005)
e
Krauskopf and Bird (1995)
f
Sediment quality guideline (MacDonald et al., 2000)
Metal concentrations at different sampling stations varied, indicating that the spatial distribution of metal contamination is not uniform along the river. The highest concentration values of most of the elements appeared in sites S3, S4, and S5, located next to cultivated fields and the rural town of Chekfa. Thereby, pollution with these elements in the abovementioned stations could be due to agricultural disruption (use of fertilizer) and wasting domestic water in untreated form. For example, studies on fertilizers in Canada have shown that these products contain up to 3.5 mg/kg Pb (nitrogen-phosphate fertilizer) (Friberg et al., 1980). Moreover, Akpor et al. (2014) reported that Pb is the most common toxic heavy metal in waste water, forming a less mobile species that eventually precipitates on the bottom sediments (Laxen & Harrison, 1983).
There are numerous reports on metal contamination in river sediments around the world. Comparing heavy metal concentrations in Nil River (Table 5) revealed that the extent of metal pollution
for Pb and Cd in the study area was more or less similar to other rivers (Rahman et al., 2014; Singh et al., 2005). When compared to other rivers, the heavy metal concentrations of Zn and Cu were much lower in the Nil River (Mohiuddin et al., 2011; Olivares-Rieumont et al., 2005). Sediment Quality Guidelines (SQGs) A general assessment of metal pollution was conducted by comparing the determined metal contents with sediment quality guidelines (SQGs) of the US EPA. Two consensus-based values were reported for each potential contaminant: (1) the threshold effect concentration (TEC), which is the concentration below which harmful effects are unlikely to be observed; and (2) the probable effects concentration (PEC), or the concentration above which harmful effects are likely to appear (MacDonald et al., 2000).
the reference values in all sampling sites, suggesting that the concentrations of these metals are likely to cause harmful effects on the benthic fauna. In contrast, the level of heavy metals in all of the sediment samples of the Nil River were lower than the PEC.
Pollution evaluation indices
Table 6 offers the calculated Igeo of the metals in the sediments as well as their corresponding contamination intensity. On the basis of the mean values of Igeo, sediments are enriched for metals in the following order: Zn> Pb> Cu> Zn.
Table 6. Geoaccumulation indexes (Igeo). Contamination factors (CF) and pollution load indices (PLI) of the studied metals in the sediments of the study area
Sites Igeo PLI CF
Cd Pb Zn Cu Cd Pb Zn Cu
S1 1.88 1.76 -0.48 -1.46 2.25 5.5 5.07 1.07 0.54
S2 2.91 1.33 -0.27 -1.24 2.39 11.2 3.76 1.24 0.63
S3 3.28 1.82 0.07 -0.94 3.24 14.5 5.31 1.57 0.78
S4 3.38 2.19 0.25 -0.72 3.63 15.5 6.84 1.78 0.91
S5 3.23 1.47 -0.14 -0.98 2.77 14.0 4.15 1.35 0.76
S6 2.59 1.11 -0.30 -1.32 2.14 09.0 3.23 1.21 0.60
Total mean 2.87 1.61 -0.14 -1.11 2.73 11.61 4.72 1.37 0.70
Negative geo-accumulation indices revealed that the mean concentration of heavy metals in the river sediment was lower than their respective background and reference values. The calculated Igeo values for Cu were constantly below zero. Based on the classification of Igeo, the totality of the Nil sediments were uncontaminated with respect to Cu (Igeo< 0). The Igeo values for Zn, calculated in the sediments, ranged from -0.48 to 0.25. Four stations (S1, S2, S5, and S6) had negative values, while the values of the remaining stations ranged between 0.07 and 0.25, indicating the class 1 category, which reflected that sediments were unpolluted to moderately polluted with respect to Zn. The calculated Igeo values for Pb were constantly below 2, except for station (S4), which was slightly above 2. Based on the classification of Igeo, the majority of the sediment samples were moderately polluted with respect to Pb (1< Igeo< 2). In contrast, the Igeo values of Cd at sites S3, S4, and S5 were above 3, suggesting that these sites were heavily polluted. However, they were moderately polluted at site S1 and moderately to heavily polluted at sites S2 and S6, suggesting that
the surface sediments can be considered contaminated with this metal.
Both CF and PLI are widely used to evaluate the degree of heavy metal pollution in the sediments (Bhuiyan et al., 2010). Table 6 presents CF values for heavy metals, recorded at different sampling locations. The mean CF values for the metals in the study area appeared in the following sequence Cd> Pb> Zn> Cu. Results show that CF values for Cd, Pb, and Zn were above 1 (CF<1) probably due to agricultural and domestic use of water and discharge to the river without any pretreatment. However, CF value for Cu were below 1.
The values of PLI were high in all the studied samples, varying between 2.14 and 3.63, indicating heavy pollution, with regards to the sum of the studied metals (Table 6). Sekabira et al. (2010) reported that PLI> 1 indicated anthropogenic inputs. CONCLUSION
Nil River is due to the anthropogenic influences such as domestic sewage and agricultural activities. In surface water, abundance of heavy metals in water were ranked as the following: Pb> Zn> Cd> Cu. Some heavy metals (Pb and Cd) exceeded background values, indicating that the water of Nil River is polluted with these heavy metals. In case of the sediments, abundance of heavy metals were ranked as what follows: Zn> Pb> Cu> Cd. However, all metal concentrations (with the exception of Cu) exceeded background values.
The contamination factors (CFs) showed that contamination level of Cd was higher than other heavy metals in sediments, and the mean CF values for the metals in the study
area followed the sequence CFCd > CFPb >
CFZn > CFCu. The mean pollution load index
(PLI), which was within the range of 2.14-3.63, indicated heavy pollution of river sediments. The geo-accumulation index (Igeo) revealed that the pollution decreased in accordance to the following order: Cd> Pb> Zn> Cu, with Cd causing the most pollution and Zn and Cu, having nearly no pollution in river sediments.
In order to protect the water and sediment from further contamination, it is recommended to design a monitoring network and reduce the anthropogenic discharges. REFERENCES
Adaikpoh, E.O., Nwajei, G.E. and Ogala, J.E. (2005). Heavy metals concentrations in coal and sediments from River Ekulu in Enugu, Coal City of Nigeria. J. App. Sci. Environ. Manag., 9(3), 5-8.
Akoto, O., Bruce, T.N. and Darko, G. (2008). Heavy metals pollution profiles in streams serving the Owabi reservoir. African J. Environ. Sci. Tech., 2(11), 354-359.
Akpor, O.B., Ohiobor, G.O. and Olaolu, T.D. (2014). Heavy metal pollutants in wastewater effluents: sources, effects and remediation. Adv. Biosci. Bioeng., 2(4): 37-43.
APHA (1998). Standard methods for examination of water and waste water (20th. Ed.). Washington DC: American Public Health Association.
Bai, J.H., Xiao, R., Zhang, KJ. and Gao, H.F.
(2012). Arsenic and heavy metal pollution in wetland soils from tidal freshwater and salt marshes before and after the flow-sediment regulation regime in the Yellow River Delta China. J. Hydrol., 450-451, 244-253.
Bai, J., Cui, B., Chen, B., Zhang, K., Deng, W., Gao, H. and Xiao, R. (2011). Spatial distribution and ecological risk assessment of heavy metals in surface sediments from a typical plateau lake wetland, China. Ecol. Model., 222(2), 301-306.
Bhuiyan, M.A.H., Islam, M.A., Dampare, S.B., Parvez, L. and Suzuki, S. (2010). Evaluation of hazardous metal pollution in irrigation and drinking water systems in the vicinity of a coal mine area of north western Bangladesh. J. Hazard. Mater., 179, 1065-1077.
Boufekane, A. and Saighi, O. (2013). Assessment of groundwater pollution by nitrates using intrinsic vulnerability methods: A case study of the Nil valley groundwater (Jijel, North-East Algeria). Afr. J. Environ. Sci. Technol., 7(10), 949-960.
Bryan, G.W. and Langston, W.J. (1992). Bioavailability, accumulation and effects of heavy metals in sediments with special reference to United Kingdom estuaries: a review. Environ. Pollut., 76, 89-131.
Buccolieri, A., Buccolieri, G., Cardellicchio, N., Atti, A.D., Leo, A.D. and Maci, A. (2006). United States Heavy metals in marine sediments of Taranto Gulf (Ionian Sea, Southern Italy). Mar. Chem., 99, 227-235.
Camusso., M., Vigano, L. and Baitstrini, R. (1995). Bioaccumulation of heavy metals in rainbow trout. Ecotox. Environ. Safe., 31, 133-141.
Du Laing, G., Moortel, A.V.D., Lesage, E., Tack, F.M.G. and Verloo, M.G. (2008). Chapter 11: factors affecting metal accumulation, mobility and availability in intertidal wetlands of the Scheldt Estuary (Belgium). In: Vymazal J (ed) Wastewater treatment, plant dynamics and management. Springer Science ? Business Media B.V, Netherlands, 121-133.
Esmaeilzadeh, M., Karbassi A. and Moattar F. (2016). Assessment of metal pollution in the Anzali Wetland sediments using chemical partitioning method and pollution indices. Acta. Oceanol. Sin., 35(10), 28-36.
Friberg, U., Norlberg, G.E. and Youk, V.B. (1980). -Handbook ou the toxicology of metals, Elsevier, North Holland, Amsterdam, 2ed, 709p.
Gupta, S.K, Vollmer, M.K. and Krebs, R. (1996). The importance of mobile, mobilisable and pseudo total heavy metal fractions in soil for three-level risk assessment and risk management. Sci. Total. Environ., 178, 11-20.
Hakanson, L. (1980). Ecological risk index for aquatic pollution control, a sedimentological approach. Water. Res., 14(8), 975-1001.
Islam, S.M.D., Bhuiyan, M.A.H., Rume, T. and Mohinuzzaman, M. (2016). Assessing Heavy Metal Contamination in the Bottom Sediments of Shitalakhya River, Bangladesh; Using Pollution Evaluation Indices and Geo-spatial Analysis. Pollution., 2(3), 299-312.
Kansal, A., Siddiqui, N.A. and Gautam, A. (2013). Assessment of heavy metals and their interrelationships with some physicochemical parameters in eco-efficient rivers of Himalayan region. Environ. Monit. Assess., 185, 2553-2563.
Karbassi A., Monavari, S., Bidhendi, G.R.N., Nouri, J. and Nematpour, K. (2008). Metal pollution assessment of sediment and water in the Shur River. Environ. Monit. Assess., 147, 107-16.
Kerolli-Mustafa, M., Fajković, H., Rončević, S. and Ćurković, L. (2015). Assessment of metals risks from different depths of jarosite tailing waste of Trepça Zinc Industry, Kosovo based on BCR procedure. J. Geochem. Explor., 148, 161-168.
Klavins, M., Briede, A., Rodinov, V., Kokorite, I., Parele, E. and Kļaviņa, I. (2000). Heavy metals in rivers of Latvia. Sci. Total. Environ., 262(1-2), 175-183.
Krauskopf, K.B. and Bird, D.K. (1995). Introduction to Geochemistry, 3rd ed., WCB McGraw-Hill, Boston, MA.
Laxen, D.P. and Harrison, R.M. (1983). Physico-chemical speciation of selected metals in the treated effluent of a lead-acid battery manufacturer and in the receiving river. Water. Res., 17(1), 71-80.
MacDonald, D.D., Ingersoll, C.G. and Berger, T.A. (2000). Development and evaluation of consensus-based sediment quality guidelines for freshwater ecosystems. Arch. Environ. Contam. Toxicol., 39, 20-31.
Min, X., Xie, X., Chai, L., Liang, Y., Li, M. and Ke, Y. (2013). Environmental availability and ecological risk assessment of heavy metals in zinc leaching residue. Trans. Nonferrous. Met. Soc. China., 23, 208-218.
Mohiuddin, K.M., Ogawa, Y., Zakir, H.M., Otomo, K. and Shikazono, N. (2011). Heavy metals contamination in water and sediments of an urban river in a developing country. Int. J. Environ. Sci. Technol., 8(4), 723-736.
Müller, G. (1981). Die Schwermetallbelstung der sedimente des Neckars und seiner Nebenflusse: eine Bestandsaufnahme. Chem. Zeitung., 105, 157-164.
Muller, G. (1969). Index of geo-accumulation in the sediments of the Rhine River. Geo-Journal., 2, 108-118.
Namminga, H.N. and Wilhm, J. (1976). Effects of high discharge and an oil refinery cleanup operation bon heavy metals in water and sediments in Skeleton Creek. Proceedings of the Oklahoma Academy of Science., 56, 133-138.
Olivares-Rieumont, S., De la Rosa, D., Lima, L., Graham, D.W., Katia, D., Borroto, J., Martinez, F. and Sánchez, J. (2005). Assessment of heavy metal levels in Almendares River sediments-Havana City, Cuba. Water. Res., 39(16), 3945-3953.
Rahman, M.S., Saha, N. and Molla, A.H. (2014). Potential ecological risk assessment of heavy metal contamination in sediment and water body around Dhaka export processing zone, Bangladesh. Environ. Earth. Sci., 71, 2293-2308.
Ramos, L., Fernández, M.A., González, M.J. and Hernández, L.M. (1999). Heavy Metal Pollution in Water, Sediments, and Earthworms from the Ebro River, Spain.Bull. Environ. Contam. Toxicol., 63, 305-311.
Segura, R., Arancibia, V., Zú˜niga, M. and Pastén, P. (2006). Distribution of copper, zinc,lead and cadmium concentrations in stream sediments from the Mapocho Riverin Santiago, Chile. J. Geochem. Explor., 91, 71-80.
Sekabira, K., OryemOriga, H., Basamba, T., Mutumba, G. and Kakudidi, E. (2010). Assessment of heavy metal pollution in the urban stream sediments and its tributaries. Int. J. Environ. Sci. Technol., 7(3), 435-446.
Singh, K.P., Malik, A., Sinha, S., Singh, V.K. and Murthy, R.C. (2005). Estimation of source of heavy metal contamination in sediments of Gomti River (India) using principal component analysis. Water. Air. Soil. Pollut., 166, 321-341.
Szefer, P., Szefer, K., Glasby, G.P., Pempkowiak, J. and Kaliszan, R. (1996). Heavy metal pollution in surficial sediments from the southern Baltic Sea off Poland. J. Environ. Sci. Health A., 31, 2723-2754.
sediments in Taihu Lake, China. Environ. Monit. Assess., 184, 4367-4382.
Tomlinson, D., Wilson, J., Harris, C. and Jeffrey, D. (1980). Problems in the assessment of heavy metal levels in estuaries and the formation of a pollution index. Helgoländer. Meeresun., 33(1-4), 566-575.
Vaezi, A.R., Karbassi, A.R., Kokabi-Habibzadeh,
S., Heidari, M., Valikhani Samani, A.R. (2016). Heavy metal contamination and risk assessment in the riverine sediment. Indian. J. Mar. Sci., 45(8), 1017-1023.