*Corr. Author’s Address: China University of Mining & Technology, College of Mechanical and Electrical Engineering, 0 INTRODUCTION
Research on face grind-hardening technology has not been reported to date. However, peripheral grinding and cylindrical grind-hardening technologies have been extensively researched since “grind-hardening” was proposed by the Brinksmeier [1] in 1994. The major works on this topic are as follows:
(1) Research on the feasibility of grind-hardening and the metallographic structure of the hardened layer [2] to [5].
(2) Research on the influence parameters of the grind-hardening effect [6] to [10].
(3) Research on the temperature field and heat source model by the simulation method [11] to [14]. (4) Research on the performance of surface hardening
[15] to [16].
With the popularization and application of the “grinding hardening” technology, it was found that “grinding hardening” technology is influenced and limited [17] to [20]. Based on an analysis of the above, face grind-hardening technology was studied by experiments and simulation.
1 EXPERIMENTAL METHOD
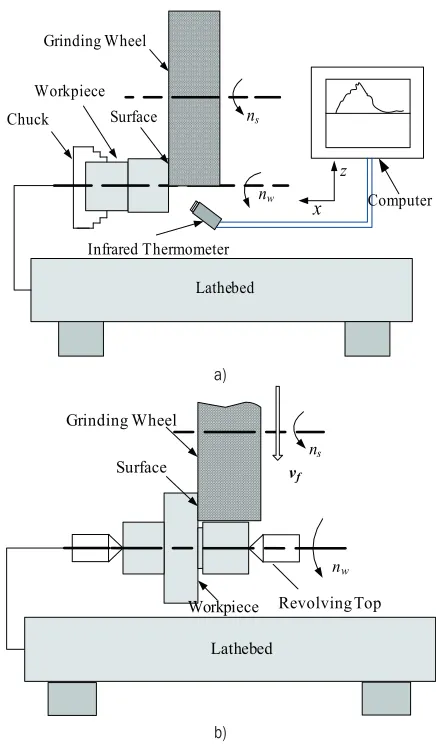
According to the different modes of feeding, face grinding in the test can be divided into (1) one-way face grinding and (2) creep feed entry type, as shown in Fig. 1.
(1) One-way face grinding type: the workpiece was directly ground by the grinding wheel end; the grinding allowance was removed totally in one time step.
(2) Creep feed grinding method, i.e. horizontal grinding: the workpiece was cut into by the
grinding wheel slowly with a certain speed vf, until all the allowance was rubbed away.
Workpiece Surface Grinding Wheel
ns
nw
x
z
Computer
Infrared Thermometer Chuck
Lathebed
a)
Workpiece
Surface vf ns
nw Grinding Wheel
Revolving Top
Lathebed
b)
Fig. 1. Schematic diagram of the grinding system; a) one-way face grinding type, and b) creep feed entry type
Experimental Research and Computer Simulation
of Face Grind-hardening Technology
Li, J. – Liu, S. – Du, C.
Jianping Li* – Songyong Liu – Changlong Du
China University of Mining & Technology, College of Mechanical and Electrical Engineering, China
The influence of technical parameters on face grind-hardening surface hardness and hardened layer depth were determined by systematic experimental studies on technological parameters, such as grinding methods and grinding parameters, which provides a reference for choosing reasonable parameters in face grind-hardening processing. By FEA simulation of the grinding temperature field using ANSYS software, the variation in temperature at different points on the workpiece surface and the temperature field dynamic states are determined. The simulation results are consistent with the experimental values, which indicates that the simulation method is feasible for studying face grind-hardening.
The C45E4 steel in the quenched and tempered state was used as the test material; the surface of the workpiece shape is shown in Fig. 2, which is an annular surface (stepped shaft shoulder face).
R35
R50 R25
R20 R25
Fig. 2. Grinding surface shape and size of workpiece (mm)
2 EXPERIMENTAL RESULTS AND ANALYSIS
The face grind-hardening experiment was carried out under different grinding parameters. The results in Fig. 3 show that if the grinding parameter selection is suitable, after the end grind-hardening process, the surface of the workpiece presented some obvious conventional quenching characteristics, which formed a certain depth of the hardened layer, and the hardened surface layer had similar hardness distribution in the depth direction.
Fig. 3. Hardness distribution curve in the depth direction of the workpiece hardened layer
2.1 Influence of Grinding Methods on Hardening Effect
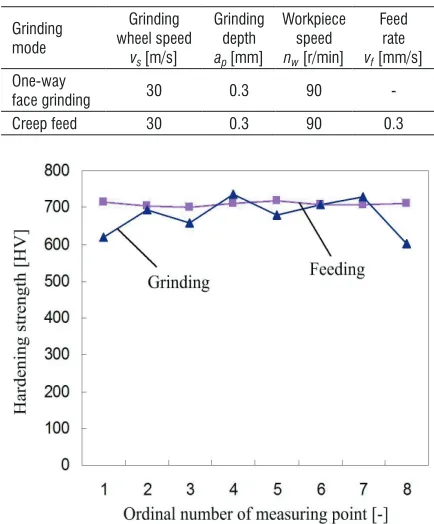
The experimental research was focused on the grind-hardening effect of two grinding methods. The test parameters of both are shown in Table 1.
In order to compare the hardened effects under the two grinding methods, random access points on the workpiece surface were measured. Fig. 4 shows the hardened hardness curve comparison. As can be seen from the graph, the hardness of the surface quenching in a one-way entry type is uniform, while in the creep feed entry type it has large fluctuations.
Table 1. Test parameters (1)
Grinding mode
Grinding wheel speed
vs [m/s]
Grinding depth ap [mm]
Workpiece speed nw [r/min]
Feed rate vf [mm/s] One-way
face grinding 30 0.3 90
-Creep feed 30 0.3 90 0.3
Fig. 4. Quenching hardness curve comparison at different points on the workpiece surface
Fig. 5 shows the hardened depth curve comparison along the radial direction. As can be seen from the graph, the hardened layer depth varies as the radius increases. Namely, it decreases with radius in one-way face grinding and it increases in creep-feed grinding.
Fig. 6 shows two different grinding methods’ grinding wheel effect cross checker, i.e. creep-feed (Fig. 6a), and one-way face grinding (Fig. 6b). With creep feed (Fig. 6a), the grinding wheel cuts into from the outer edge of the workpiece and the workpiece’s external region has a long grinding time, thereby accumulating a high level of thermal energy, so that the temperature extends to a large depth and the hardened layer is thick. At the feed, the hardened layer has its maximum depth, while in the return place, as the heating time is too short, the depth of the hardened layer decreases rapidly. One-way face grinding (Fig. 6b) resulted in a large grinding area, a high metal removal rate, and increasing hardened surface roughness, at the same time the wheel face contact radius curvature resulted in the grinding zone’s different heat source intensity, therefore the surface hardness and depth of hardened layer appear uneven. With greater workpiece contact width, the surface hardening effect distribution is more notable.
a) b)
Fig. 6. Two different grinding methods’s grinding wheel effect cross checker; a) creep feed entry type, and b) one-way face
grinding type
2.2 Influence of Grinding Dosage on Hardening Effect
The influence of grinding dosage on the hardening effect is remarkable, as different grinding dosages provide different grinding results. In the experiment, the feed rate, grinding speed and grinding depth were varied; the testing parameters are shown in Tables 2, to 4.
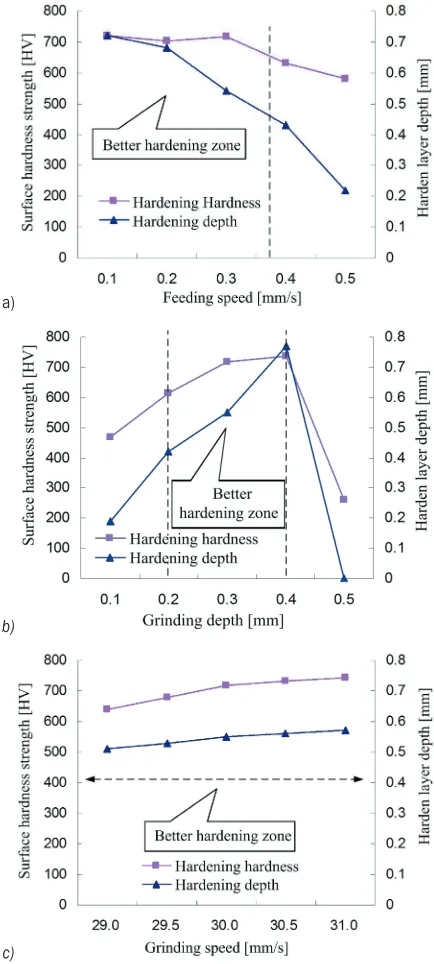
Fig. 7 shows the relationship between the grinding factors and the hardening effect. From Fig. 7 it is clear hardened hardness and hardened layer depth decrease as the feeding rate increases, and increase as the depth of grinding and wheel speed increase, however the magnitude of change is different.
a)
b)
c)
Fig. 7. Comparison of relationships between influencing factors and the hardening effect; a) influence of feed rate on the hardening effect, b) influence of grinding depth on the hardening effect, and c) Influence of grinding speed on the hardening effect
Table 2. Test parameters (2) Workpiece
number
Grinding speed vm [m/s]
Grinding depth ap [mm]
Feed rate vf [mm/s]
1 30 0.3 0.1
2 30 0.3 0.2
3 30 0.3 0.3
4 30 0.3 0.4
Table 3. Test parameters (3) Workpiece
number
Grinding speed vm [m/s]
Grinding depth ap [mm]
Feed rate vf [mm/s]
6 30 0.1 0.3
7 30 0.2 0.3
8 30 0.3 0.3
9 30 0.4 0.3
10 30 0.5 0.3
Table 4. Test parameters (4) Workpiece
number Grinding speedvm [m/s]
Grinding depth ap [mm]
Feed rate vf [mm/s]
11 29.0 0.3 0.3
12 29.5 0.3 0.3
13 30.0 0.3 0.3
14 30.5 0.3 0.3
15 31.0 0.3 0.3
It can be seen that the grinding depth has the most significant effect on the hardened hardness, followed by the feed rate, while the effect of grinding velocity is the least pronounced (Fig. 7a). Grinding depth (Fig. 7b) and feed rate (Fig. 7a) have a significant impact on the hardened layer depth, but the grinding speed’s impact is not significant (Fig. 7c). Generally, the hardenability change is more obvious than the depth of the hardened layer. Therefore, in order to get a better face hardening effect in a certain range (stable influence region), the grinding depth should be increased and the feed rate reduced.
3 FEA SIMULATION OF THE GRINDING TEMPERATURE FIELD
The temperature effect is the most direct factor of phase change, which plays a decisive role on the hardening effect of the workpiece surface material [21] and [22]. Therefore, the grinding temperature analysis is important for improving the workpiece surface hardening effect. Since the temperature measurements during the test are relatively complicated, FEA simulation of the grinding temperature field was performed.
3.1 Grinding Conditions
Table 5. Grinding process parameters
Grinding process parameters Value Maximum speed of grinding wheel vs [m/s] 30 Rotational speed of workpiece nw [r/min] 90
Grinding depth ap [mm] 0.5
Grinding method Directly face grinding, without coolant
Room temperature [ºC] 20
Using one group of test conditions for an example simulation, the grinding process parameters as shown in Table 5 can be calculated as shown in Table 6.
Table 6. Simulation parameters
Simulation parameters Value
Total heating power q [Nm/s] 5760
Source area A [mm2] 117.809
Time of grinding arc ts [s] 0.111 Heat intensity qm [W/m2] 4.156×10⁷
3.2 FEA Process of ANSYS
When the workpiece goes into the grinding area during the process of grinding, its surface temperature rises rapidly and when the workpiece leaves the grinding area, the temperature drops quickly. Since the temperature field changes with time, we used the transient analysis in ANSYS [23] to [26].
3.2.1 Establishment of a Finite Element Model
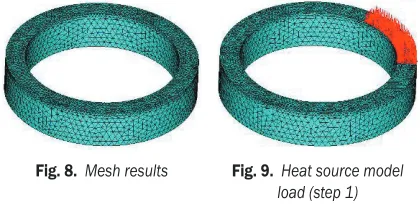
For finite element analysis, we use the element type Solid70 unit, since the workpiece surface is directly affected by the heat effect, which causes a significant temperature gradient, which needs high precision. Therefore, the surface meshing is more detailed on the surface, as shown in Fig.8.
Fig. 8. Mesh results Fig. 9. Heat source model load (step 1)
3.2.2 Loading of Heat Source
During the grinding hardening process, the contact area between the grinding wheel and the workpiece is regarded as the heat source. Along with the rotation of the workpiece, the heat source on the workpiece surface moves in a circular motion. Since ANSYS does not support a direct moving load, we discretized the movement of heat source. This is the method applied when applying temperature load: the workpiece remains motionless, while the load moves along the circumferential direction.
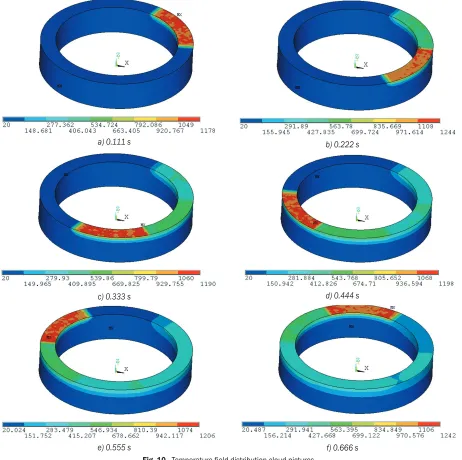
takes up 1/60 of the whole work area, therefore, the heat load is divided into six steps to be loaded. Each load step’s load time is the time the grinding wheel goes through a single grinding arc length (0.111 s). As the radial dimension of the workpiece is relatively small, the radius of curvature effects can be ignored and the heat intensity can be seen as uniform distribution. As shown in Figs. 9 and 10, the uniform heat source model is loaded to the surface of the workpiece, so that the heat source moves along the surface of the workpiece.
3.2.3 Simulation Results and Analysis
Through the finite element simulation, we can determine the grinding temperature field distribution and its variation with time.
Fig. 10 shows the distribution of the temperature field. When the wheel goes through the grinding zone, the surface temperature of the workpiece rapidly rises up to a maximum of 1200 degrees, therefore the heat source location forms a local high temperature, while the workpiece at a certain depth reaches the surface
a) 0.111 s b) 0.222 s
c) 0.333 s d) 0.444 s
e) 0.555 s f) 0.666 s
quenching temperature requirements, by increasing depth and reducing the temperature rise. With the movement of the heat source to the next grinding region, the temperature of the previous grinding region began to drop rapidly, while the grinding area began to heat up and the process proceeds in this way. After grinding of the workpiece surface was finished, the area underwent a heating and cooling process, so as to realize the end surface hardening.
Consider the first grinding zone as an example of the grinding process: at 0.111 s (Fig. 10a), the top workpiece temperature rose quickly to 1178 ºC, as the wheel moved, the regional temperature decreased rapidly, at 0.222 s (Fig. 10b) the temperature dropped to 563 ºC, at 0.333 s (Fig. 10c) it dropped to 279 ºC, and at 0.444 s (Fig. 10d) the temperature dropped slowly to 200 ºC. This shows that the surface has undergone two stages of cooling, (1) rapid cooling above 300 ºC and (2) slow cooling below 300 ºC, in accordance with the cooling rate’s generating martensite.
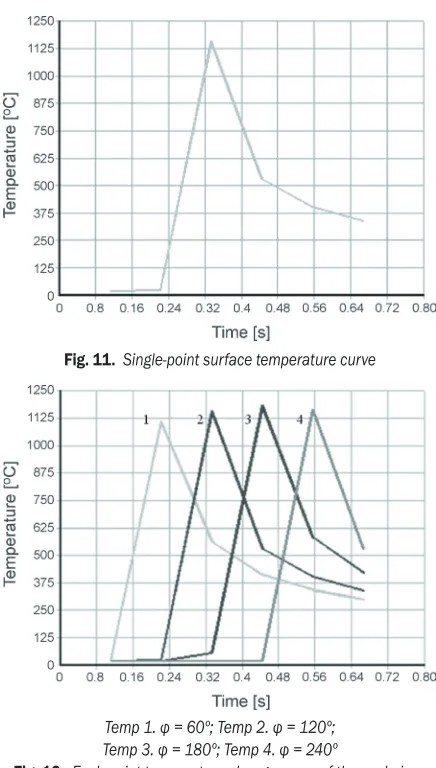
Fig. 11 shows the single-point surface temperature curve. From the chart we can see that when the heat source moved into position, the temperature rose rapidly and reached 1100 ºC; when the heat source was removed, the temperature dropped to 500 ºC, then continued to decrease at a relatively slow rate. This is because in the process of cooling, the temperature gradient is high at first, since the substrate has fast heat conduction. With heat input to the substrate, the temperature gradient decreases and the cooling rate becomes slower. However, the cooling process took a short time, which is consistent with experimental measurements of the temperature curve (Table 7). From the temperature variation we can see that the workpiece temperature dropped from the highest value to below 300 ºC in just 0.3 s. Accordingly, we can predict that the workpiece material showed a martensitic transformation.
Fig. 12 shows the temperature curves of a set of points on the workpiece surface along a circumferentially arranged direction. From the chart we can see that at the observed points the heating and cooling process occurred as shown in Fig. 11, and the variations were essentially the same, although the time it took to reach the highest temperature was dependant on the workpiece entry time. However the highest temperatures were very similar, showing that the workpiece surface can achieve a consistent hardening effect, and will not experience differences due to the duration of contact with the heat source.
Fig. 13 shows the contour map of the grinding hardening temperature field along the workpiece depth.
Fig. 11. Single-point surface temperature curve
Temp 1. φ = 60º; Temp 2. φ = 120º; Temp 3. φ = 180º; Temp 4. φ = 240º
Fig. 12. Each point temperature change curve of the workpiece surface along the circumference direction
Fig. 13. The grinding temperature field isotherm
with increasing depth; the heat becomes lower, the temperature drops and eventually stabilizes at lower values. Thus the surface of the workpiece has reached the austenitizing temperature, while the inside of the workpiece still maintains a relatively low temperature, which is similar to the traditional surface quenching temperature field distribution.
3.3 Validation of the Simulation Results
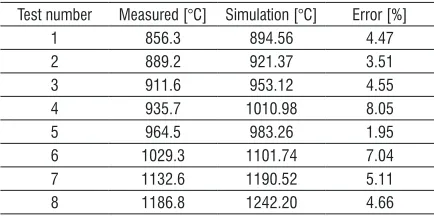
A comparison of several groups of the measured temperature values with the simulation value is shown in Table 7. It is clear that the error value floats between 1.95 and 8.05%. The maximum error is 8.05, meeting the requirements of general engineering prediction accuracy. The results show that the loading of the uniformly distributed source model conforms to the objective situation. These results also prove that the finite element numerical simulation of the temperature field has high accuracy, therefore we can use the simulation method to forecast the hardening effect. This can also be regarded as the basis for the selection and design of grind-hardening technology parameters, which are important in grinding hardening test research.
Table 7. Comparison between simulation values and measured values
Test number Measured [°C] Simulation [°C] Error [%]
1 856.3 894.56 4.47
2 889.2 921.37 3.51
3 911.6 953.12 4.55
4 935.7 1010.98 8.05
5 964.5 983.26 1.95
6 1029.3 1101.74 7.04
7 1132.6 1190.52 5.11
8 1186.8 1242.20 4.66
4 CONCLUSIONS
In this paper, we use the end face grinding method for a grinding hardening experiment study on C45E4 steel andthroughthemeasurement and analysis of the microstructure, surface hardness and hardened layer depth, we can draw the following conclusions:
(1) During the face grinding hardening process, on the surface layer of the workpiece the metallographic structure changes and a certain thickness of martensite structure forms. This verifies the feasibility of the face grinding hardening technology.
(2) On the grinding wheel surface, different radii have a different line speed, which results in different heat source intensity. Therefore, different grinding widths will cause different distributions of the grinding hardening effect: One-way face grinding has high grinding efficiency, but can cause the distribution of quenching hardness and depth of hardened layer. Adopting creep-feed grinding will provide a uniform hardened layer. However, quenching hardness and the depth of the hardened layer both decrease with increased feed rate, and increase with the depth of grinding and grinding speed, in which the grinding depth has the most significant impact, this is followed by feed rate, while the impact of grinding speed is the least pronounced.
(3) ANSYS software was used for transient analysis of the face grinding temperature field. With simulation the dynamic process of the end face grinding hardening was observed and the temperature variation with time was calculated for different points on the workpiece surface during the hardening process. The distribution of the temperature field of the surface layer under different depths was obtained under different time and temperature conditions. The simulation results are consistent with the experimental measurements, indicating the effectiveness of the simulation method.
5 ACKNOWLEDGEMENT
Financials support for this work was provided by the National Natural Science Foundation of China (Project No. 51005232), the Jiangsu postdoctoral fund (Project No. 1101106C) and China’s postdoctoral special funding (Project No. 201104546); all are gratefully acknowledged.
6 REFERENCES
[1] Brinksmeier, E., Brockhoff, T. (1994). Randschicht-warmebehandlung durch schleifen [J]. Heat Treatment and Materials, vol. 49, no. 5, p. 327-330.
[2] Zarudi, I., Zhang, L.C. (2002). Mechanical property improvement of quenchable steel by grinding. Journal of Materials Science, vol. 37, no. 2, p. 3935-3943, DOI:10.1023/A:1019671926384.
[3] Zarudi, I, Zhang, L.C. (2002). Modelling the structure changes in quenchable steel subjected to grinding.
Journal of Materials Science, vol. 37, no. 2, p. 4333-434, DOI:10.1023/A:1020652519141.
[4] Zhang, L.C. (2007). Grind-hardening of steel surfaces:
Technology, vol. 1, no. 1, p. 33-36, DOI:10.1504/ IJAT.2007.013847.
[5] Konstantios, S., George, T., Stavros, D. (2007). Environmental impact assessment of grind-hardening
process. The International Journal of Advanced
Manufacturing Technology, vol. 12, no. 5, p. 338-345. [6] Chryssolouris, G., Tsirbas, K., Salonitis, K. (2005).
An analytical, numerical and experimental approach
to grind hardening. Journal of Manufacturing
Process, vol. 7, no. 1, p. 1-9, DOI:10.1016/S1526-6125(05)70076-1.
[7] Salonitis, K., Tsoukanta, G., Stavropoulos, P. (2006). Process forces modelling in Grind hardening.
Proceedings of the 9th CIRP International Conference,
vol. 13, no. 9, p. 295-302.
[8] Salonitis, K., Chryssolouris, G. (2007). Cooling in grind-hardening operations. International Journal of Manufacturing Technology and Management, vol. 33, no. 3, p. 285-297, DOI:10.1007/s00170-006-0467-9. [9] Salonitis, K., Chryssolouris, G. (2007). Thermal
analysis of grindhardening process. International Journal of Manufacturing Technology and Management, vol. 12, no. 1, p. 72-92, DOI:10.1504/ IJMTM.2007.014143.
[10] Salonitis, K., Chondros, T., Chrysolouris, G. (2008). Chryssolouris, G Grinding wheel effect in the
grind-hardening process. International Journal of
Manufacturing Technology and Management, vol. 38, p. 48-58, DOI:10.1007/s00170-007-1078-9.
[11] Tsirbas, K., Mourtzis, D., Zannis, S. (2004). Chryssolouris G Grind hardening modeling with the use of neural networks. Proceedings of AMST International Conference on Advanced Manufacturing, vol. 25, no. 10, p. 13-18.
[12] Youssef, H.A., Al-Makky, M.Y., Abd-Elwahab, M.M. (2003). Evaluation of a proposed neural network
predictive model for grind-hardening. Alexandria
Engineering Journal, vol. 42, no. 4, p. 411-417. [13] Fricker, D.C., Pearce, T., Harrison, A.J.L. (2004).
Predicting the occurrence of grind hardening in cubic boron nitride grinding of crankshaft steel. Journal of Engineering Manufacture, vol. 218, no. B, p. 1339-1356, DOI:10.1243/0954405042323577.
[14] Michael, F., Kompella, S., Chandrasekar, S. (2009). Measurement of temperature field in surface grinding using infrared imaging system. Journal of Tribology, vol. 125, no. 2, p. 377-383.
[15] Zarudi, I., Zhang, L.C. (2002). A revisit to some wheel-workpiece interaction problems in surface
grinding. International Journal of Machine Tools & Manufacture, vol. 42, no. 8, p. 905-913, DOI:10.1016/ S0890-6955(02)00024-X.
[16] Prekel, H. (2003). Automatic detection of surface properties of grind-hardening layer using infrared image. International Journal of Machine Tools & Manufacture, vol. 41, no. 6, p. 103-114.
[17] Contuzzi, N., Campanelli, S.L., Ludovico, A.D. (2011). 3D Finite Element Analysis in the Selective Laser Melting Process. International Journal of Simulation Modelling, vol. 10, no. 3, p. 113-121, DOI:10.2507/ IJSIMM10(3)1.169.
[18] Tamizharasan, T., Senthil Kumar, N. (2012). Optimization of cutting insert geometry using DEFORM-3D: Numerical simulation and experimental
validation. International Journal of Simulation
Modelling, vol. 11, no. 2, p. 65-76, DOI:10.2507/ IJSIMM11(2)1.200.
[19] Gostimirović, M., Sekulić, M., Kopač, J., Kovač, P. (2011). Optimal control of workpiece thermal state in creep-feed grinding using inverse heat conduction analysis. Strojniški vestnik - Journal of Mechanical Engineering, vol. 57, no. 10, p. 730-738, DOI:10.5545/ sv-jme.2010.075.
[20] Rabiey, M., Walter, Ch., Kuster, F., Stirnimann, J., Pude, F., Wegener, K. (2011). Dressing of hybrid bond CBN wheels using short-pulse fiber laser. Strojniški vestnik - Journal of Mechanical Engineering, vol. 58, no. 7-8, p. 462-469, DOI:10.5545/sv-jme.2011.166.
[21] Yang, G., Han, Z.T., Du, C.L. (2008). The
Experimental Study and Theoretical Analysis of the External Cylindrical Grinding and Surface Hardening Technology. China University of Mining and Technology, Xuzhou.
[22] Ma, Z., Han, Z., Du, C. (2009). The Experimental
Research on Grinding Hardening and Computer Simulation. China University of Mining and Technology, Xuzhou.
[23] Ma, Z., Han, Z. Du, C. (2008). The numerical simulation of the transverse feed grinding temperature field. Manufacturing Technology & Machine Tool, vol. 10, p. 40-42.
[24] Deng, F. (2010). The Self-Study Manual of ANSYS10.0.
People’s Posts and Telecommunications Press, Beijing.
[25] Zhang, G., Hu, R., Chen, J. (2007). ANSYS10.0
Thermodynamics Finite Element Analysis Example Tutorial. Mechanical Industry Press, Beijing.