ENGINEERING AND GINNING
Engineering Economic Analysis of a Cotton By-Product Fuel Pellet Operation
Greg Holt*, James Simonton, Mario Beruvides, and Ana Maria Canto
Greg Holt, USDA-ARS Cotton Production and Processing Research Unit, Lubbock, TX 79403; James Simonton, International Textile Center, Lubbock, TX, 79403; Mario Beruvides and Ana Maria Canto, Texas Tech University, Lubbock, TX 79409-3061
*Corresponding author ([email protected])
ABSTRACT
In the 2001 crop year, the United States pro-duced approximately 19.8 million bales of up-land cotton. From the bales produced, there was an estimated 2.9 million t (3.2 million tons) of waste generated in the ginning process. Moving cotton by-product from a liability to a source of income would be a positive strategy for ginners, oil mills, the textile industr y, and producers. Processing cotton by-products into fuel pellets would furnish a renewable resource that could be used to reduce the consumption of fossil fu-els, while having a minimal impact on the envi-ronment. The objective of this study was to ex-plore the cost feasibility of creating a fuel pellet manufacturing operation utilizing cotton gin by-products. In order to conservatively address key elements, such as marketing, transportation, and manufacturing, an economic model was devel-oped and evaluated assuming a worst-case sce-nario. The cost system model was developed and analyzed to examine the factors influencing the sensitivity of critical areas such as cost and prof-its. The cost system model simulated changes for 24 cost variables associated with the proposed fuel pellet operation. Results from the analysis indicate the probability of obtaining a 15% re-turn on investment as 29.95 or 54.4% depend-ing on whether the product was shipped to vari-ous distribution hubs via truck or rail, respec-tively. Based upon the information contained in this study, it appears that a fuel pellet operation can be a viable means of utilizing cotton gin byproducts to enhance revenue.
I
t was estimated that in the United States, there are approximately 2.04 million tonnes (2.25 million tons) of cotton gin waste (by-products) generated each year across the Cotton Belt (Holt et al., 2000a). In crop year 2001, the United States produced approximately 19.8 million bales of upland cotton (USDA-NASS, 2002). From the bales produced, there was an estimated 2.9 million t (3.2 million tons) of waste generated in the ginning process. In the same year, Texas produced 4,153,866 bales of upland cotton (USDA-AMS, 2002), which equates to an estimated 680,400 t (750,000 tons) of cotton gin waste. Past research has explored other ways to utilize gin by-products such as livestock feed, gardening compost, and raw materials in asphalt roofing products. Despite these efforts, most of the waste generated by the gins is discarded onto fields where it becomes a soil additive (Holt et al., 2000b). In the past, gin waste or byproducts have not been considered to have monetary value and were actually considered a liability (Holt et al., 2000a).Fig-ure 1 shows an example of a pellet burning com-mercial furnace that is used to heat office space.
Pellet stoves have become more popular in re-cent years. Data from the Pellet Fuels Institute (PFI) shows sales of fuel pellets in the 2000/2001 heating season increased 14.7% compared with the previ-ous season (PFI, 2001). The regional distribution and sales in the United States indicate that nationally there has been a steady demand for fuel pellets over the past 6 yr. (Table 1). Some of the primary reasons for the steady sales of fuel pellets are due to a con-cern for the environment, unseasonably cold win-ters, and high natural gas and heating oil prices. A cost comparison between several fuel sources indi-cates that premium wood pellets compare favorably to common residential fuels, such as electricity, pro-pane, and natural gas (Table 2).
Region 2000-2001 1999-2000 1998-1999 1997-1998 1996-1997 1995-1996
Pacific 185,100 213,600 209,600 214,100 206,800 237,700
Mountain 109,800 80,740 108,900 97,980 97,980 111,600
Central 39,010 15,880 28,120 44,450 32,660 17,240
Great Lakes 23,590 17,330 24,490 19,960 40,820 32,660
Northeast 178,700 133,400 122,500 139,700 129,700 97,070
Southeast 57,150 56,250 52,620 44,450 44,450 35,380
Total 593,350 517,200 546,230 560,640 552,410 531,650
Table 1. Tonnes of fuel pellets distributed in the United States by region (PFI, 2001)
Fuelz
Price ($) Cost ($) per kJ (MMBTU) of usable heat
Premium wood pellets – 6% moisture 19.07 MJ/kg (8200 BTUs/lb) 80% efficiency
176.36 per tonne (160 per ton)
11.56 (12.20)
Electricity
3603 kJ/kW-h (3415 BTUs/kW-h) 95% efficiency
0.10 per kW-h 29.19
(30.80)
Propane
359.4 MJ/L (90,000 BTUs/gal) 80% efficiency
0.37 per liter (1.40 per gallon)
29.19 (30.80)
Oil #2
551 MJ/L (138,000 BTUs/gal) 80% efficiency
0.317 per liter (1.20 per gallon)
10.29 (10.86)
Natural gas
3599.4 kJ/kW-h (100,000 BTUs/th erm) 80% efficiency
1.00 per MCF 11.85
(12.50)
Coal
27.9 MJ/kg (12,000 BTUs/lb) 75% efficiency
176.36 per ton ne (160 per ton)
8.42 (8.88)
Firewood
18.96 kJ (20 MMBTU) 65% efficiency
130 per cord 9.48
(10.00) Table 2. Fuel cost comparison of wood pellets to other commonly used fuels (PFI, 2001)
z Efficiency rating is based on newer modern appliances. Older heating appliances may be far less efficient, therefore
in-creasing cost per kJ.
MATERIALS AND METHODS
The overall objective of this study was to ex-plore the economic feasibility from marketing, transportation, and manufacturing aspects of cre-ating a fuel pellet manufacturing operation utiliz-ing cotton gin by-products. To accomplish the over-all objective, various goals were set for each of the financial aspects of marketing, transportation, and manufacturing.
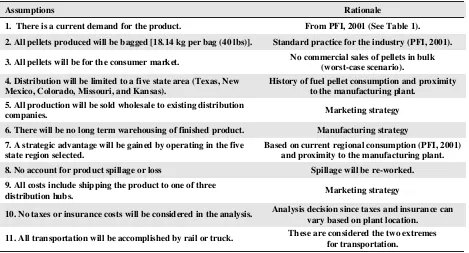
From a marketing perspective, the two goals were 1) to determine the most economically fea-sible distribution area or target market region ap-propriate for the manufacturing location selected, and 2) to establish inventory requirements for both raw material and finished product to meet sales re-quirements. The transportation goals were 1) to de-termine the most economical mode of transporta-tion for the finished product, and 2) to evaluate the sensitivity of return on investment to freight cost and mode of transportation. The manufacturing goals were 1) to develop a comprehensive cost sys-tem that could be used to determine machine and labor requirements, and 2) to examine economic sensitivity issues, such as sensitivity to raw mate-rial availability, capital equipment cost, productiv-ity, transportation cost, labor cost, selling price, etc. In order to address the three major components of the study (marketing, transportation, and manu-facturing) several assumptions were made. The
as-sumptions and their corresponding rationale are listed in Table 3.
The economic model addressed 14 key elements as follows: (1) annual operating profit, (2) annual sales, (3) production per season, (4) usable tonnes of waste, (5) total annual operating expense, (6) capital depreciation amount, (7) total utility cost, (8) total packing cost, (9) total shipping cost, (10) total freight cost, (11) total rental (lease) cost, (12) total repair and maintenance cost, (13) total cost savings to gin for waste disposal, and (14) return on investment (ROI).
To determine the projected values for these key elements, several “what if” analyses were performed using the Crystal Ball software package (Crystal Ball 2000, Decisioneering Inc., Denver, CO). The results are displayed as a forecast of what can be expected based on the laws of probability within a representa-tive distribution.
Machinery and facility layout. A gin located in the West Texas region provided actual production data for the study. During the 2001 crop year, the gin production was 55,000 bales of cotton with an aver-age processing rate of 50 bales per hour. According to the gin, half of their producers use field cleaners during harvesting. Past research has shown that non-field-cleaned cotton will yield about 317.5 to 362.9 kg (700 to 800 lbs) of waste per bale and field cleaned cotton about 136.1 to 158.8 kg (300 to 350 lbs) per bale (Baker et al., 1994; Holt et al., 2000b). Based
Assumptions Rationale
1. There is a current demand for the product. From PFI, 2001 (See Table 1).
2. All pellets produced will be b agged [18.14 kg per bag (40 lbs)]. Standard practice for the industry (PFI, 2001).
3. All pellets will be for th e consumer mark et. No commercial sales of pellets in bulk (worst-case scenario).
4. Distribution will be limited to a five state area (Texas, New Mexico, Colorado, Missouri, and Kan sas).
History of fuel pellet consumption and proximity to the manufacturing plant.
5. All production will be sold wholesale to existing distribution
companies. Marketing strategy
6. There will be no long term warehousing of finished product. Manufacturing strategy
7. A strategic advantage will be gain ed by operating in the five state region selected.
Based on current regional consumption (PFI, 2001) and proximity to the manufacturing plant.
8. No account for prod uct spillage or loss Spillage will be re-worked.
9. All costs include ship ping the product to one of three
distribution hub s. Marketing strategy
10. No taxes or insurance costs will be consid ered in the analysis. Analysis decision since taxes and insuran ce can vary based on plant location.
11. All tran sportation will be accomplished by rail or truck. Th ese are con sidered the two extremes for transportation.
on these numbers and input from the gin, it was cal-culated that the gin produced approximately 13,100 t (14,437 tons) of waste during the 2001 ginning sea-son; this averages out to approximately 238.1 kg (525 lbs) of waste per gin bale. Not all waste is recover-able or usrecover-able. Other impurities, such as dirt and sand that are not desirable for this type of product, also exist in the raw material. From previous re-search, it was estimated that only about 80% of the total waste generated by the ginning process would be usable for the pellet operation (Holt et al., 2000a). This equates to 190.5 kg (420 lbs) of usable waste per bale. Currently, the gin pays $2.00 per bale to dispose of the waste, which calculates to a yearly disposal cost of $110,000.
The size and configuration of the production facilities were determined based on the production capacity of the machinery selected. Since the co-operating gin had ample acreage surrounding the gin, the building housing the fuel pellet processing equipment was to be located adjacent to the rent gin operation. This would allow the gin’s cur-rent waste disposal system to be utilized to feed the fuel pellet operation. The actual construction consists of a 306.6 m2 (3300 ft2) metal building on a concrete slab. The design of the building will uti-lize natural ventilation and a sufficient amount of lighting to assure a safe work environment. The building will be equipped with a covered loading dock to allow product to be loaded during inclem-ent weather. There will be a 46.5 m2 (500 ft2) allot-ment of storage area designed into the building that will allow approximately three truckloads of palletized fuel pellet bags to be staged for truck loading. This will limit the on-site storage to ap-proximately 8 hr of production.
The machinery selected for this operation was based on the information supplied by Insta-Pro In-ternational (Des Moines, IA) and other suppliers. The production rates and cost factors are considered to be “conservative” in nature. “Conservative” is defined as using the mid to upper level cost esti-mates obtained from equipment manufacturers that would represent a worst-case scenario. The produc-tion facilities daily producproduc-tion rate was set at ap-proximately 70% of the anticipated average waste production of the gin (9527 kg/hr). From a produc-tion standpoint, it was considered ineffective to at-tempt to match the waste output of the gin, since the waste amounts could vary depending on whether the gin was experiencing operational difficulties. In an
effort to reduce the impact that upset conditions in the gin would have on the throughput of the fuel pellet operation, the fuel pellet operation was de-signed to handle 70% of the gins output with the other 30% being stored outside for later processing. Three Insta-Pro Model 9800 Extruders (Insta-Pro International, Des Moines, IA) were selected to give versatility to the production capacity. Insta-Pro estimates that the throughput of each extruder will be approximately 50% of its rated capacity for this type of waste. The actual capacity could be slightly higher or lower depending on the extruder’s ability to handle the waste produced by the gin. The manu-facturers’ 100% capacity rating for each extruder is 4445 kg (9800 lbs) per hour. The remaining equip-ment was sized to handle the capacity of the extrud-ers at approximately 75% of their rated capacity. This type of design enables the operation to scale back extruders in times of low gin trash production and scale up when the waste production increases.
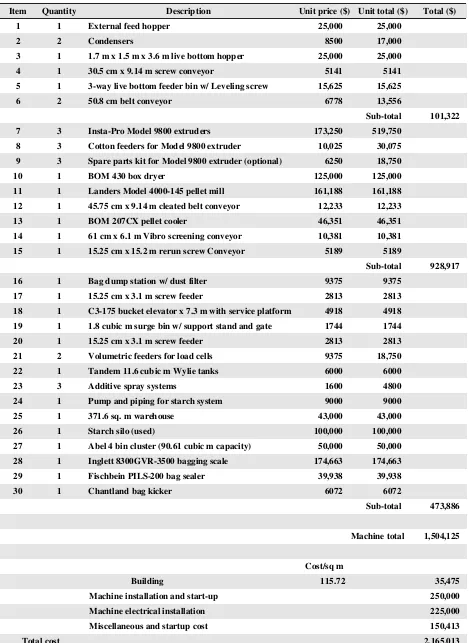
It is believed that with the system design, a stan-dard rate of 6668 kg (14,700 lbs) per hour could be maintained. During low gin waste generation times, an external feed hopper would be used to supple-ment the pellet operation by feeding previously by-passed waste back into the system. Table 4 contains a general description list and average cost of the capi-tal equipment used for the study.
Due to the nature of the cotton by-products, a binding agent must be added to hold the pellet to-gether after it is formed. In prior work, a gelatinized polysaccharide was utilized as the binder that re-quired heated mixing tanks (Holt et al., 2001b). For this project, a different approach of using a cold starch slurry was implemented. The use of a cold starch slurry eliminated the need for boilers and hot mixing tanks. Our system utilized commercially available polypropylene 11,356 L (3000 gal) hold-ing and mixhold-ing tanks. The volume of dry starch used in the process per season, approximately 417,300 kg (920,000 lbs), requires the use of a starch silo to hold bulk product. The cost for a used silo with all the equipment needed to deliver the product to the mixing tanks is approximately $100,000.
Table 4. Capital equipment list with associated cost, in dollars, for the project
Item Quantity Descrip tion Unit price ($) Unit total ($) Total ($)
1 1 External feed hopper 25,000 25,000
2 2 Condensers 8500 17,000
3 1 1.7 m x 1.5 m x 3.6 m live bottom hopp er 25,000 25,000 4 1 30.5 cm x 9.14 m screw conveyor 5141 5141
5 1 3-way live bottom feeder bin w/ Leveling screw 15,625 15,625
6 2 50.8 cm belt conveyor 6778 13,556
Sub-total 101,322
7 3 Insta-Pro Model 9800 extrud ers 173,250 519,750
8 3 Cotton feeders for Mod el 9800 extruder 10,025 30,075 9 3 Spare parts kit for Model 9800 extruder (optional) 6250 18,750
10 1 BOM 430 box dryer 125,000 125,000
11 1 Landers Model 4000-145 pellet mill 161,188 161,188
12 1 45.75 cm x 9.14 m cleated belt conveyor 12,233 12,233
13 1 BOM 207CX pellet cooler 46,351 46,351
14 1 61 cm x 6.1 m Vibro screening conveyor 10,381 10,381 15 1 15.25 cm x 15.2 m rerun screw Conveyor 5189 5189
Sub-total 928,917
16 1 Bag d ump station w/ dust filter 9375 9375
17 1 15.25 cm x 3.1 m screw feeder 2813 2813 18 1 C3-175 bucket elevator x 7.3 m with service platform 4918 4918
19 1 1.8 cubic m surge bin w/ support stand and gate 1744 1744 20 1 15.25 cm x 3.1 m screw feeder 2813 2813
21 2 Volumetric feeders for load cells 9375 18,750 22 1 Tandem 11.6 cub ic m Wylie tanks 6000 6000
23 3 Additive spray systems 1600 4800
24 1 Pump and piping for starch system 9000 9000
25 1 371.6 sq. m wareh ouse 43,000 43,000
26 1 Starch silo (used) 100,000 100,000
27 1 Abel 4 bin cluster (90.61 cubic m capacity) 50,000 50,000 28 1 Inglett 8300GVR-3500 bagging scale 174,663 174,663
29 1 Fischbein PILS-200 bag sealer 39,938 39,938
30 1 Chantland bag kicker 6072 6072
Sub-total 473,886
Machine total 1,504,125
Cost/sq m
Building 115.72 35,475
Machine installation and start-up 250,000
Machine electrical installation 225,000
Miscellaneous and startup cost 150,413
362,900 kg (800,000 lbs) of finished product. This equates to 20,000 bags of product that can temporarily be stored until time of shipping.
An automated bagging station was recom-mended by InPro. The automated bagging sta-tion would fill each bag with 18.14 kg (40 lbs) of pellets, heat seal the bags, stack 50 bags on a pallet, and then wrap the pallet with cellophane. This setup represented about 15% of the total capital cost of the project. Several laborers, if deemed necessary, could possibly replace the bagging system. At stan-dard production there will be 368 bags produced per hour, which will be used to create 7.4 pallets.
A building of 306.6 m2 (3300 ft2) was deter-mined to be sufficient to house the production equip-ment. An estimate of $115.72/m2 ($10.75/ft2) was obtained from a contractor that currently constructs these types of buildings. The machine installation and electrical costs were obtained from estimates of similar facilities, Insta-Pro, and cost engineering text. Insta-Pro provided estimates based on their experi-ence installing similar equipment in oilseed produc-tion facilities. Cost engineering data were obtained from Humphreys and Wellman (1996). To cover startup and miscellaneous cost (including new em-ployees training and minor unforeseen expenses), a value of 10% of the total machinery cost was used. Raw materials. The participating gin averaged approximately 55,000 bales of cotton ginned per harvest season (October to December). For this analysis, an average of 238.1 kg (525 lbs) of waste was used for the average amount of waste produced per ginned bale of cotton. In addition to the waste produced at the gin, there was an option of purchas-ing waste from other gins located within a 32 km (20 mile) radius of the processing plant. The amount of waste purchased and the price necessary to both purchase and transport the additional waste was con-sidered as variables to be evaluated. The cost to pur-chase and transport the additional waste was estab-lished at $8.81 per tonne ($8.00 per ton). The base information for the raw material used in this study were as follows: annual production – 55,000 bales; bales/h – 50; average waste/bale – 238kg; waste purchased – 13,100 t; usable waste – 80%; usable waste/season – 10,480; gin operation – 50d; opera-tion/day – 22h; usable waste/h – 9.53t.
Labor cost. Labor for this operation used a com-bination of seasonal contract labor and full-time per-manent positions. The ginning industry has
tradi-tionally used full-time temporary employees to work during the ginning season only. After completion of the ginning season, these employees are released.
Direct labor included laborers, forklift opera-tors, front-end loader operaopera-tors, and lead men for each shift. As mentioned before, these employees were full-time temporary contract laborers for the duration of the production season. For this reason the employees worked straight time with no ben-efits. Hourly pay rates were higher than the mini-mum wage usually paid in the area and reflected the need for employees that were willing to work the time required.
The pellet operation had two full-time employ-ees: a manager and foreman. There was also a one 6-month clerical position. It was important to have these as annual positions so that a level of opera-tional expertise was maintained. The full-time em-ployees were responsible for training the employ-ees each year, as well as working to develop sales and marketing for the company. This type of arrange-ment worked to maintain the stability of the opera-tion during the off-season. For this study, a 22 h workday was used with 2 h of cleanup and minor maintenance. A total of three 8-h shifts were used with seven employees per shift, not including the manager, foreman, and secretary. Each shift was comprised of three laborers, one leadman, one loader operator, and two floor operators.
Expenses. Operational expenses comprise ap-proximately 63% of the total cost of the product and are directly related to the run time of the production facility. In this case the dryer fuel (natural gas) and electricity are consumed for approximately 3 months out of the year. The remaining 9 months of the year the utility consumption is negligible.
The bags used for this process are unique. They are doubled-walled and perforated. The perforation allows the product to breath and prevents moisture build-up during and after the bagging process. They are also designed to offer the consumer a tear resis-tant package.
As for the mobile material handling equipment used, lease of a front-end loader and forklift was a more viable option than purchasing, since purchas-ing would add more capital cost to the project. The other expense related to the mobile material han-dling equipment is fuel.
on their experience of having this type of equipment in the field. This estimate is based on tonnes of duction and works out to be $2.76 per tonne pro-cessed ($2.50 per ton). An overall reduction in gin operating expense of $110,000 was taken as an an-nual cost savings. This reduction was the result of cost savings realized due to the gin not having to dispose of waste at a cost of $2.00 per bale ginned. The product used, in this analysis, for binding the pellet together was feed grade cornstarch. A solu-tion of cornstarch mixed in water was added at a rate of 4% by weight of waste being fed into the extrud-ers. Based on 18.14 kg (40 lbs) per bag of fuel pel-lets, there was 0.725 kg (1.6 lbs) of cornstarch per bag of fuel pellets produced. With a season’s produc-tion of 577, 500 bags, there was 419,100 kg (924,000 lbs) of cornstarch consumed. The actual cost per bag was $0.10 for the cornstarch binder.
Since the COBY process is a patented process, the licensee is entitled to royalties. The royalties for making a fuel pellet are set at 4% of the profit per 0.91 t (1 ton) of the product produced. The royalties were considered in the operational cost of the plant.
Transportation. In an effort to establish trans-portation cost parameters, four shipping points were selected. The four shipping distribution hubs (Albu-querque, NM; Denver, CO; and Kansas City, MO; Lubbock, TX) were used to service the five destina-tion states (NM, CO, MO, KS, and TX). In both trucking and rail estimates the cost of shipping was directly related to the distance traveled. The initial cost system was set up with the general assumption that the fuel pellets would be shipped in equal pro-portions to the three distribution hubs. Table 5 con-tains freight cost per bag for equal destination allo-cation and several different destination combina-tions. It should be noted that the shipping cost is expressed as a weighted average and summed to obtain the freight cost as an average cost per bag. The second part of the table demonstrates the ship-ping allocation by destination effect on cost and profit per bag. It should be noted that shipping the finished product to the nearest rail spur [64.4 km (40 mi)] had an associated transportation cost of $0.114 per bag.
Freight cost per bag
Location Distrib ution
Truck allocation
(%)
Truck ($)
Truck wt. avg.
($)
Rail allocation
(%)
Rail ($)
Rail wt. avg.
($)
Albuq uerqu e 1/3 33.3 0.561 0.187 33.3 0.329 0.110
Denver 1/3 33.3 0.750 0.250 33.3 0.391 0.130
Kansas City 1/3 33.3 0.953 0.317 33.3 0.453 0.151
Cumulative cost/bag 0.754 0.391
Location Allocation Truck total cost ($)
Truck profit ($)
Rail total
cost ($) Rail profit ($)
1/3,1/3,1/3 A 2.101 0.399 A 1.860 0.640
1/4,1/2,1/4, B 2.100 0.400 B 1.860 0.640
1/4,1/4,1/2 C 2.150 0.349 C 1.870 0.630
1/2,1/4,1/4 D 2.050 0.447 D 1.840 0.660
3/4,1/8,1/8 E 1.980 0.519 E 1.820 0.680
1/8,3/4,1/8 F 2.099 0.401 F 1.860 0.640
1/8,1/8,3/4 G 2.226 0.274 G 1.900 0.600
100% Alb uquerque H 1.908 0.592 H 1.800 0.700
100% Denver I 2.097 0.403 I 1.860 0.640
100% Kansas City J 2.300 0.200 J 1.920 0.580
Cost/bag for Lubbock 0.114
Model development and analysis. To evaluate the economic feasibility of building and operating a cotton byproduct processing plant, a spreadsheet model was developed and analyzed. The following formulas form the basis of the model used to calcu-late various aspects of the cost system:
1) Annual Operating Profit (AOP)
AOP = Annual Sales - Total Annual Operating Expenses,
2) Total Annual Operating Expense (TAOE)
TAOE = Capital Depreciation (CD) + (CD * Interest Rate) + Utility Cost + Bag Cost + Pallet Cost + Freight Cost + Rental Charge + Labor + Fuel Cost + Repair and
Maintenance + Office Supplies + Starch +Cost of Additional Gin Waste + Royalties + Cost Savings,
3) Return on Investment (ROI)
ROI = Annual Operating Profit / Capital Investment.
Since changes in costs of materials, labor, sup-plies, transportation, and other variables occur and can have a significant affect on the feasibility of a project, 24 variables were assigned distributions with ranges deemed appropriate based on research and experience. Table 6 presents a list of all the vari-ables and their respective distributions and param-eters used in the forecast model for all the different analyses performed.
Due to the fact that cost overruns can occur dur-ing construction, one of the primary variables used in the model was capital cost. During the simula-tions, the capital cost was allowed to increase up to 7.8% above the baseline listed in Table 5. The 7.8% increase was based on equipment cost variations encountered while obtaining prices for the machin-ery listed in Table 4.
RESULTS AND DISCUSSION
The forecasting model performed 50,000 itera-tions adjusting each variable within the specified range for the assigned distribution. The model out-put contained the mean and standard deviation of key elements, such as number of years to payback, ROI, annual profit, cost per bag, etc., based on cost variable changes within the specified distributions. The break-even selling price per bag was established based on market information gathered from the Pel-let Fuels Institute and other similar organizations. When manufacturing and transportation cost are
taken into consideration, the break-even selling price for fuel pellets being trucked and shipped by rail is 2.17 and $1.95, respectively. The break-even price per bag standard deviation for the truck and rail were 0.17 and $0.15, respectively.
An analysis was performed to examine the break-even waste quantity at a delivered selling price of $2.50 per 18.14 kg (40 lb) bag. In the analysis it can be seen that as waste quantity is reduced the operation’s ability to cover cost is inhibited. The actual break-even waste quantity varied depending on the mode of transportation used. The break-even quantities for truck and rail were 7783 t (8579 tons) and 6320 t (6967 tons), respectively. These break-even values would equate to 40,850 and 33,175 bales of cotton, for truck and rail, respectively, with an average waste per bale of 190.5 kg (420 lbs). The break-even bale quantity is significant because the worst crop year this gin has experienced in the last 25 yr was 21,000 bales, which equates to 4001 t (4410 tons) of waste. For years, when the cotton gin processed fewer bales than the break-even quantity, additional waste had to be purchased in order to break-even.
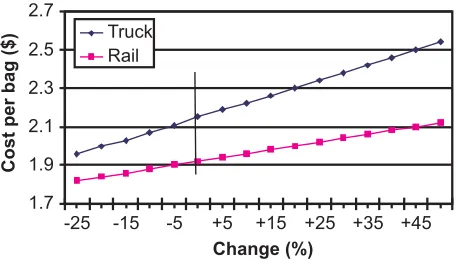
Transportation sensitivity. Since transportation costs are keys to the total cost of the product an analy-sis was performed to determine if the cost of the product would be sensitive to a change in freight charges. The analysis used incremental values from a 25% decrease to a 50% increase in freight cost. An increase in trucking freight cost is more signifi-cant because of the limited capacity of each truck-load, 1100 bags; whereas a change in rail freight cost is distributed over the carloads carrying capac-ity of 5000 bags. This would indicate a need to shift the shipping allocation more heavily toward rail. The results of this comparison are contained in Figure 2.
1.7 1.9 2.1 2.3 2.5 2.7
-25 -15 -5 +5 +15 +25 +35 +45
Change (%)
Cost per bag ($)
Truck Rail
Table 6. Distributions and their associated parameter v ariables used in the forecast modeling
Variable Distribution Unitsz
Distribution parameters Range
Extruder production
rate Normal
kg/hr (lbs/h r)
Mean = 2223 (4900) Std. dev. = 222 (490)
1556 – 2889 (3430 – 6370)
Waste per bale Normal kg/hr (lbs/h r)
Mean = 238 (525) Std. dev. = 23.8 (52.5)
166.7 – 309.6 (367.5 – 682.5)
Usable waste Normal % Mean = 78
Std. dev. = 4 66 - 90
Number of bales
ginned Beta #
Alpha = 9.0; Beta = 2.5;
Scale = 66,000 33,000 – 66,000
Starch applied Normal % Mean = 4.0;
Std. dev. = 0.4 2.8 – 5.2
Price per kWh Normal $ Mean = 0.055;
Std. dev. = 0.003 0.051 – 0.065
Cost of starch Triangular $/Mg ($/ton) Min. = 99 (90); Max. = 149 (135); Likeliest = 127 (115)
99 – 149 (90 – 135)
Bag cost Normal $ Mean = 0.25;
Std. dev. = 0.015 0.205 – 0.295
Pallet cost Triangular $ Min. = 6; Max. = 11;
Likeliest = 8 6 – 11
Maintenance and
repair cost Normal
$/Mg ($/ton)
Mean = 2.50
Std. dev. = 0.25 1.75 – 3.25
Natural gas cost Triangular $/Mcm ($/Mcf)
Min. = 0.119 (3.37); Max. = 0.145 (4.11); Likeliest = 0.132 (3.74)
0.119 – 0.145 (3.37 – 3.74)
Gasoline cost Normal $ Mean = 1000;
Std. dev. = 50 850 – 1150
Selling price per bag Normal $ Mean = 2.50
Std. dev. = 0.15 2.05 – 2.85
Interest rate Normal % Std. dev. = 0.85Mean = 8.0; 5.45 – 10.55
Office operational
cost Triangular $
Min. = 850; Max. = 1150;
Likeliest = 1000 850 – 1150
Disposal cost Normal $ Std. dev. = 0.67Mean = 2.00; 0.01 – 4.00
Additional waste
purchased Exponential Mg (tons) Rate = 0.0
– 25,382 (0.0 – 23,026)
Lab orer wages Pareto $/hr Location = 5.25;S hape = 2 5.25 – 6.50
Leadman wages Pareto $/hr Location = 7.25;
S hape = 2 7.25 – 8.75
Loader op erator Pareto $/hr Location = 6.00;
S hape = 2 6.00 – 7.25
Floor operator Pareto $/hr Location = 5.75;
S hape = 2 5.75 – 6.75
Secretary Pareto $/hr Location = 6.50;
S hape = 2 6.50 – 7.50
Cost of additional
waste Normal
$/Mg ($/ton)
Mean = 3.31 (3.00) Std. dev. = 0.44 (.40)
1.98 – 4.63 (1.80 – 4.20)
Capital cost Uniform $ Min. = 2,165,013 Max. = 2,350,000
2,165,013 – 2,350,000
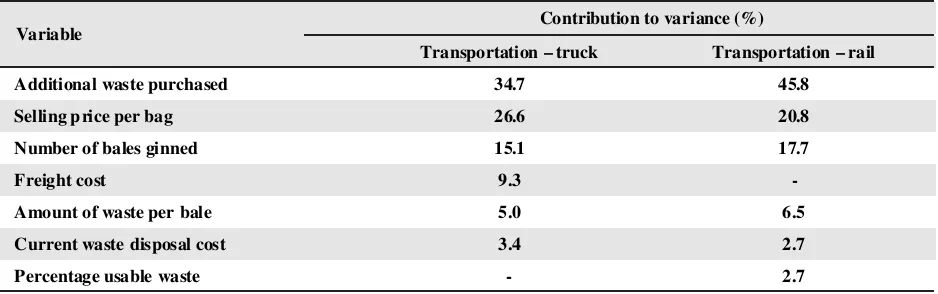
Table 7 shows the top six variables that have the largest impact on the sensitivity of ROI for both truck and rail. The top three variables are the same for both modes of transportation with additional waste purchased being the primary contributor to the variance of ROI. The primary difference be-tween truck and rail is the inclusion of freight cost. Truck freight cost added to the variation of ROI by 9.3%; whereas rail freight only affected the varia-tion by 0.7%.
Cost system. By approaching this project as an enhancement to a current operation, a minimum at-tractive rate of return was not predetermined. Based upon the target value given to us by the participat-ing gin, the minimum ROI desired was established at 15%. The cost system model was developed in Microsoft Excel spreadsheets and was used to ex-amine factors that influenced the sensitivity of criti-cal areas, such as cost and profits. One such area was the relationship between finished product trans-portation and the amount of waste available for the pellet operation. Rates of return were calculated us-ing the future value of the capital cost if the money was simply invested for 10 yr. These values were used as benchmarks. The waste generated, in the form of thousands of bales ginned, was manipulated until the profits matched the benchmark values. This allowed a comparison to be made that showed how many bales would have to be processed in order to meet the various return rates.
With 15% return on investment, as a minimum standard, transporting finished product by truck did not appear to be a viable option. For trucking to be viable, the long-term interest rate on capital cost had to be 4% or below. Using rail as the primary trans-portation is less sensitive to a change in interest rate and was found to meet the required ROI even at 16%
interest rate levels. Figure 3 shows the ROI changes to variations in the interest rates.
What-if analysis. Several “what if” analyses were produced using the Crystal Ball software pack-age. The first analysis examined a ROI of 15% as it relates to the current cost system. A total of 50,000 trial runs were performed. The results were displayed as a forecast of what ROI can be expected based on the laws of probability within a normal distribution. The results of this analysis for both modes of trans-portation are contained in Table 8. The mean ROI for truck and rail were 10.1 and 16.06%, respectively. The certainties of obtaining a 15% ROI, based on the assumptions of the model, for truck and rail were 29.95 and 54.40%, respectively.
The same process was used to forecast the ef-fect that total usable waste has on the process. Us-ing the same basic arrangement, the total tons of usable waste per season was examined using 50,000 trial runs. The forecast of the amount of usable waste available was as follows: 0.0% - 4747 t; 5.0% - 8401 t; 10.0% - 9100 t; 50.0% - 12,466 t; 90.0% - 18,283 t; 95.0% - 20,821 t; 100.0% - 54,879 t.
0 5 10 15 20 25
4 6 8 10 12 14 16
Interest Rate (%)
ROI (%) Truck Rail
Target ROI
Figure 3. Effect of inter est rate change on return of invest-ment (ROI).
Contribution to variance (%) Variable
Transportation – truck Transportation – rail
Additional waste purchased 34.7 45.8
Selling p rice per bag 26.6 20.8
Number of bales ginned 15.1 17.7
Freight cost 9.3 -
Amount of waste per bale 5.0 6.5
Current waste disposal cost 3.4 2.7
Percentage usable waste - 2.7
This forecast supports the premise that the op-eration will be viable even in years with low waste quantities from a cost per bag perspective. At the 10% value of 9100 t (10,031 tons), the operating cost would be $2.36 per bag for truck transportation and $2.14 for rail. Based on this cost and a delivered selling price of $2.50 per bag, the ROI for this com-bination would be 3.11 and 8.27%, respectively. The forecast results suggest that 90% of the time the ginned bales should exceed 9100 t (10,031 tons), which would allow a modest ROI in seasons of poor supply. To obtain the ROI of 15%, the minimum quantity necessary would be 11,780 t (12,985 tons). Based on the model, the average number of years to pay-back the capital cost would be 7.37 for truck and 5.74 for rail. These averages are based on the capital cost being allowed to vary uniformly from 2.16 to 2.35 million dollars. The interest rate on the capital cost investment varied according to a nor-mal distribution with a mean of 8% and a standard deviation of 0.85%.
CONCLUSIONS
Using the information contained in this study it does appear that a fuel pellet operation can be a prof-itable development. Treasury bills return about 3.86% on a 10-yr investment (as of 20 February 2003; Bloomberg.com, 2003). The stock market his-torically returns approximately 12% (Coe, 2002; Stuhlreyer, 2002; and Wibel, 2002). Based upon the assumptions and values used in the forecast model, the ROI of 15% would have a 29.95 and 54.4%
chance of certainty if transporting the product to market by truck or rail, respectively. To be able to achieve the optimal transportation cost, a combina-tion of truck and rail will most likely be used.
The ROI can be further improved by examining the projects capital cost. For example, if the three extruders were replaced with blending augers, there would be a drastic reduction in power consumption and capital cost. Replacing extruders with blending augers would also increase the throughput of the operation. Replacing the three extruders would elimi-nate approximately 745.7 kW (1000 Hp) and would reduce the capital cost by approximately $500,000. Even though replacing the extruders with blending augers would improve the overall economic analy-sis, it was not considered in this study since it did not represent a worst-case scenario. Forecast mod-eling using a worst-case scenario, based on higher capital cost, was performed in order to provide an overall conservative economic analysis.
The COBY process does not require the use of an extruder, but an extruder is often incorporated in the process. The use of an extruder in the process expands the possible consumer products that can be manufactured, but is not a COBY process require-ment. Narrowing the estimates to quotable amounts could result in overall ROI improvements. The in-formation for this project was gathered in good faith. Pricing figures contained in this study are for bud-getary estimation only and are not intended as quot-able amounts.
Table 8. Distribution of r eturn-on-investment (ROI) for both truck and rail transportation
Transportation – truck Tran sportation – rail
Percentile (%) ROI (%) Percentile (%) ROI (%)
0.0 -13.40 0.0 -11.43
10.0 0.89 10.0 5.95
20.0 3.76 20.0 9.09
30.0 6.00 30.0 11.53
40.0 8.04 40.0 13.81
50.0 10.10 50.0 16.06
60.0 12.29 60.0 18.55
70.0 14.95 70.0 21.51
80.0 18.22 80.0 25.33
90.0 23.54 90.0 31.48
DISCLAIMER
The use of product or trade names does not con-stitute an endorsement by the USDA-ARS or Texas Tech University over other comparable products. Products or trade names are listed for reference only.
REFERENCES
Baker, R.V., W.S. Anthony, and R.M. Sutton. 1994. Seed cotton cleaning and extracting. pp. 69-90 In W.S. Anthony and W.D. Mayfield (ed.) Cotton Ginners Handbook. USDA-ARS, Agricultural Handbook No. 503. U.S. Gov. Print. Of fice, Washington, DC.
Bloomberg.Com. 2003. U.S. Treasuries [Online]. Available at www.bloomberg.com/mark ets/ (verified 26 Sept. 2003). Coe, M. 2002. Why 10% - 12%: Investing 101 [Online].
Available at www.coeinc.org/AllSections/
LongTermSubSections/RateOfReturn.htm (verified 26 Sept. 2003).
Holt, G.A., G.L. Barker, R.V. Baker, and A. Brashears. 2000a. Various parameters of cotton gin byproducts produced from the gin processing machinery. p. 1595-1602. In Proc. Beltwide Cotton Conf., San Antonio, TX, 4-8 Jan. 2000. Natl. Cotton Counc. Am., Memphis, TN.
Holt, G.A., G.L. Barker, R.V. Baker, and A. Brashears. 2000b. Characterization of cotton gin byproducts produced by various machinery groups used in the ginning operation. Trans. ASAE-43(6): 1393-1400.
Holt, G.A. and J.W. Laird. 2001. COBY products and a process for their manufacture. Patent No. 6,383,548, U.S. Patent Office, Washington, D.C.
Holt, G.A., J.W. Laird, G.L. Barker, and M.D. Buser. 2001. Comparing abrasiveness of cotton gin by-products using the coby process. p. 1388-1392. In Proc. Beltwide Cotton Conf. Anaheim, CA, 9-13 Jan. 2001. Natl. Cotton Counc. Am., Memphis, TN.
Humphreys, K.K. and P. Wellman. 1996. Basic Cost Engi-neering. Mercel Dekker, Inc., 3rd ed. New York, NY.
Pellet Fuels Institute (PFI). 2001. Pellet sales survey 2000-2001 [Online]. Available at www.pelletheat.org/industry/ industry.html (verified 26 Sept. 2003).
Stuhlreyer. M.S., Jr. 2002. Retail telecommunications networks: conversion from dial-up to dedicated. Contingent Network Services [Online]. Available at http://contingent.donet.com/
Retail%20Integration%20ROI%20White%20Paper.pdf (verified 26 Sept. 2003).
USDA - Agricultural Marketing Service (AMS). 2002. Quality of cotton classed under Smith-Doxey Act [Online]. Available at www.ams.usda.gov/mnreports/ MP_CN106.txt (verified 26 Sept. 2003).
USDA - National Agricultural Statistics Service (NASS). 2002. Cotton ginnings [Online]. Available at http:// www.nass.usda.gov/ar/2002cgin.htm (verfied 26 Sept. 2003).
Wibel, K. 2002. Small and mid-cap stocks likely to outper-form blue chips. Your Source Journal 3 (1):2-4 [Online]. Available at www.yoursourcefinancial.com/