73
International Journal of Advances in Engineering Research
ANALYSIS OF EFFECT OF THERMAL CYCLING TEST
ON PHOTOVOLTAIC MODULE USING EL TECHNIQUE
Saurabh Kumar1,Gaurav Kumar2
1CMJ University,Shillong, India, 2N.I.T, Kurukshetra, India
ABSTRACT
To improve PV module’s lifetime and reliability, it is essential to understand the mechanisms and causes that degrade module performance over time under different climatic conditions. In this study, our main aim is to correlate the degradation of module power with physical changes that are generated in the cells over time. The poly-crystalline silicon 200W modules are subjected to long term accelerated tests (testing to be continued until failure occurs) and cell level defects are characterized using electroluminescence (EL) technique. The characterization is done periodically to analyze the trend of physical changes occurring in the module under aggravated stresses and degrading module’s performance. Also, change in series resistance under thermal stress is analyzed as it has a direct impact on module’s output power. Iterative simulation based software and EL images have been used to estimate series resistance of the cells.
INTRODUCTION
After the fabrication of a high power photovoltaic (PV) module, the most critical aspect is the duration for which the module can produce useful power. Reliability and lifetime of photo-voltaic (PV) modules are key factors to system performance and warranty and thus are extremely important as far as PV business is concerned. Outdoor field testing is an accurate method in estimating module lifetime. However, since PV modules commonly come with twenty five years of warranty, testing modules in field for that long period is not feasible. Thus, due to time constraints, many accelerating aging tests have been derived over the years for testing reliability of PV modules. The accelerated test protocols established by organizations like IEC and UL have been adopted worldwide as official tests to evaluate module quality and reliability standards. To improve the reliability and thus lifetime of modules, it is extremely critical to analyze the effects of environment on the performance of modules and understand the exact causes of module degradation. Electroluminescence (EL) imaging is fast becoming an important non-destructive technique to diagnose the cell level defects in the module. It has been shown by Fuyunki et al that the electroluminescence intensity of multi- Si cell under forward bias is directly proportional to the minority carrier diffusion length [1]. Hence a dark areain an EL image signifies an electrically inactive area. EL test generates a defect map of each cell of the module which can be used to evaluate the degradation of cells.
74
International Journal of Advances in Engineering Research
hence it would be quite useful lto estimate the changes in cell’s series resistance under various environmental stresses. O. Breitenstein et al [2]have developed a fast converging iterative method to calculate the local series resistance of the cell using EL images.
In this work, main focus is given to analyze the changes developed in cells during different accelerated tests using EL technique and correlate those observations with module’s power degradation. Change in cells’ series resistance post Thermal cycling test is also analyzed using Breitenstein method.
EXPERIMENTAL
75
International Journal of Advances in Engineering Research
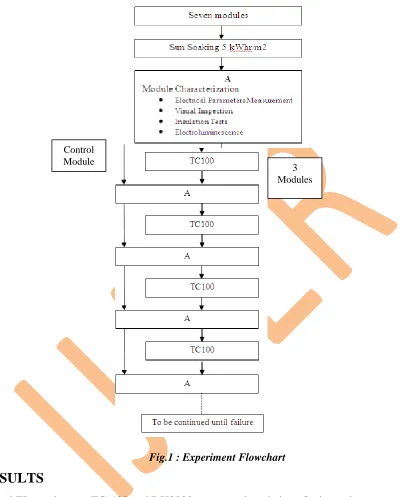
Fig.1 : Experiment Flowchart
RESULTS
IV and EL results post TC-400 and DH3000 tests are given below. Series resistance results post TC200 are also given below.
Thermal Cycling Test
Figure 2 reflects the typical trend in change of electrical parameters during thermal cycling test. Here, change in critical electrical parameters - maximum power (Pm), short circuit current (Isc), open circuit voltage(Voc), and fill factor (FF) – of a module after each batch of 100 thermal cycles are plotted.
3 Modules Control
76
International Journal of Advances in Engineering Research
Figure 2: Typical trend of change in electrical parameters during thermal cycling test
Post TC400 test, all samples showed a degradation in output power less than 4.1%, which is not substantial considering IEC qualification test specifications (passing criteria is defined as not more than 8% power degradation post TC200). As can be seen in figure 2, the power degradation is driven by both loss in fill factor and short circuit current. Also, a near linear degradation in power is observed. This trend in change in electrical parameters is explained below using electro-luminescence results.
77
International Journal of Advances in Engineering Research
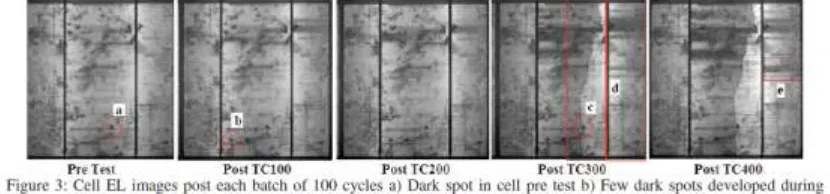
Figure 3e and 4a show finger related defects which affect fill factor by increasing cell’s series resistance. Suchdefects are found to increase after each TC100 test which led to linear reduction in fill factor. As discussedabove, using Breitenstein method, series resistance of individual cell can be computed. Figures 5 show EL images and corresponding Rs images of two cells with increased finger defects. The dark areas in EL image correspond to light areas in the Rs map which signifies higher series resistance areas. The series resistance of all the cells of the module is computed and added up to estimate overall series resistance. The module total seriesresistance post TC200 test is found to be increase by approximately 9.6% which validates the observations (lossin fill factor due to increase in series resistance) mentioned above.
DISCUSSION
78
International Journal of Advances in Engineering Research
loss in fill factor due to increase in series is validated by computing the change in series post test using Breitenstein method. The defects caused by thermal cycling test lead to an increase in series resistance of the cells which contribute in power degradation.
CONCLUSION
At the end of both the extended tests (TC400), power did degrade but not reached failure point. However, in order to improve the module’s durability, it is essential to understand the causes behind performance degradation. The EL and Rs estimation is done preciously for that and the results revealed lot of information on cell level defects which helped in understanding the possible causes of module’s power degradation. Loss in fill factor (increase in series resistance) is observed during both the accelerated tests and is one of the main causes of module degradation. Thus, in order to improve module’s reliability, work needs to be done to improve cell metallization and interconnect soldering. Micro-cracks, observed mainly during thermal cycling test, could be critical for long term reliability of modules and thus should be suppressed as much as possible.
REFERENCES
[1]. O. Breitenstein, A. Khanna, Y. Augarten, J. Bauer, J.M. Wagner, and K. Iwig, “Quantitative evaluation of electroluminescence images of solar cells” (Rapid Research Letters 4, No. 1, 7–9,
2010)
[2]. Takashi Fuyuki, Hayato Kondo, Yasue Kaji, Akiyoshi Ogane, and Yu Takahashi, “Analytic findings in theelectroluminescence characterization of crystalline silicon solar cells”, (Journal of