131
“POWER AND OIL SECTOR IN INDIA: AN ESTIMATION
AND ANALYSIS OF THE KEY INFLUENCERS
IMPACTING ENERGY, PRODUCTION, AND
DISTRIBUTION PARAMETERS WITH RESPECT TO
SOCIO ECONOMIC PROGRESS AND CHANGES IN
INDIA.”
Rizul Gupta
Pathways World School Aravali Sohna Road, Haryana
For a developing country like India, the energy security task is gigantic.
India would need to sustain an economic growth rate of 8-10% over the next 25 years, in order to eradicate poverty and meet its human development needs. India is a hugely energy deficit country where half the population does not have access to commercial energy. Presently, India depends to the extent of 75% or more on imported crude oil.
Energy security addresses not merely economic growth but also more basic human needs of sustenance and poverty eradication. India needs energy to fight poverty. Needless to mention that India’s energy consumption on per capita terms is amongst the lowest vis-àvis other fellow developing countries, not to mention developed countries.
As infrastructure growth remains the overriding priority for India, the power sector has a pivotal role to play. Thus growth in the power sector has to keep pace at least with the annual GDP growth rate, if sustained socioeconomic development is to be made a reality.
In the electricity sector alone, India face a peaking shortage of almost 12 per cent and an energy shortage of 9 to 10 per cent.
The principle issue in oil area is the means by which, where from and at what cost can satisfy India's vitality needs in a supportable way.The functioning of international oil and gas markets in a transparent manner is most important from India’s point of view. Unfortunately, the global energy market is far from perfect and has in recent years been hugely susceptible to non-market considerations. No one can forget the rollercoaster ride of last year which took the prices to a skyrocketing high of $ 147 per barrel. Such high prices were clearly unsustainable. The recent trend of rising oil prices is again threatening a renewed volatility, which is neither in interest of producing nor of consuming countries.
Developing and emerging economies are particularly hard hit by this volatility, which adversely impacts on their developmental activities and national economic plans.
With these we can very well understand that energy sector is very vital for India to sustain the GDP growth and power and oil sector are key sector in energy field.
POWER SECTOR OVERVIEW: - GENERATION
The power generation industry in India is poised for a major structural change due to increased private ownership and greater diversification in the fuel mix. Investor interest in generation is quite significant with investments flowing for manufacturing, advanced technology and merchant power. Further, the decision of the Nuclear Suppliers Group (NSG) to allow its members to engage in civilian nuclear technology trade with India might lead to an exponential increase in the share of nuclear fuel in the fuel mix.
India's installed capacity (excluding captive plants) as of March 2009 was 147,965 MW. Thermal continues to have a dominant share, at 63.34 per cent or 93,725 MW, followed by hydro (24.92 per cent), renewable (8.94 per cent) and nuclear (2.78 per cent). Sector-wise, the state sector has a majority 51.44 per cent share or 76,115.67 MW in capacity, followed by the central (33.09 per cent) and private (15.46 per cent) sectors.
Capacity addition slows down during the year and Twelfth Plan targets finalized:-
The key concern in generation has been the sector's inability to add capacity commensurate with the increase in power demand. Despite poor past achievements, yet another ambitious target of 78,700 MW of conventional capacity has been set for the Eleventh Plan period. The trend of underperformance, however, continued during the first two years of the Eleventh Plan period. The key reasons for underachievement include inadequate equipment capacity and shortages in fuel and manpower.
The good news, however, is that orders for the remaining capacity for the plan period (65,983 MW) have already been placed and these are at various stages of processing. Further, equipment manufacturers, both of main plant and balance of plant, are fast ramping up their capacity. All of this may not be available for the current plan period as some of these plans are expected to fructify only in the Twelfth Plan period. Nevertheless, this would secure future capacity addition plans from the equipment standpoint. The technical thrust is to move to supercritical and other efficient technologies.
Meanwhile, the Central Electricity Authority (CEA) has started working on Twelfth Plan targets. It has already prepared the Twelfth Plan hydro document identifying projects totaling 30,000 MW. It is now finalising a report on Twelfth Plan thermal projects for which it has already selected projects with capacity aggregating around 70,000-80,000 MW.
Rising private sector contribution: -
The private sector contribution to the total installed capacity has been rising consistently since the passage of the Electricity Act, 2003 from 8.66 per cent in March 2003 to 15.46 per cent in March 2009. This share is expected to rise further, given that independent power producers (IPPs) / private projects aggregating over 100,000 MW are under various stages of development. Of the 26,000 MW of Twelfth Plan thermal capacity, which is under execution, 15,000 MW is in the private sector.
investment of Rs 364 billion. However, the current financial downturn may adversely impact several IPPs, which are awaiting financial closure of their projects. Based on the progress of projects which have already initiated construction work, the private sector target for the Eleventh Plan was revised upwards to 15,000 MW at the end of 2007-08 from 10,500 MW initially. The CEA expects an addition of over 21,000 MW by the private sector by 2012. This is a tenfold increase compared to around 2,000 MW contributed by the private sector during the Tenth Plan period. The trend in the private sector is to reserve a part of the installed capacity for merchant transactions in the market.
Much more desired in productivity improvement: -
Although the productivity of power plants has been improving, serious efforts are required to accelerate and sustain improvements in productivity. The plant load factor (PLF) of thermal plants has improved from 72 per cent in 2003 to over 77 per cent in 2008-09. However, PLFs recorded a marginal decline in 2008-09 (77 .22 per cent) compared to 2007-08 (78.62 per cent). In 2008-09, the central and private sectors, which have been consistent performers, had average PLFs of 84.3 per cent and 91per cent respectively, while the state sector had 71.8 per cent. The state sector has been recording lower PLFs mainly due to the operation of many old plants, which require renovation and modernization (R&M) or retirement
In terms of power generation, the sector recorded a mere 2.68 per cent growth in 2008-09 to reach 717,894.52 MUs from 699,191 MUs in 2007-08. In comparison, generation recorded a growth of over 6 per cent during the previous two years. Of the total generation in 2008-09, thermal sources contributed the maximum share at 82.17 per cent followed by hydro (15.74 per cent) and nuclear (2.04 per cent).
UMPPprogress:-
The concept of UMPPs, mooted by the government in 2005 to add huge coal-based pro-jects (4,000 MW each) quickly and cost effectively through private investment, made significant progress during the year. In February 2009, the fourth UMPP, Tilaiya in Jharkhand, was awarded to Reliance Power Limited (RPL), which had already won two UMPPs earlier. The project is' expected to come online by 2015. In April 2009, RPL achieved financial closure for the Sasan UMPP in Madhya Pradesh. The units of this project are expected to be commissioned between December 2011 and April 2013. For the imported coal-based Krishnapatnam UMPP in Andhra Pradesh, RPL acquired three coal mines in Indonesia and currently is in talks with equipment manufacturers. Meanwhile, Tata Power's Mundra UMPP in Gujarat, the first UMPP off the block, is on track and is scheduled for commissioning in 2012.
free power by states that need to be appropriately addressed with respect to all projects, and not only UMPPs.
Tariff benchmarks discovered through competitive bidding:-
Long-term tariffs, discovered through competitive bidding during the past year, have been in the range of Rs 1.77 to Rs 2.97 per unit. For instance, the lowest levellised tariff quoted by RPL for the Tilaiya UMPP was Rs 1.77 per unit. Among the other projects, which have been awarded through competitive bidding during the past year, the lowest tariff discovered was Rs 2.45 per unit for supply of 1,241 MW (under Case I bidding) in Madhya Pradesh (RPL), Rs 2.84 per unit for the 1,980 MW Talwandi Sabo project (under Case II bidding) in Punjab (Sterlite Industries), Rs 2.86 for supply of 500 MW (under Case I bidding) in Haryana (GMR), Rs 2.94 per unit for supply of 1,424 MW (under Case I bidding) in Haryana (Adani) and Rs 2.97 per unit for the 1,320 MW Karchana project (under Case II bidding) in Uttar Pradesh
Nuclear capacity set to increase significantly:-
The marking of the Indo-US atomic arrangement in October 2008 after a waiver from the NSG opened up plenty of chances for India to take part in universal regular citizen atomic trade. India has entered into similar agreements with France, Russia, Kazakhstan and Canada. The Indian atomic power showcase is evaluated to be worth $100 billion. It is evaluated that 40,000 MW of atomic limit may come up by 2020. The legislature has set an objective to build the offer of atomic power from around 3 for each penny as of now to 25 for every penny by 2050. Cynics contend that these objectives may not be sensible given that the Indian atomic industry is beginning sans preparation.
KG basin gas to boost generation:-
The accessibility of gas from Reliance Industries Limited's (RIL) D6 hinder in the Krishna Godavari (KG) bowl will positively affect the power area. For 2009-10, the power sector has been allocated 18 mmscmd of gas. This is expected to lead to an additional generation from stranded capacity of 3,800-4,000 MW during the year. This may increase further in case the fertilizer sector (which gets first priority) does not use all the gas allocated to it as it would then automatically come to the power sector (which gets second priority for existing assets). The availability of spot gas at a cheaper price of $5-6 per mmbtu will also boost gas-based generation from both utility/IPP plants and captive plants. The power ministry and the CEA, however, are taking a cautious approach in planning new gas-based capacity. This is because new power projects would get the last priority for gas allocation as per the government's gas allocation policy.
Hydro continues to account for about a quarter of the Installed capacity:-
remaining projects aggregating 12,235 MW planned during the current plan period are under construction. By the end of the current plan period, the share of hydro is expected to fall marginally to around 22 per cent if all capacity is commissioned as planned.
Growth in captive generation:-
There has been a dramatic increase in the number of captive plants since the passage of the Electricity Act, 2003. Today, captive power contributes around 55,000 MW of capacity which is over a quarter of the installed base. The key reason has been the steep growth in industrial production coupled with rising shortages in many states. The slowdown in industrial growth in some segments in recent months may have given rise to surplus captive capacities. While the concept of open access and trading promises captives opportunities for disposing of surplus power, there are implementation issues which need to be addressed. A key development which is expected to result in increased gas-based captive production is the availability of gas from RIL's KG basin block. With the expanding city gas distribution networks across cities and with greater assurance of gas supply to these networks, the potential for several captive plants within city limits to switch from liquid fuels to natural gas is much higher
POWER SECTOR OVERVIEW: - TRANSMISSION
Power transmission is taken more seriously by planners and investors (both the public and private sector) after the passage of the Electricity Act, 2003 and particularly during the last year or so. It has been recognized that a strong and adequate transmission infrastructure is a prerequisite for ensuring free flow of power where it is required, either through short term or long-term contracts
The introduction of modern concepts like open access, trading and merchant power, and the growing importance of captive power, renewable sources of energy and nuclear power in the overall power mix have led to new requirements in transmission investments, planning and operations.
Further, to handle the growing complexity in market operation involving multiple players and to provide fair access to the network to all these players, system operators must be adequately empowered. Thus, there is a move towards separating load despatch functions from transmission utilities to ensure a level playing field for new entrants as recommended by the Gireesh Pradhan Committee.
As of March 2009, the state transmission utilities (STUs) and the central transmission utility (CTU), which are responsible for intrastate and interstate transmission networks respectively, together owned and operated a complex transmission system comprising around 220,800 ct. km lines and over 288,600 MVA and 14,000 MW of substation capacity at voltages above 220 kV.
the past decade has been only about 6-7 per cent. The government has set a target of 10 per cent growth in network length and 14 per cent growth in capacity for the Eleventh Plan period, which should go a long way in addressing capacity constraints.
While the current financial scenario may marginally impact investments in the power sector, raising resources for transmission projects should not be difficult as such because these are usually debt market customers whose debt needs are met largely by public sector financial institutions.
For instance, Power Grid Corporation of India Limited (PGCIL), the country's CTU, spent Rs 147.1 billion during 2007-08 (Rs 66.15 billion) and 2008-09 (Rs 80.95 billion) and is confident of achieving its capital expenditure target of Rs 120 billion during 2009-10. Of the Rs 550 billion it has planned for the Eleventh Plan period, it proposes to spend Rs 200 billion in the development of trans mission systems associated with the ultra mega power projects.
At the state level, the STUs spent around Rs 68.17 billion during 2007-08 alone. This amount comprises 33 per cent of the total utility spending during the year. The STUs target a spending of Rs 650 billion for the Eleventh Plan period. The momentum in spending both at the central and state levels needs to be accelerated and sustained to ensure that transmission bottlenecks do not stall growth.
The development of the national grid by PGCIL is an effort to ease transmission constraints. Progress on the national grid project has resulted in interregional transfer capacity increasing to 19,800 MW in March 2009 compared to 16,200 MW in March 2008. The target is to take this to over 37,700 MW by 2011-12 and to 58,700 MW by 2014-15.
Another significant development has been the operationalisation of the long-awaited National Load Despatch Centre (NLDC), the apex body in the hierarchy of the national grid system, in February 2009. NLDC's full fledged operation had become imperative with the emergence of two power exchanges for which it is mandated to act as the nodal agency, according to the Central Electricity Regulatory Commission's (CERC) latest open access regulations. In fact, the launch of the NLDC has set the stage for synchronous operation of the national grid on a real-time basis and for smooth power transfers across regions.
With the national grid plan and new concepts being adopted, the use of state-of the-art technology has become imperative. The national grid is being implemented with a flexible 765 kV AC transmission system with series compensation, convertible static compensators and static VAR compensators
To cut losses, PGCIL is adopting higher voltages such as 765 kV, +/- 800 kV and 1,200 kV. The development on this front remained relatively slow with most 765 kV lines still being charged at 400 kV (except for the Sipat-Seoni line). However, other technologies like gas-insulated substations and supervisory control and data acquisition for substation automation are witnessing faster adoption. The future envisages development of smart grids.
Continuous changes in technological standards have raised concerns of obsolescence, impelling transcos to undertake massive renovation and modernization work.
transmission segment has been tough despite its opening up way back in 1998. The only public-private partnership project - the Tala transmission system has been operational since May 2007.
Awarded in October 2007 and being implemented by Reliance Power Transmission Limited, the first independent power transmission company project has made some progress since and is expected to be completed by 2010. There are a handful of transmission systems associated with private generation projects that are being developed by private players either independently, or in joint venture with PGCIL or an STU.
Meanwhile, the much-awaited 14 transmission projects identified by the power ministry for 100 per cent private investment have also made some headway with the approval of all the standard bidding documents in 2008. The bidding process for the first three projects has already been initiated and nodal agencies - the Power Finance Corporation and the Rural Electrification Corporation - have received between 13 and 16 requests for qualification for these projects.
With respect to tariffs, the central regulator, CERC, has the mandate to determine a national transmission tariff framework. Rationalisation of transmission tariffs continues to be a long-standing concern, and is crucial for attracting investments in the sector. Prospective investors clearly look for competitive bidding and distance- and direction-based transmission tariffs as envisaged by the National Tariff Policy, 2006. The CERC is currently working on these regulations and is expected to come up with draft regulations shortly.
Meanwhile, in March 2009, it issued draft regulations for differentiated and non-discriminatory medium- and long-term access to the interstate grid. The objective is to make the terms of long-term grid access more flexible and allow medium-term transmission system usage (3 months to 3 years).
The rapid transformation of the segment has thrown up many issues and challenges before policy-makers. These include inadequate equipment manufacturing capacity, fast changing technology leading to obsolescence, problems in right-of-way, delays in clearances, inadequate margins in the system, grid indiscipline, lack of basic infrastructure and uncoordinated planning.
Despite additions, interregional power transfer capacity continues to be limited in comparison with the requirement. The transmission corridors are always chock-a-block, leaving little or no free capacity for trading. The emergence of the two power exchanges and more traders is expected to put greater pressure to create redundant transmission capacities.
The synchronisation of four regional grids has increased grid indiscipline, particularly in the northern region states, which have been overdrawing despite the CERC's stringent measures. A key tool for maintaining grid discipline at the interstate level has been the availability-based tariff mechanism. However, the sustained success of the mechanism would depend on regular payment of unscheduled interchange charges, which some states are not paying.
transmission infrastructure and improve their efficiency by moving towards higher voltage levels, others need to catch up to ensure that a lack of adequate transmission networks does not become a bottleneck. This uneven development is also a hindrance to implementing modern concepts like open access, and developing power markets.
Net, net, greater attention is being paid to the transmission system in recent times as reflected in the huge investment plans of the CTU and STUs, the government's intent to attract private investment and the regulator's efforts to rationalise transmission tariffs.
POWER SECTOR OVERVIEW: - DISTRIBUTION
Power distribution is the final and most crucial link in the electricity value chain as it directly affects the consumer who pays for the supply. Distribution starts at the 33 kV substation and ends at the consumer's doorstep and involves navigating a maze comprising distribution lines, transformers, switchgears, capacitors and other equipment.
India's distribution infrastructure includes more than 6.76 million ct. km of lines and over 282,000 MVA of distribution transformer capacity as of March 2008, and it is assumed to be growing at an annual average growth rate of around 3 per cent and 7.5 per cent respectively. On an average, India loses about 32 per cent of electricity as its aggregate technical and commercial (AT&C) losses, which is a more accurate measure than simple transmission and distribution (T&D) losses. The target is to reduce AT&C losses to 15 per cent by 2012 under the Restructured Accelerated Power Development and Reform Programme (R-APDRP). Even though AT&C losses continue to remain high (ranging from 12 per cent to 68 per cent), there has been a decline in AT&C losses in almost all discoms. On the other hand, T&D losses registered a decline from 32.54 per cent in 2002-03 to an estimated 26.91 per cent in 2007-08. There are an estimated 160 million electricity consumers today, growing at an annual rate of 4.5 per cent. The average per capita consumption was about 704 units in 200708 and is expected to cross 1,000 units by 2011-12. Electricity supply has not been able to keep pace with growth in demand.
Power shortages have risen on an average basis from 9.8 per cent in 2007-08 to 11.1 per cent in 2008-09 indicating that demand has grown much faster than supply.
However, peak power shortage has come down from 16.6 per cent in 2007-08 to 11.9 per cent in 2008-09 primarily due to better grid synchronisation and power trading market development. The distribution system is plagued by deep-rooted legacy problems of high AT&C losses triggered by rampant power thefts and technical issues, corruption, subsidised or free power, dilapidated networks, inadequate metering, poor recovery of dues, lack of consumer orientation and poor operational and financial management.
Distribution reforms: Union government assistance:-
The union government launched the APDRP in 2002-03, with the objective of encouraging reforms and reduction in AT&C losses, and improving power supply quality and consumer satisfaction. Under the APDRP, reform-driven projects were given assistance. System up-gradation, metering, energy audits and consumer services were the key areas covered. The Rs. 400 billion APDRP under the Tenth Plan comprised two components, an investment component and an incentive component, each with an allocation of Rs. 200 billion.
As of March 2008, a total of 571 projects were sanctioned under the APDRP involving an investment of Rs 170.34 billion. Of the total investments, the Government of India component was around Rs. 87.2 billion, of which around Rs 74.7 billion was released. The total utilisation until March 2008 was Rs 119.02 billion, well short of the targeted Rs. 200 billion. Under the incentive component, the government has so far approved around Rs 29 billion and released the entire amount. This is also well short of the Rs 200 billion targeted level of grants.
The maximum number of projects were undertaken in Andhra Pradesh (100 projects), followed by Kerala (52) and Madhya Pradesh (48). Further, around 74 per cent of the works were completed under the APDRP as of November 2008.
The programme so far has created islands of excellence, which most utilities were not able to replicate in non-APDRP circles. The programme met with moderate success but succeeded in bringing a focus to badly needed distribution reforms. Subsequently, the power ministry has released the R-APDRP, which is larger in scale than the original programme at Rs 515 billion. As of February 2009, Rs 19.47 billion has been sanctioned by the Power Finance Corporation to 25 discoms covering 598 towns under the R-APDRP.
The Rajiv Gandhi Grameen Vidyutikaran Yojana (RGGVY), aimed at rural electrification, is also providing focus and funds to the rural distribution system. As of April 16, 2009, 562 projects under the RGGVY have been sanctioned with a total cost of Rs 262.06 billion, of which Rs 135.56 billion has been released. So far, 6.34 million rural households have been provided with electricity connections and over 59,000 villages have been electrified under the RGGVY.
Privatization of distribution -A preference for franchisee models:-
Privatization of distribution has been slow to take off. Orissa, the first state to privatise distribution, was unable to reap the entire benefits of privatisation initially. The discoms suffered due to lack of government support and absence of transitional subsidy to absorb the financial losses. However, the privatisation experience in Delhi has been better as discoms have been able to bring down AT&C losses and generally improve customer services.
The franchisee model holds promise for the future as it is perceived as a "softer" approach in involving private players in distribution. It seems to be politically more acceptable, since it is not an out and-out sale.
model has served as a benchmark for other states to follow. In recent months, the Uttar Pradesh government has moved ahead to introduce input-based franchisees in urban areas for power distribution. Torrent Power Limited has been awarded the letter of intent for the Agra and Kanpur franchisee in Uttar Pradesh for a period of 20 years. Other states such as Haryana and Orissa are also planning to take the franchisee route.
Role of reforms and regulation:-
Reforms and regulation have played a key Role in the distribution turnaround. The formation of 25 state electricity regulatory commissions (SERCs) in 28 states has led to tariff rationalisation as industrial tariffs are being progressively reduced, while tariffs for agricultural and other categories are being increased to levels closer to the cost of supply.
Besides, most SERCs have also passed the final regulations on performance standards for distribution licensees, which specify the overall and guaranteed standards with respect to complaint handling, quality of power supply and system reliability, safety, restoration of power supply, existing and new connections, metering and billing issues, among other things.
Open access, a catalyst to help the captive segment and energise power trading, has taken off for bulk consumers in some states. Other consumer categories would gain access in a phased manner. Almost all SERCs have passed the final regulations. As of March 2009, 116 approvals have been awarded in 10 states.
The splitting and unbundling of state electricity boards (SEBs) has also helped a great deal. So far, 14 SEBs have unbundled and statistics show that unbundled SEBs have a lower cost of supply than vertically integrated utilities. A few states are still unwilling to take the political decision to un-bundle.
The level of metering has shown improvement. This is partly due to the APDRP. At the 11 kV feeder level, 100 per cent metering has been achieved in 23 states and 100 per cent consumer metering has been achieved in 9 states. While metering at the feeder and consumer levels has shown considerable improvement, DT metering needs attention.
Another positive development is that both sales of power and state utility revenues are showing a steady increase every year. Revenue from the sale of power increased from Rs. 982.86 billion in 2004-05 to Rs. 1,217.91 billion in 2006-07 registering an annual growth of 11.32 per cent. There was a higher growth in revenue from sale of power vis-a-vis energy sold, indicating improved realisation by utilities through higher tariffs. Cash collections are improving particularly in states implementing APDRP works, receiving subsidies in time, and where anti-theft laws have been passed. A few utilities/SEBs have registered an improvement in cash profits like Maharashtra, Kerala, Karnataka, Jharkhand, Bihar, Orissa, Rajasthan, Haryana, Delhi and Chhattisgarh. However, states like West Bengal, Punjab, Uttar Pradesh, Madhya Pradesh and Tamil Nadu, have shown deterioration on the financial front.
Growing focus on ITand consumer-centric approach:-
Spot billing, call centres, remote meter reading, automated billing and energy accounting are among the IT mechanisms incorporated. HVDS, SCADA systems, distribution management system software, DT monitoring systems and GIS are some of the new technologies in use today. However, the budgets for new investments are still inadequate and the utilisation of existing investments is still poor. Some distribution companies continue to display a lack of strategic approach to systematic development.
A turnaround in the distribution segment is critical to make the power sector commercially viable and to deliver reliable power supply at reasonable cost. The government's thrust on reforms and implementation of policy objectives through regulatory efforts has started to bring an increased focus on profitability and efficiency. However, sustained long-term efforts will be required to lead to permanent changes.
POWER SECTOR: - FROM 2003 TO 2030
India is projected to have power generation capacity of ~ 750 GW by 2030 i.e. ~5X the current capacity, which is expected to be the third highest globally. This implies annual capacity addition of 20-25 GW against the average annual capacity addition of 5-6 GW in the eleventh plan so far.
The macro story of the sector implies high growth, long term visibility and sustainable returns. This, together with the demand –supply gap (~16% peak deficit), has been attracting investment into the power sector. The sector growth has been posted CASR of 50%, highest in the infrastructure sector over FY00-09.
Game changers for the sector from 2003
Since FY03, Govt. of India has undertaken many initiatives to correct structural faults that had developed in the sector over the years. These measures are described below, clearly had long-term impact on the power sector
Power for all by 2012
In 2001, the central government introduced ‘Power for all by 2012- a comprehensive blueprint for all power sector development projects. It aimed at adding at least 100 GW by 2012 and increasing the per-capita availability of electricity to over 1000 units by 2012. This blue print formed the core of various power reforms that were introduced in the sector in ensuing years under the tenth and eleventh plans
The target acted as a guiding force, ensuring later in the form of Electricity Act, 2003, which opened up the generation sector by encouraging private sector participation. The transmission and distribution legs were provided fillip through distribution up-gradation and rural electrification programmes like APDRP, RGGVY. To achieve targets across various legs of the power sector, reform agenda were put in place in each aspect:
2. Transmission reforms targeted creation of national grid with focus on reducing cost of transporting power with minimal line losses.
3. Distribution focused on the system up gradation, theft/loss reduction and improving power quality.
The Electricity act 2003
Amongst some of the most covenants of the Electricity Act 2003 were freeing of power generation from the licensing requirements and elimination of the single buyer model for generation companies. This essentially dealt directly with one of the most important problem of credit security that was plaguing generation capacity addition by the private sector. These two important measures amongst others, resulted in higher incentives for the private sector to set up generation capacities. The Electricity Act 2003 proposed unbundling of SEBs into generation, transmission and distribution entities. This move resulted in cleaning up the act of SEBs by isolating the loss making units and enabling the generation SEBs to be credit worthy and hence take up generation capacity.
Addition of generation capacities resulted in significant growth opportunities for the generation equipment and project companies. Further the shoring up of generation capacities had a positive impact on transmission and distribution value chains.
One –time settlement 2003
To ensure the financial health of SEBs , GoI introduces a financial restructuring package that entailed writing off ~ 25% of outstanding dues (principal +interest) and issuing 15yrs bonds bearing coupon of 8.5% (tax free) by securities the balance dues. The scheme also set a landmark by forcing various states to sign MoUs with GoI, entailing reform-based performance milestones, failing which GoI would deduct allocation/ assistance to the respective defaulting state.
National tariff policy 2006
The objective of National Electricity Policy 2006 (NEP) was to ensure competitive tariff, financial turnaround and commercial viability of state utilities and providing electricity to India’s poor. The policy has set targets under each segment of power such as:
(1) adding 100 GW in 2002-12, ensuring at least one 33/11 KV substation in every block, so that at least one distribution transformer is installed in every village
(2) encourage renewable energy and renovate and modernization (R&M) programme (3) opening the sector for private participation
(4) Set the benchmark for cross subsidy level.
was a turning point for the Indian power reform. The tariff policy also recommended limiting cross subsidization up to 20% of the average cost of supply by FY11.
Reducing inefficiencies through APDRP
GOI introduced Power Development and reforms Programme (APDRP) in FY01 with outlay of INR 400 bn, to reduce T&D losses from 32% to 10% by FY07. Even as the scheme achieved limited success in terms of reducing T&D losses ( currently as 26.9%), funding through the scheme resulted in capital availability for the distribution utilities; the utilities , therefore , undertake distribution up-gradation projects, which enhanced their revenue visibility. As per APDRP, the central govt. was required to fund 50% of the total spending on T&D up-gradation (1:1 ratio of grant and loan), while SEBs were supposed to finance the balance through financial institutions or through their own funds.
In the second half of the Tenth plan period, the aforementioned policy actions brought about changes that had far reaching impact on the Indian power sector. Most importantly, they have driven capital into area like power generation and transmission, and opened up growth opportunities across the value chain.
POWER SECTOR: - OPPORTUNITIES
I. Opportunities for generation equipment
Assuming INR 50 mn/MW capex for a power plant, the BTG opportunity is likely be ~INR 4.25 tn (50% of the overall spend), which can be broadly split into 50:50 for boilers and turbine generators. Going ahead, during the Eleventh and Twelfth plans, India targets to add ~170 GW of generation capacity, thereby, creating huge market for equipment vendors. This implies growth of ~2x over FY97- 07. BHEL and Thermax have been key boiler manufacturers in India; BHEL, along with Siemens, has been a key player in turbine generators. BHEL, the largest equipment vendor in the country, has 10 GW annual BTG capacity. However according to the Eleventh Plan capacity addition targets, the BTG industry required to have an annual capacity of ~15 GW. Given this gap in demand and supply, imports will play a vital role in meeting this demand. Among the fore players, Chinese and Korean (Shanghai, Doosan, and Dong Fang) manufacturer have been particularly active in India due to their ability of executing standard 300 and 600 MW plants on lower time schedules and lower initial capex. Order backlog to sales, a growth indicator for BTG companies, is at an all-t high, implying huge growth in the BTG space, driven by capacity additional consequently, we are likely to see high margins and profitability for BTG companies at least over the Eleventh Plan period, until capacities continue to demand.
ORDER SECURED BY BHEL
(in Rs. crore)
18230 18938 35643 50270 59678
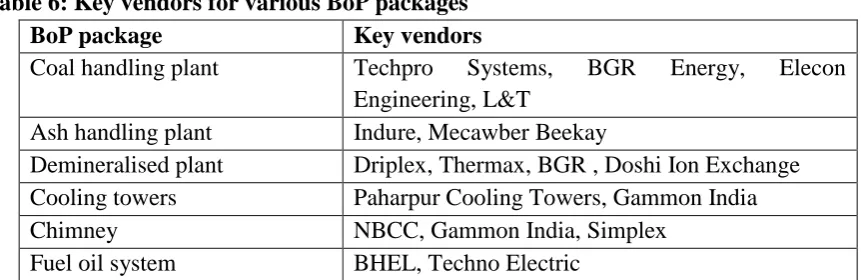
II. Opportunities for Contracting: Generation ( BOP and civil construction)
Apart from the main plant equipment (BTG), balance-of-plants (BoP) and civil contractors play an important role in execution of a power plant. In a typical power plant of INR 50 mn capex per MW, ~INR 17-18 mn is spent across various BoP packages. As detailed below, BoP mainly comprises the following six packages:-
Table 6: Key vendors for various BoP packages
BoP package Key vendors
Coal handling plant Techpro Systems, BGR Energy, Elecon Engineering, L&T
Ash handling plant Indure, Mecawber Beekay
Demineralised plant Driplex, Thermax, BGR , Doshi Ion Exchange Cooling towers Paharpur Cooling Towers, Gammon India Chimney NBCC, Gammon India, Simplex
Fuel oil system BHEL, Techno Electric
During the Eleventh and Twelfth plans, India targets to add ~170 GW, entailing BoP opportunity worth INR 2.9 tn (INR 17 mn per MW). Given the huge opportunity and limited number of players eyeing it, we are likely to see rapid revenue growth with stable margins over the medium term for BoP players. Across the seven packages, there are capacity constraints, most aggravated in the 'ash handling' package.
As per current dynamics of the BoP industry offers existing players an opportunity to scale up capacities. However, even as the opportunity exists, there is little capacity addition by various BoP vendors. This can be attributed to the low-end nature of BoP contractors, which results in higher bargaining power of core contractors. However, one of the trends observed in the BoP industry has been emergence of contractors, who take up all the six BoP packages and then further sub-contract them to various specialized BoP contractors like Punj Lloyd and BGR Energy. In the absence of specialised players like Techno Electric (specialised in fuel oil package) increasing capacities, we are likely to see full service BoP contractors benefitting from growth opportunities in the BoP segment.
III. Opportunities for Transmission equipment
North India have started drawing/consuming more power.
In India, power transmission comprises inter-regional grids (high voltage), state grids (medium voltage) and distribution grids (low voltage). The inter-regional grid is operated by PGCIL, while state and distribution grids are operated by their respective state transmission utilities or SEBs.
India has five regional grids. State grids are interconnected through high voltage transmission lines to form a regional grid, which facilitates power transfer between neighboring states. By FY12, regional grids are expected to be integrated to form a national grid, which is likely to result in transfer of power from power surplus regions to power deficit regions. The current inter-regional transmission capacity stands at 20,750 MW, and is expected to reach 37,150 MW by the end of the Eleventh Plan.
The requirement for inter-regional evacuation of power is likely to lead to the- setting up of a high-voltage circuit-based transmission grid. We believe the same is likely to be effective for lowering transmission losses and providing opportunity for the power transmission equipment suppliers. The total capital expenditure planned by PGCIL, state transmission utilities and the private sector is detailed in the table below:
Capital expenditure planned in power transmission sector
Total INR bn
10th Plan 11th Plan
Northern region 59.1 135.3
Western region 30.8 163.6
Southern region 82.4 151.1
Eastern region 74.7 160.8
North Eastern region 5.9 39.2
Central Sector 194.5 561.8
Private Sector - 190.0
Total 447.4 1,401.8
As detailed in Table, capacity expansion in the Eleventh Plan is likely to be in excess of 2.5X of the capacity expansion in the Tenth Plan. Thus, there is high growth opportunity for companies catering to the power transmission capacity build out. Investment in the power transmission system is equally divided amongst transmission lines and sub-stations. Based on Central Electricity Authority's (CEA) projections for the Eleventh Plan, the estimate for investment in each vertical of the power transmission space is shown below:
Power transmission spending across various components (INR bn)
Transmission lines FY08 FY09 FY10E FY11E FY12E
Conductors 43.8 66.7 77.1 66.9 60.8
Others 19.5 29.7 34.3 29.7 27.0
Substations
Transformers 29.2 44.5 51.4 44.6 40.6 Others 68.2 103.8 119.9 104.0 94.6 Total 194.9 296.7 342.7 297.2 270.4
In addition, there is significant investment in the power distribution sector, which will benefit companies in distribution of transformer, power cables and meters. The electricity distribution sector has been a laggard in terms of attracting investments, primarily due to poor financial health of the state distribution utilities and higher inefficiencies in the system. Outdated distribution network and lower automation level continue to result in high technical and commercial losses. The accumulated financial losses of most state distribution utilities have increased to INR 550 bn in FY05 from ~INR 300 bn in FY03. Though some states have gradually reduced their T&D losses, nationwide T&D losses stood at ~26.9% against 10-15% in developed countries. High AT&C losses and auxiliary consumption has resulted in only ~65% of the power bill recovered from consumers.
IV. Opportunities for distribution equipment and contracting
Distribution, due to its last mile connectivity and largely being under the control of state governments, has often been neglected. Moreover, since the tariff is regulated with an inherent subsidy component for the poorer section and agricultural customers, this power vertical has been a politically sensitive subject. Underinvestment in the space over the years has weakened the infrastructure, which, in turn, has resulted in high AT&C losses. To encourage state utilities in undertaking capex in this space, GoI introduced APDRP and Rajiv Gandhi Grameen Vidyutikaran Yojana (RGGVY) programmes. APDRP has been further modified to RAPDRP in the Eleventh Plan.
R-APDRP
together account for over 55% of the total amount sanctioned so far.
Rural electrification
As per CEA, over 82% villages have been electrified as on date. GoI launched RGGVY in April 2005, with the goal of electrifying all (around 125,000) un-electrified villages and hamlets and providing electricity to all households in next five years. Under RGGVY, 59,882 villages have already been electrified and electricity connections had been provided to 5.4 mn below poverty line (BPL) households as on March 2009. Both RAPDRP and RGGVY schemes are aimed at upgrading the distribution infrastructure across rural and urban India. Capex for the same is likely to be undertaken by the state and private distribution utilities with assistance from GoI through these schemes. Consequently, there is likelihood of huge opportunity for the equipment and project companies targeting distribution.
POWER SECTOR: - CHALLENGES
Opportunities in the power sector across various segments are immense and are likely to remain so over the Eleventh and Twelfth plan periods. However, since 2003, a few challenges have emerged for the sector, compelling us to analyze opportunities in view of these hassles. Even as the fundamental story of the power sector has been on a strong wicket over the past three years, it is time to ascertain if there are any roadblocks for the sector over the medium-to-long term.
While the macro outlook for power looks robust, the following factors could hinder growth:-
a) Concurrent nature of power, entailing huge political will for success:
Power is a concurrent subject. Though policy formulation may happen at the central level, its implementation lies with states. Unlike the telecom sector, in power, the success or failure of implementation depends largely on the will of the ruling government at the state level to bring about reforms. Power is a highly politicized subject and often has a bearing on the outcome of elections. More often than not, reforms take a backseat, given the political nature of the sector. Most, importantly, in most cases state utilities control distribution assets along with access to end customers. Tariff for different consumer categories is determined by the respective state electricity regulator based on fixed RoE norms. Since the hike in tariff has not kept pace with the cost of supplying power, losses have been rising for distribution utilities.
Year wise cost and realization of supplied power
Year Cost of supply
paise/ KWh
Realisation paise/ KWh
Only agri paise/ KWh
Loss
paise/ KWh
FY02 246 181 59 65
FY03 238 195 77 43
FY04 239 203 72 36
FY06 258 221 79 37
FY07 276 227 71 49
FY08 290 232 71 58
One of the main reasons why state governments have been hesitant in hiking the agriculture/domestic tariff is that this segment forms the largest part of their vote banks. Consequently, tariffs are far higher for industrial users, forcing them to set-up captive power plants. If this trend continues, it could damage state financials further as industrial customers, who bore the brunt of high tariff, are going away (captive), leading to higher subsidy funding by state governments.
By analysis of results of the assembly elections in recent times. It shows that states that have done reforms and have brought down T&D losses, have a higher chance of being voted back to power.
This is contrary to the common belief that by giving free/subsidised power to agricultural and domestic segments, the ruling government has a higher chance of being voted back to power.
The increased awareness on access to electricity being an important need of poor should help garnering political will. Along with capacity additions, higher spend on T&D infrastructure and benchmarking distribution losses will help sustaining growth in the power sector.
b) Financial health of SEBs:
Historically, the power sector has been plagued by de payments by SEBs - the largest and sole entities having access to end consumers one-time settlement scheme of 2003 ensured that all historic debts are convert deferred loans, which helped in financially restructuring SEBs. However, fiscal discipline continues to be an issue, as depicted by the aggregate losses of SEBs (without subsidy) of ~INR 275 bn and outstanding receivables of INR 474 bn (36% of revenues).
Lack of fiscal discipline at distribution utilities' end, which essentially have access to end consumers, could derail the entire power reform process, rendering current growth and returns expectations for the sector unsustainable.
d) Access to fuel, land and water:
Most projects, going forward, are likely to be on competitive basis. Access to fuel, land and water are critical to complete projects on time, remaining competitive at the same time. These three elements are available at nominal costs today. Our interactions with industry sources, however, highlighted that their requirement is likely to significantly increase in the Twelfth Plan period. Sourcing them at reasonable prices could be a key hurdle. Any delay in execution may not only result in higher project costs, but could also risk penalty payments; since tariffs are predetermined, returns could be significantly hit.
Requirements for 1 MW thermal power plant
FY0 6 (89)
Land Water Fuel
Coal 0.8 - 1.4 acres 29 mn Itrs p.a. 3 - 5,000 tonnes p.a. Gas ~0.1 acres 10 mn Itrs p.a 0.005 mmscmd p.a.
Coal supplies from Coal India is expected to increase from ~400 MT to 520 MT by FY12E, resulting in a shortfall of ~82 MT for coal-fired power plants; the deficit is expected to be met through imports. Looking at the potential shortfall of coal in the coming years, many companies have started looking for coal in countries like Indonesia to meet their requirements. Even companies like NTPC have started importing coal (imports in FY09 - 2.5 mn tonnes; FY10E - 12.5 mn tonnes) to meet coal requirement at their existing plants. GoI, taking cognizance of the gravity of the situation, has started allotting coal mines to the private sector so that mining of the crucial mineral can happen at a faster pace.
Based on gas utilization policy announced by the government, the power sectorIs expected to get ~70 mmscmd of the incremental ~147 mmscmd (253 less 107).India's natural gas production is expected to increase from ~107 mmscmd to ~253 mmscmd by 2015, with bulk of the incremental supplies coming from RIL's KG D6 block.
Until last year, the entire gas-based capacity (14.77 GW) was operating at 57.6% plant load factor (PLF) due to inadequate gas supplies. Post commencement of gas production from KG basin, their PLF has improved to ~70%. While this PLF is expected to rise in future, new capacities can be set up only to the extent of ~13 GW, which could take India's total gas-based capacity to ~31 GW. Hence, the government needs to work on a comprehensive fuel plan to ensure that utilities are able to meet their capacity addition targets.
d) Regulatory risks:
CERC is the regulatory body that sets benchmark norms, which various states could adopt with minor changes post approval. Since most of the existing power projects are regulated and it is expected that T&D utilities to continue to be regulated over the foreseeable future, any change in norms that would impact returns (15.5% RoE currently) could impact earnings if the same is not offset through scope for efficiency gains.
e) Equipment supplies:
In recent times, quite a few projects have got delayed due to delayed equipment delivery across BTG and BoP segments. Select equipment suppliers like transformers manufacturers have increased capacity, but most of the other equipment suppliers (BTG and BoP) are yet to increase their manufacturing capacity. While in the interim, developers are resorting to imports, equipment supply is expected to be a cause for concern for developers across the vertical.
f) Intellectual property rights:
companies have raised the issue of intellectual property rights violation. Though the same is at an early stage, concerns over it could impact capacity addition program.
g) Carbon emissions:
India is amongst the top polluters of C02 in the world on an absolute basis due to emissions from its ~ 90 GW coal-based power generation plants. Going forward, with majority of the incremental capacity addition of 170 GW also being coal based, the emissions are going to increase significantly. With increasing pressure on countries like India and China to control emissions and take precautionary measures, any form of stricture or charge could impact power generation companies
FINANCE - SELECTIVE INVESTMENT IN GOOD PROJECTS
The current financial crisis has had a wide-ranging impact on the Indian economy. The liquidity crunch has hurt capital-constrained companies which are finding it tough to raise long-term capital. Although the government has initiated a number of steps such as a cut in key interest rates to ease capital, investors continue to be cautious. Experts believe that such steps will gradually have a positive impact on the economy. Funding trends in the power sector along with the impact of the financial crisis is analyzed as below:-
a) Debt
Domestic commercial banks continue to be the biggest financiers. The enabling policy framework for investments, focus on moving towards competitively bid projects and the economic growth, have led banks to take higher exposure in infrastructure, especially in the power sector.
As of March 2008, the gross bank credit to the power sector stood at Rs. 938.99 billion, accounting for the highest share at 46.4 per cent of the total outstanding to the infra-structure sector. The gross credit outstanding to the power sector has grown at an annual rate of about 29.1 percent since 2003-04 to reach Rs 938.99 billion at the end of March 2008. During the same period, bank out standings to the industry also grew by around 29.2 per cent.
Most of the lending by banks and non-banking finance companies (NBFCs) has been skewed towards generation projects. However, with the opening up of the transmission and distribution segment, commercial lending is expected to improve in such segments particularly as private sector players come in.
accounts and charge over cash flows from the project.
The lending rates are linked to prime lending rates (PLRs) and are in the range of 12-13 per cent with interest rates resets after one to three years and average maturities of 13-14 years. In a few hydro projects, commercial banks have extended tenors to about 20 years as well. In the recent past, PLRs reached as high as 14-15 per cent making private investment in infrastructure projects less profitable. Although, interest rates are steadily coming down, banks have been reluctant to bring down interest rates in line with the cut in key rates by the Reserve Bank of India (RBI) as banks continue to adopt a cautious stance.
Commercial banks' exposure to the power sector is restricted by RBI's sectoral caps, group exposure norms, etc. and by issues of asset-liability mismatch.
Specialised NBFCs such as the Power Finance Corporation (PFC) and Rural Electrification Corporation (REC) are also active in funding power projects. However, their disbursements have been skewed towards state utilities. Disbursements by PFC have grown at an annual rate of 19 per cent since 2004-05 to reach Rs 210.54 billion in 2008-09. REC's disbursements have registered an annual growth of 27 per cent to reach Rs 163.03 billion as of 2007-08.
The bond market for funding has been primarily resorted to by central sector undertakings such as NTPC Limited, PFC and REC. The bonds are generally subscribed by provident and pension funds, gratuity trusts, insurance companies, mutual funds, individuals, etc. Interest rates on such bonds have ranged between 6 and 7 per cent with tenors of 7-8 years.
The underdeveloped bond market is characterised by lack of liquidity. The limited appetite for long-term issues hampers the ability of private sector companies to raise funds. Typically, there is an absence of investment grade paper resulting in high cost of funds. Moreover, funds mobilised have to be utilised immediately in order to optimise costs and no flexibility is allowed in prepayment.
As per Prime Database, there were seven bond issues in the power sector raising about Rs 34.7 billion during 2007-08. This accounted for about 19 per cent of the total amount mobilised through the bond route in the infrastructure sector.
Insurance and pension funds have been investors in the sector. Their investments are governed by their respective regulatory bodies - the Insurance Regulatory and Develop-ment Authority and Pension Fund Regulatory DevelopDevelop-ment Authority. The long-term nature of such funds generally fits the requirement of longer-tenor funds for power projects.
The biggest life insurer investor has been the Life Insurance Corporation of India. During 2007-08, it invested Rs 70.22 billion by way of loans and debentures to the power sector, which decreased from Rs 96.15 billion in 2006-07.
It is generally felt that in order to increase long-term funds to the sector, insurance and pension funds should come into the sector in a more robust manner and take exposure through take-out financing and other measures.
preferred route. Although RBI has undertaken policy reforms for infrastructure companies raising funds through the ECB route, the amount raised through ECBs/foreign currency convertible bonds (FCCBs) in the power sector declined in 2008-09 to $2.27 billion against $2.7 billion raised in 2007-08.
However, the amount raised through ECBs has grown at an annual rate of 17 per cent during the period 2004-05 to 2008-09. This is due to the fact that ECBs have been a relatively cheaper source of finance in comparison to domestic bank credit as overseas loans are usually linked to Libor.
Multilateral institutions such as the World Bank, Asian Development Bank (ADB), International Finance Corporation, etc. have provided assistance in the form of loans, grants and technical assistance to aid reforms. For instance, the World Bank has funded state reforms in Orissa, Haryana, Uttar Pradesh, Rajasthan and Madhya Pradesh. In March 2008, both the World Bank and ADB provided $600 million loan to Power Grid Corporation of India Limited for its expansion projects. .
Export credit agencies (ECAs) provide financial assistance to power companies for acquiring equipment and supporting expansion. The ECAs normally provide cover up to 85 per cent of the value of imported equipment. ECAs normally finance import of equipment from their home country. For instance, in April 2008, the Export Import Bank of Korea agreed to lend $500 million for the Mundra ultra mega power project (UMPP). Further, Chinese Exim Banks have also committed to lend up to $1 billion for the Sasan UMPP. In addition, the US Exim Bank has extended a $2.45 billion credit line to India for import of capital equipment from the US for infrastructure projects including power.
b) Equity
Private equity (PE) investors have shown active interest, particularly in the generation and equipment segments. According to India Infrastructure Research, over the period January 2004-May 2008, the sector witnessed over 25 private equity deals, which were over Rs 100 million each in value terms. Some of the key deals were 3i Group's stake in Adani Power where the former acquired 8 per cent stake in the latter for Rs 9 billion, and the investment of LN Mittal Ventures and Farallon Capital in India bulls Power where LN Mittal Ventures acquired 28.6 per cent stake for Rs 15.79 billion.
The current downturn has impacted valuations adversely. According to industry experts, valuations have come down from about Rs 40 million per MW to about Rs 10-20 million per MW. Further, falling valuations have resulted in a gap between promoters' and investors' expectations. Expectations of both parties need to align for deal flow.
With hindsight, the fall in valuations also presents an opportunity for private/project equity investors to invest at lower valuations as demonstrated by rising PE investments. PE investments in the power sector have risen from Rs 1.87 billion in 2006, to reach Rs 17.55 billion in 2007 and further to Rs 39.52 billion in 2008.
(lPOs). According to India Infrastructure Research, during the period January 2004July 2008, 19 power companies raised a total of Rs 270.2 billion. Of the total amount raised, 69 per cent was in the generation segment, 11 per cent in the transmission segment and about 20 per cent in the equipment and financing sector.
In the present scenario, raising funds through IPOs has become a remote possibility as investors have become riskaverse and the fall in valuations has impacted the fund-raising potential through stake dilution. Not surprisingly, companies such as NHPC Limited, Adani Power and Jaiprakash Power Ventures have put their IPO plans on hold due to adverse market conditions.
Power companies have also raised funds through qualified institutional placement (QIP) issues. QIP is a faster mechanism as it involves less disclosures and does not involve a pre-issue filing with the regulator. Companies which raised funds through QIPs include PTC India Limited, GMR Infrastructure Limited, CESC Limited and Suzlon Energy Limited. Together these companies raised about Rs 79.39 billion during 200708. Raising funds through QIPs is primarily dependent on market conditions. A revival in the equity markets will help.
On the whole, the crisis has led investors to adopt a cautious approach. But well-structured projects backed by promoters with a strong background continue to attract funding as demonstrated by the financial closure of the Sasan UMPP. However, investors such as insurance and pension funds need to enter in a larger way for the availability of long-tenor funds along with the development of domestic bond markets and take-out financing structures. This will bring in much more funding options for project developers and liquidity for project equity investors
FINANCIAL ANALYSIS OF MAJOR PLAYER IN POWER SECTOR
Power sector can be classified in different ways.
One way is to classify the use of energy source to generate power i.e. conventional (thermal, Hydo and nuclear) and non conventional (i.e. solar, wind and geothermal etc..) source of energy. In thermal power generation may further classified as coal based or gas based power generation.
My study to analyze the financial aspect of the power sector so accordingly I have classified power sector based on business model available in power sector that are
1. Power utility business i.e. power generation, transmission and distribution 2. Power plant equipment manufacturing business
3. Engineering, Procurement and Construction (EPC) business for installing new power plant.
GVK etc..Companies selected in equipment manufacturing companies are BHEL, Thermax and siemens India.
Companies selected for EPC business are BGR and Lanco etc.
All the companies who are in equipment manufacturing are also involved in EPC business. The Idea is to provide the total solution to the customer instead of supply only equipment for the power plant. Very few are available who is in sole business of EPC.
Here we compare the different financial ratio of different groups of companies.
A) Profitability Ratios:- Gross Profit margin (GPM):-
An indication of the total margin available to cover the operating expenses and yield a profit. Gross Profit margin (GPM) = (Sales – cost of goods sold) / sales
A high GPM helps to cover business’s operating expenses and invest in areas that create even greater business growth, such as marketing and research and development. A low GPM shows that little of the sales revenue is available to cover operating expenses.
GPM as an early sign that an increase in COGS is eroding your ability to remain profitable.
To increase your business’s GPM, you can use a combination of approaches:
Increase the number of units sold (sales volume).
Reduce elements of COGS. To do this, substitute cheaper materials, use less labor, and so on.
Raise prices. Divide COGS by GPM to find the current markup. Try different markups in the equation until GPM reaches the desired level
Power utility companies
Gross Profit margin (GPM):-
2004-05 2005-06 2006-07 2007-08 2008-09 AVERAGE
TATA
POWER 0.42 0.35 0.28 0.28 0.27 0.32 NTPC 0.36 0.38 0.36 0.36 0.30 0.35 NPCL 0.61 0.57 0.59 0.56 0.42 0.55 GVK 0.64 0.69 0.56 0.78 0.72 0.68
JP 0.96 0.96 0.96 0.95 0.96
Torrent
Power 0.16 0.11 0.13 0.15 0.13 Reliance Infra 0.23 0.22 0.17 0.17 0.16 0.19 AVERAGE 0.45
Power plant equipment manufacturing companies
Gross Profit margin (GPM):- AVERAGE
2004-05 2005-06 2006-07 2007-08 2008-09
BHEL 0.26 0.23 0.25 0.25 0.20 0.24
Thermax 0.20 0.21 0.21 0.21
Siemens 0.17 0.17 0.14 0.12 0.15 AVERAGE 0.20
Gross profit of BHEL is better than any other power plant equipment manufacturing companies.
Power Plant EPC - Companies
Gross Profit margin (GPM):- AVERAGE
2004-05 2005-06 2006-07 2007-08 2008-09
Gross Profit margin
0.20 0.30 0.40 0.50 0.60 0.70 0.80 0.90 1.00 1.10
2004-05 2005-06 2006-07 2007-08 2008-09
Tata Power NTPC NPCL GVK
JP Power Torrent Power Reliance Infra
Gros s Profit Margin
0.00 0.05 0.10 0.15 0.20 0.25 0.30
2004-05 2005-06 2006-07 2007-08 2008-09
BGR 0.18 0.20 0.16 0.18 0.18 Lanco 0.52 0.41 0.22 0.22 0.33 0.34
AVERAGE 0.26
Gross profit of Lanco is better than BGR
If we compare GPM of these three groups of companies we find that GPM of power utilities companies is much better than other group of companies.
Operating Profit margin (OPM):-
An indication of the firm’s profitability from the current operation without regard to the interest charges accruing from the capital structure.
Operating Profit margin (OPM) = (Profit before taxes and before interest) / sales
Power utility companies
Operating Profit margin (OPM) AVERAGE
2004-05 2005-06 2006-07 2007-08 2008-09
TATA
POWER 0.25 0.19 0.17 0.16 0.16 0.19 NTPC 0.30 0.39 0.31 0.31 0.26 0.32 NPCL 0.60 0.56 0.51 0.54 0.40 0.52 GVK 0.54 0.59 0.36 0.51 0.37 0.47
JP 0.94 0.93 0.93 0.92 0.93
Torrent
Power 0.12 0.07 0.09 0.12 0.10 Reliance Infra 0.17 0.21 0.11 0.11 0.07 0.13 AVERAGE 0.38
Operating profit of JP power is much better than any other power utility companies. The reasons of the same are that JP power is in hydro power and cost of power generation in hydro is very less.
Gross Profit Margin
0.00 0.10 0.20 0.30 0.40 0.50 0.60
2004-05 2005-06 2006-07 2007-08 2008-09
Power plant equipment manufacturing companies
Operating Profit margin (OPM) AVERAGE
2004-05 2005-06 2006-07 2007-08 2008-09
BHEL 0.15 0.21 0.24 0.21 0.16 0.20
Thermax 0.13 0.15 0.11 0.13
Siemens 0.12 0.13 0.11 0.10 0.12 AVERAGE 0.15
Operating profit of BHEL is better than any other power plant equipment manufacturing companies.
Power Plant EPC - Companies
Operating Profit margin (OPM) AVERAGE
2004-05 2005-06 2006-07 2007-08 2008-09
BGR 0.00 0.11 0.10 0.11 0.08 Lanco 0.51 0.40 0.21 0.21 0.16 0.30
AVERAGE 0.19
Operating profit of Lanco is better than BGR.
Ope rating Profit m argin
0.00 0.20 0.40 0.60 0.80 1.00
2004-05 2005-06 2006-07 2007-08 2008-09
Tata Power NTPC GVK
JP Power Torrent power Reliance Infra
Operating Profit Margin
0.00 0.05 0.10 0.15 0.20 0.25 0.30
2004-05 2005-06 2006-07 2007-08 2008-09
If we compare OPM of these three groups of companies we find that OPM of power utilities companies is much better than other group of companies.
Net profit Margin (NPM)
It shows after tax profits per Rupees of sales
Net Profit margin (NPM) = (Profit after taxes) / sales
Power utility companies
Net profit Margin (NPM) AVERAGE
2004-05 2005-06 2006-07 2007-08 2008-09
TATA
POWER 0.14 0.13 0.15 0.15 0.13 0.14 NTPC 0.26 0.22 0.21 0.20 0.19 0.22 NPCL 0.51 0.48 0.44 0.31 0.15 0.38 GVK 0.24 0.34 0.35 0.76 0.47 0.43
JP 0.17 0.52 0.61 0.69 0.50
Torrent
Power 0.05 0.05 0.06 0.09 0.06 Reliance
Infra 0.13 0.16 0.14 0.18 0.12 0.15 AVERAGE 0.27
Net profit of JP power and NPCL is much better than any other power utility companies.
Operating Profit Margin
0.00 0.20 0.40 0.60
2004-05 2005-06 2006-07 2007-08 2008-09
Power plant equipment manufacturing companies
Net profit Margin (NPM) AVERAGE
2004-05 2005-06 2006-07 2007-08 2008-09
BHEL 0.09 0.12 0.13 0.13 0.11 0.12 Thermax 0.06 0.08 0.09 0.09 0.09 0.08 Siemens 0.09 0.08 0.07 0.07 0.08 AVERAGE 0.09
Net profit of BHEL is better than any other power plant equipment manufacturing companies.
Power Plant EPC - Companies
Net profit Margin (NPM) AVERAGE
2004-05 2005-06 2006-07 2007-08 2008-09
BGR 0.05 0.05 0.06 0.06 0.05 Lanco 0.06 0.06 0.14 0.19 0.10 0.11
AVERAGE 0.08
Net Profit of Lanco is better than BGR
Net Profit margin
0.00 0.10 0.20 0.30 0.40 0.50 0.60 0.70 0.80
2004-05 2005-06 2006-07 2007-08 2008-09
Tata Power NTPC NPCL GVK
JP Power Torrent power Reliance Infra
Net profit margin
0.00 0.05 0.10 0.15
2004-05 2005-06 2006-07 2007-08 2008-09