SVD Based Blind Video Watermarking Algorithm
Pavani C., M. Murali Krishna
Pavani C. is Assistant Professor, Dept of ECE, Kommuri Pratap Reddy Institute of Technology,e-mail:[email protected] M. Murali Krishna is Junior Engineer, Medha Servo Drives Pvt Ltd
Abstract: In this project, we show that an image can be reconstructed using local descriptors, with or without complete geometrical metadata in LAB VIEW. We use greedy algorithms to progressively learn the missing information before reconstruction and colorization is performed .Our experiments show that most of the vital information about a query image can be recovered even if scale metadata is missing. Compared to images reconstructed with scale information, we find that there is no significant decline in image quality, and a close resemblance of the original image post-processing step. Lab VIEW (laboratory Virtual Instrumentation Engineering Workbench). Lab VIEW is a Graphical Programming Language. It contains icons rather than lines of text. In contrast to text-based programming languages, where instructions determine program execution, Lab VIEW uses dataflow programming, where the flow of data determines execution. As the world becomes increasingly digitalized, it has become intractable to naively search for images merely using pixel information. As such, researchers have been looking for more efficient methods to perform image matching and retrieval.
Keywords: Lab VIEW, GPIB, PXI, SIFT, SURF, VXI
I. Introduction:
1.1 What is lab view?
LAB VIEW refers to Laboratory Virtual Instrument Workbench. Lab VIEW is a Graphical Programming Language. It contains icons rather than lines of text. In Lab VIEW, you build a user interface with a set of tools and objects. The user interface is known as the front panel. Youthen add code using graphical representations of functions to control the front panel objects. The block diagram contains this code. Lab VIEW contains a comprehensive set of tools for acquiring, analyzing, displaying, and storing data, as well as tools to help you troubleshoot code you write. You can use a flowchart Lab VIEW to communicate with hardware such as data acquisition, vision, and motion control devices, as well as GPIB, PXI, VXI, RS232, and RS485 instruments .It is the product of NATIONAL INSTRUMENTS (NI).
1.2 Overview of Lab View
As the world becomes increasingly digitalized, it has become intractable to naively search for images merely using pixel information. As such, researchers have been looking for more efficient methods to perform image matching and retrieval. Successful and widely used methods have relied on local descriptors such as the Scale Invariant Feature Transform local descriptors such as the Scale Invariant Feature Transform local descriptors provide valuable information about regions of the image –key points that contain a lot of details. A set of local descriptors with corresponding geometrical significantly reducing
database, and then image recovery could be desirable. Visual search could take a huge step forward if databases could use query information to enhance their repository. For example, when different users submit queries for a landmark from different angles, this information could be used to reconstruct a multi view or even a three-dimensional image of that landmark. In this project, we investigate the image quality attainable via image reconstruction using square patches with SIFT and SURF descriptors. We also expand upon the image reconstruction Problem, and investigate the feasibility of reconstructing images using descriptors with incomplete geometrical information. Geometrical information which typically includes the (x, y) coordinates; orientation and scale of the image patches are used for post verification during visual search, and can be used for the accurate placement and warping of patches from the database during image reconstruction. It would be of interest to investigate how much reconstruction would still be possible with partial information. We narrow down the problem to descriptors lacking information about the scales of image patches, and examine how well the scales can be learned, as well as the resulting image quality. We use a greedy algorithm and progressively learn the scales of the image patches, before reconstruction is performed. As we might expect, reconstruction is far from perfect, but vital information about the image can still be inferred from the image. Upon comparison with images reconstructed with full geometrical information, it is important to note that most of the information of an image is still retained even though the descriptors do not contain data about the scales of image patches. So much information is kept that it is possible to recognize the features in the image and reproduce a close replica of the original image by subsequently coloring the image. This paper is organized as follows; Section II outlines the problem statement. In Section III we explain the main reconstruction and colorizing algorithms; Section IV details the greedy algorithm we used for learning the scales of patches. Section V then summarizes some of the experiments we did and discusses possible improvements.
1.3 Why we use lab view
NI Lab VIEW is a graphical programming language designed for engineers and scientists to develop test, control, and measurement applications. The intuitive nature of Lab VIEW graphical programming makes it easy for educators and researchers to incorporate the software in a range of courses and applications. With Lab VIEW, educators and researchers can use a graphical
system design approach to design, prototype, and deploy embedded systems. It combines the power of graphical programming with hardware to dramatically simplify and accelerate the development of designs. Graphical system design is a modern approach to designing, prototyping, and deploying embedded systems. It combines open graphical programming with hardware to dramatically simplify development.
II. Virtual Instruments (VIs): Lab VIEW programs are called as Virtual Instruments because the icons appearance and operation imitate actual Instruments like switches and meters. VI contains three main components
2.1 Front Panel:
Front panel is the user interface of VI. It contains controls and indicators. Controls are like inputs that supply data to the block diagram and indicators are like outputs that display the data which will be generated by the block diagram.
Fig1: Front Panel
2.2 Block Diagram:
The code of the program is present on the block diagram and it resembles a flowchart. It defines the functionality of the VI. Block diagram objects include terminals, functions, constants, wires etc.
Fig2: Block Diagram
2.3 Icon and Connector Pane:
text and images. If you use a VI as a sub VI, the icon identifies the sub VI on the block diagram of the VI. The default icon contains a number that indicates how many new Vis you opened after launching Lab VIEW.
Fig4: Icon
To use a VI as a sub VI, you need to build a connector pane, shown above. The connector pane is a set of terminals that corresponds to the controls and indicators of that VI, similar to the parameter list of a function call in text based programming languages. Access the connector pane by right-clicking the icon in the upper right corner of the front panel window. You cannot access the connector pane from the icon in the block diagram window
Fig5: Connector Pane
III. Blocks of Lab View
3.1 What makes up Lab View
Lab VIEW itself is a software development environment that contains numerous components, several of which are required for any type of test, measurement, or control application.
Figure6: Lab VIEW contains several valuable components
To quote one of our software developers, “We write low-level code so you don’t have to.” Our global team of developers continually works on the six areas called out in Figure 1 to free you, the Lab VIEW user, up to focus on the bigger problems and tasks you are trying to solve.
IV.
G Programming Language
The G programming language is central to Lab VIEW; so much so that it is often called “Lab VIEW programming.” Using it, you can quickly tie together data acquisition, analysis, and logical operations and understand how data is being modified. From a technical standpoint, G is a graphical dataflow language in which nodes (operations or functions) operate on data as soon as
it becomes available, rather than in the sequential line-by-line manner that most programming languages employ. You lay out the “flow” of data through the application graphically with wires connecting the output of one node to the input of another. The practical benefit of the graphical approach is that it puts more focus on data and the operations being performed on that data, and abstracts much of the administrative complexity of computer programming such as memory allocation and language syntax. New programmers typically report shorter learning curves with G than with other programming languages because they can relate G code to flow charts and other familiar visual representations of processes. Seasoned programmers can also take advantage of the productivity gains by working at a higher level of abstraction while still employing advanced programming practices such as object-oriented design, encapsulation, and code profiling.
Figure7: This block diagram shows self-documenting G code.
Lab VIEW contains a powerful optimizing compiler that examines your block diagram and directly generates efficient machine code, avoiding the performance penalty associated with interpreted or cross-compiled languages. The compiler can also identify segments of code with no data dependencies (that is, no wires connecting them) and automatically split your application into multiple threads that can run in parallel on multi core processors, yielding significantly faster analysis and more responsive control compared to a single-threaded, sequential application. With the debugging tools in Lab VIEW, you can slow down execution and see the data flow through your diagram, or you can use common tools such as breakpoints and data probes to step through your program node-by-node.
V. Hardware Support
Figure 8: Lab VIEW connects to almost any hardware device.
Lab VIEW makes the process of integrating hardware much easier by using a consistent programming approach no matter what hardware you are using. The same initialize-configure-read/write-close pattern is repeated for a wide variety of hardware devices, data is always returned in a format compatible with the analysis and reporting functions, and you are not forced to dig into instrument programming manuals to find low-level message and register-based communication protocols unless you specifically need to. Lab VIEW has freely available drivers for thousands of NI and third-party hardware. In the rare case that a Lab VIEW driver does not already exist, you have tools to create your own, reuse a DLL or other driver not related to Lab VIEW, or use low-level communication mechanisms to operate hardware without a driver. Chances are if the hardware can be connected to a PC, Lab VIEW can talk to it. The cross-platform nature of Lab VIEW also allows you to deploy your code to many different computing platforms. In addition to the popular desktop OSs (Windows, Mac, and Linux), Lab VIEW can target embedded real-time controllers, ARM microprocessors, and field-programmable gate arrays (FPGAs), so you can quickly prototype and deploy to the most appropriate hardware platform without having to learn new tool chains.
VI.
UI Components and Reporting
Tools
Every Lab VIEW block diagram also has an associated front panel, which is the user interface of your application. On the front panel you can place generic controls and indicators such as strings, numbers, and buttons or technical controls and indicators such as graphs, charts, tables, thermometers, dials, and scales. All Lab VIEW controls and indicators are designed for engineering use, meaning you can enter SI units such as 4M instead of 4,000,000, change the scale of a graph by clicking on it and typing a new end point, export data to tools such as NI diadem and Microsoft Excel by right-clicking on it, and so on.
Figure 9: Every Lab VIEW block diagram has an associated front panel, such as this signal
generation example with custom UI. Controls and indicators are customizable. You can add them either from a palette of controls on the front panel or by right-clicking on a data wire on the block diagram and selecting “Create Control” or “Create Indicator.” In addition to displaying data as your application is running, Lab VIEW also contains several options for generating reports from your test or acquired data. You can send simple reports directly to a printer or HTML file, programmatically generate Microsoft Office documents, or integrate with NI Diadem for more advanced reporting. Remote front panels and Web service support allow you to publish data over the Internet with the built-in Web server.
fig 10: Image Reconstruction block diagram
VII. Screen Shots
7.1 Front Panel:
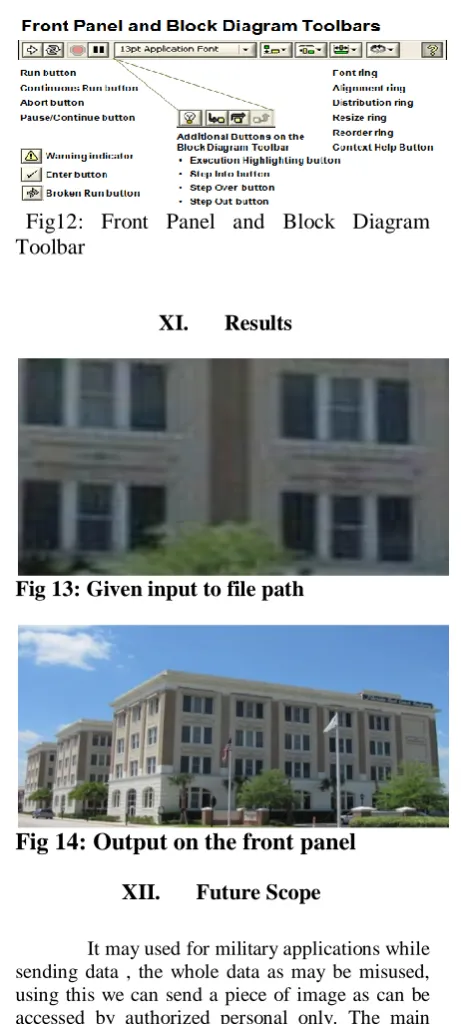
Below diagram is front panel of this project. In this we are giving some part of the building and getting the exact building, if it is in that building the Indicator (LED) will be blink, otherwise it will be off position.
VIII. Building and Configuring the Front
Panel
8.1 Introduction:
VI. Indicators simulate instrument output devices and display data the block diagram acquires or generates.
8.2 Building the Front Panel:
Select Window» Show Controls Palette to display the Controls palette, then select controls and indicators from the Controls palette and place them on the front panel. Front panel is the user interface that contains controls and indicators.
Fig11 : Control Palette
IX. Building the Block Diagram
After you build the front panel, you add code using graphical representations of functions to control the front panel objects. The block diagram contains this graphical source code. Front panel objects appear as terminals on the block diagram. Double-click a block diagram terminal to highlight the corresponding control or indicator on the front panel. Terminals are entry and exit ports that exchange information between the front panel and block diagram. Data you enter into the front panel controls enter the block diagram through the control terminals. During execution, the output data flow to the indicator terminals, where they exit the block diagram, reenter the front panel, and appear in front panel indicators. Objects on the block diagram include terminals, nodes, and functions. You build block diagrams by connecting the objects with wires.
X.
Running and Debugging VIs
To run a VI, you must wire all the sub VIs, functions, and structures with the data types the terminals expect. Sometimes a VI produces data or runs in a way you do not expect. You can use Lab VIEW to configure how a VI runs and to identify problems with block diagram organization or with the data passing through the block diagram. Running a VI means executing the block diagram code.
Fig12: Front Panel and Block Diagram Toolbar
XI. Results
Fig 13: Given input to file path
Fig 14: Output on the front panel
XII. Future Scope
It may used for military applications while sending data , the whole data as may be misused, using this we can send a piece of image as can be accessed by authorized personal only. The main scope is it can be used archeological department for recollection of the shape of various things which are destroyed to some extent.
XIII. Conclusion
geometrical met data sample i.e. small part of the original image to be reconstructed which is present in the database. The whole reconstruction process is carried out by an IMAGE ACQUIRE (IMAQ) technique which subsequently performs the IM AQ Learn Color Pattern and the IMAQ Setup Match Color Pattern. The whole thing is Boolean function and carried out in software called Lab VIEW. Thus after the technique is performed the original image from the database is reconstructed using the samples and this output is obtained from the output block IMAQ read file if and only if the number matching data of the image sample perfectly matches with the image in data base. There are several applications in image reconstruction technique such as, remote sensing via satellite, military communication via aircraft, radar, teleconferencing, and facsimile transmission, for educational & business documents, medical images that arise in computer tomography etc.
XIV. Acknowledgement
We take this opportunity to tank all who have rendered their full support to my project work. Again we take the unique privilege to express my thanks to Mr. R. Srinivasa Rao, Internal Guide, for his valuable guidance and encouragement given to me through this project work. Finally, we extend my thanks to all the people, who have helped me a lot directly or indirectly in completion of this project.
References
[1]. Tinku Acharya and A joy K. Ray (2006). Image processing - principles and Applications.
[2]. Tony F. Chan and Jackie (Jian hong) Shen (2005). Image processing and Analysis.
[3]. Milan Sonka, Vaclav Hlavac and Roger Boyle (1999). Image processing, Analysis, Machine vision.
[4] www.wikipedia.org [5] www.howstuffworks.com [6] www.alldatasheets.com
Authors:
C. Pavani Reddy received her B.Tech from G. Narayanamma Institute of Technology and Science, Hyderabad (near Shaikpet), Telangana in 2001. She completed her M.E from Osmania University, Hyderabad, Telangana in 2009. Presently she is working as Assistant Professor (ECE department) in kommuri pratap reddy institute of technology, Hyderabad, Telangana. Her area of interest is microprocessors and microcontrollers, signal processing, Image Processing, embedded systems, vlsi and microelectronics.