O R I G I N A L R E S E A R C H
Open Access
Using
31
P-MRI of hydroxyapatite for bone
attenuation correction in PET-MRI: proof of
concept in the rodent brain
Vincent Lebon
1,2*, Sébastien Jan
3,4, Yoann Fontyn
3,4, Brice Tiret
1,2, Géraldine Pottier
3,4, Emilie Jaumain
3,4and Julien Valette
1,2* Correspondence:
1Commissariat à l’Energie Atomique
et aux Energies Alternatives (CEA), Direction de la Recherche Fondamentale (DRF), Institut d’Imagerie Biomedicale (I2BM), MIRCen, Fontenay-aux-Roses, France 2Centre National de la Recherche
Scientifique (CNRS), Neurodegenerative Diseases Laboratory, Université Paris-Sud, Université Paris-Saclay, UMR 9199 Fontenay-aux-Roses, France Full list of author information is available at the end of the article
Abstract
Background:The correction ofγ-photon attenuation in PET-MRI remains a critical issue, especially for bone attenuation. This problem is of great importance for brain studies due to the density of the skull. Current techniques for skull attenuation correction (AC) provide indirect estimates of cortical bone density, leading to inaccurate estimates of brain activity. The purpose of this study was to develop an alternate method for bone attenuation correction based on NMR.
The proposed approach relies on the detection of hydroxyapatite crystals by zero echo time (ZTE) MRI of31P, providing individual and quantitative assessment of bone density. This work presents a proof of concept of this approach. The first step of the method is a calibration experiment to determine the conversion relationship between the31P signal and the linear attenuation coefficientμ. Then31P-ZTE was performed in vivo in rodent to estimate theμ-map of the skull.18F-FDG PET data were acquired in the same animal and reconstructed with three different AC methods:31P-based AC, AC neglecting the bone and the gold standard, CT-based AC, used to comparison for the other two methods.
Results:The calibration experiment provided a conversion factor of31P signal intoμ. In vivo31P-ZTE made it possible to acquire 3D images of the rat skull. Brain PET images showed underestimation of18F activity in peripheral regions close to the skull when AC neglected the bone (as compared with CT-based AC). The use of31P-derivedμ-map for AC leads to increased peripheral activity, and therefore a global overestimation of brain
18
F activity.
Conclusions:In vivo31P-ZTE MRI of hydroxyapatite providesμ-map of the skull, which can be used for attenuation correction of18F-FDG PET images. This study is limited by several intrinsic biases associated with the size of the rat brain, which are unlikely to affect human data on a clinical PET-MRI system.
Keywords:PET/MR, Attenuation correction,31P, ZTE, Bone
Background
Five years after the introduction of the first whole-body PET/MR systems, attenuation correction of PET images remains challenging. This is particularly true for bone attenuation, due to the inability of1H-MRI to detect the crystal component of cortical bone. Neglecting bone attenuation leads to significant activity underestimation in bone
as well as in neighboring tissues [1, 2], which is of particular concern for the brain given the skull density. Original approaches have been developed to assess skull attenuation by MRI, such as atlas-based, template-based, and segmentation-based methods [3]. However, these approaches provide an indirect assessment of bone density and remain inaccurate in the vicinity of bones [4, 5]. In this context, the ability to measure the density of cortical bone crystal in vivo by MRI would be of great interest. This study presents a new MR-based method for bone attenuation correction, based on31P-MRI of hydroxyapatite crystals. The method was implemented on preclinical MRI and PET/CT systems in order to provide in vivo proof of concept in rodent. A calibration experiment was first conducted on a bone sample to determine the conversion factor from31P signal intensity to linear attenuation coefficientμ. Then in vivo MRI and PET/CT were performed on a rat. Aμ-map of the skull was calculated from31P-MRI and used to correct18F-FDG PET images of the brain for skull attenuation.
Rationale
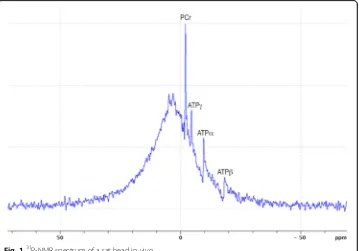
Bone crystal is made of hydroxyapatite Ca5(PO4)3OH [6], which high density (3.8 kg/L) and high atomic number (Z= 20 for Ca) explainγ-photon attenuation. Hydroxyapatite is hardly detectable by 1H-MRI in vivo. However, each crystal contains three phosphorus atoms that are detectable by 31P-NMR. The NMR spectrum in Fig. 1 displays the total 31
P-NMR signal acquired from a rat head in vivo at 11.7 T (Fourier-transformed FID, 15μs hard pulse for excitation, TR = 15 ms, 66 averages). This spectrum shows that31P signal is dominated by a broad peak, which can unambiguously be ascribed to solid-state 31
P given its short T2 of ~85μs (FWHM ~18.5 ppm) and long T1 of ~20 s (fitted from spectra acquired for five different TR, data not shown). In contrast, the sharp peaks at
−2.5,−5.0,−10.0, and−18.8 ppm belong to the liquid-state phosphorus atoms of PCr and
ATP [7]. Integration of the spectrum shows that the liquid signal accounts for 7% of total 31
P signal of the head (ratio of ATP + PCr + Pi peak areas divided by the total 31P resonance area). Thus, signal from hydroxyapatite dominates the 31P-NMR signal from the head in vivo. Solid-state31P MRI techniques, which are appropriate for the detection of nuclei having short T2, have been proposed for MRI of cortical bone [8–15]. Based on these observations, we hypothesized that31P-ZTE imaging of the head in vivo will provide 3D images of the skull, which can be converted into an attenuation map and used to correct PET data forγ-photon attenuation.
Methods
Calibration experiment on a cortical bone sample
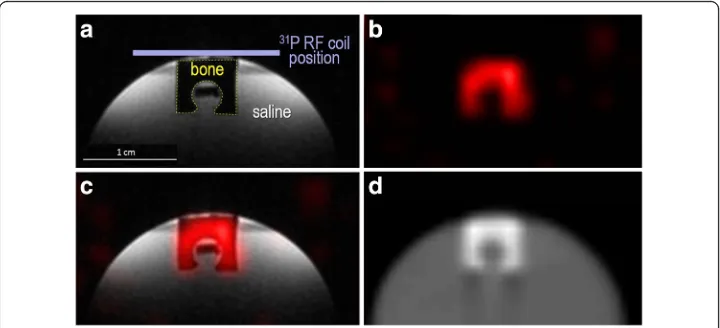
A U-shape sample was cut out of bovine cortical bone and positioned on top of a saline-filled tube, as shown in Fig. 2a. Saline was necessary for proper NMR shimming and frequency adjustment.
MRI data were acquired on a BRUKER BIOSPEC 117/16 USR system. Dedicated ra-diofrequency (RF) coils were placed on top of the sample (Fig. 2a), made of concentric 1
H and 31P surface RF coils used for transmission and reception (15 mm diameter). After RF tuning/matching, shimming, and frequency adjustment, two images of the sample were acquired:
1
H anatomical MRI (350μm isotropic voxel size, proton density weighting) for registration of MRI and CT,
31
P-ZTE MRI (1.4 mm isotropic voxel size), using the following parameters: 15μs 200 W hard pulse for excitation, flip angle close to Ernst angle, 161mT/m readout gradient, 64 points sampled at 250 kHz, FOV = 89.6 mm, TR = 15 ms, 13030 half-projections, 96 averages, 5 h and 13 min acquisition time.
CT data were acquired on a SIEMENS INVEON system:
Fig. 2MRI and CT images acquired on the cortical bone sample.1H anatomical MRI (a),31P-ZTE MRI (b),
High-resolution CT images of the rat head (103μm isotropic) for registration of MRI and CT,
Low-resolution CT images (860 × 860 × 796μm) forμ-map generation.
31
P-ZTE signal intensity was converted into 31P signal-to-noise ratio (SNR31P) by dividing the 31P signal intensity of each voxel by the standard deviation of the noise measured on a ROI distant from the bone sample. CT images were converted into
μ-maps using the established bi-linear relationship between Hounsfield units and μ [16] and then registered to SNR31P images. The conversion factor from SNR31P to
μ was obtained by calculating the mean μ/SNR31P ratio. Note that the conversion factor is calculated for a given acquisition time of 31P-ZTE. Its use for 31P data acquired with different acquisition time will require correcting SNR31P for the acquisition time (division by the square root of the acquisition time).
Attenuation correction experiment on rodent head in vivo
A Sprague-Dawley male rat was used for this proof of concept and underwent MRI and PET/CT imaging sessions on the same systems as the bone sample. The PET/CT session was conducted on the rat 5 days after the MRI session. For the two sessions, the rat was positioned in a prone position and anesthetized by inhalation of a ~3% isoflurane/oxygen mixture. During the PET/CT session, the tail vein was catheterized for radiotracer injection. The protocol was approved by the Committee on the Ethics of Animal Experiments of the Commissariat à l’Energie Atomique.
The MRI session was identical to the one performed on the bone sample (acquisition of 1H anatomical MRI and 31P-ZTE MRI with identical parameters, except for 31 P-ZTE acquisition which was limited to 16 averages, i.e., 52 min). During the PET/CT session, CT images were acquired with identical parameters as for the bone sample (high resolution for registration, low resolution for attenuation correction) and PET data were acquired in list mode for 60 min following an i.v. bolus of 93 MBq 18
F-FDG. 31
P-ZTE signal intensity was converted into SNR31P and then into bone μ factor (“μ31P”) using the conversion factor determined on the bone sample (after correcting SNR for the different acquisition time). The PET and CT images were then registered to theμ31Pimage.
A 1st set of PET images was reconstructed with attenuation correction based on CT generatedμ-map (CT-AC PET): PET data were normalized, corrected for scattering, at-tenuation, arc effects, and physical decay, and reconstructed using a Fourier rebinning algorithm and an iterative OSEM-2D method.
A 2nd set of PET images with attenuation correction neglecting the bone (
NoBone-AC PET) was obtained by assuming that the rat head was made of soft tissue and air only. NoBone-AC PET images provide a good approximation of Dixon-based attenu-ation correction.
Results
Figure 2 presents the MRI and CT data acquired on the bone sample, demonstrating excellent co-localization between cortical bone and 31P-ZTE signal, as well as high SNR31P of cortical bone (~30). The conversion factor measured on the sample wasμ/ SNR31P= 0.0042 ± 0.0004 (cm−1).
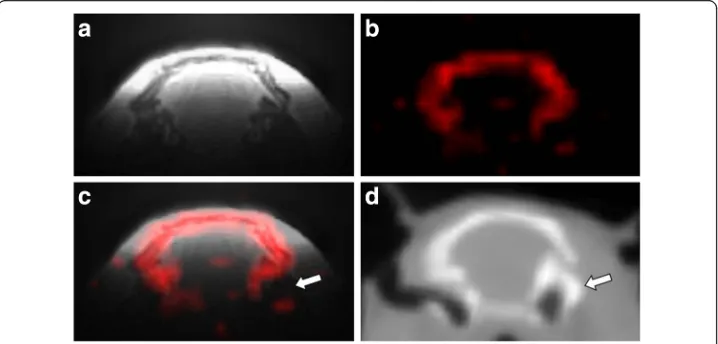
The MRI and CT data acquired in vivo are shown in Fig. 3, confirming good co-localization between the skull and31P-ZTE signal and illustrating the bone specificity of31P-ZTE MRI (no significant31P signal from soft tissues). As pointed on Figs. 3c, d, 31
P-ZTE seems to “miss” bone spots at the skull base (white arrow). Similarly, “red spots” can be seen outside the skull on Figs. 3b, c. Focal increase in ATP-PCr concentration or soft tissue calcification could theoretically explain these spots. However, the most likely explanation is the contribution of electronic noise, given the low SNR of 31P-ZTE images (~10). A similarity index was calculated between31 P-ZTE and CT skull images, confirming overall good co-localization (0.92 Dice index).
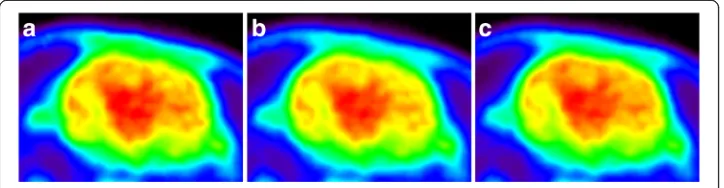
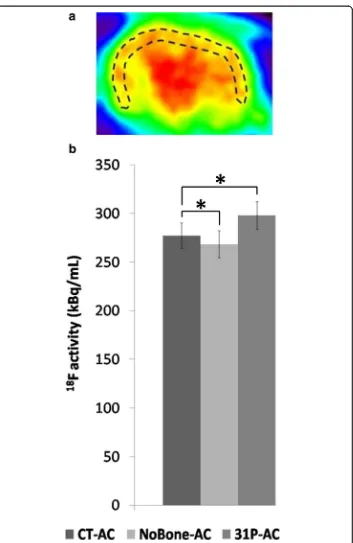
Figure 4 displays 18F-FDG PET images of the rat brain reconstructed with the three different attenuation correction methods. In order to illustrate the effect of attenuation correction on brain PET images, 18F activity was measured in a peripheral brain ROI for the three sets of PET images (Fig. 5). As expected for such a small animal, skull attenuation had a limited impact on brain activity. However, Fig. 5 shows that NoBone-AC underestimates 18F activity as compared with CT-AC (p < 0.001, unpaired t test). The use of 31P-AC significantly increases brain activity as compared with NoBone-AC and overestimates brain activity as compared with CT-AC (p < 0.001).
Discussion
Specificity of31P-ZTE for the skull
As shown in Fig. 1,31P is not only found in mineral hydroxyapatite in vivo but also in liquid-state molecules (mainly PCr and ATP). Moreover, the T1 of PCr or ATP is ~10 times smaller than the T1 of hydroxyapatite [17], such that the short TR used for ZTE is likely to enhance 31P signal of PCr and ATP. This raises the question of possible
Fig. 3MRI and CT images acquired on the rat head in vivo.1H anatomical MRI (a),31P-ZTE MRI (b), fusion
(c), and low resolution CT (d). Thewhite arrowpoints to the skull base where31P detection sensitivity
contamination of the signal of bone voxels by non-apatite molecules on 31P-ZTE images. Both theoretical and experimental data argue against such a contamination. Based on the molar mass of hydroxyapatite (402 g/mol for three phosphorus atoms) and on hydroxyapatite density in bone (3800 g/L), the concentration of 31P atoms in mineral bone can be assessed to ~30 mol/L. This is several orders of magnitude higher than PCr or ATP concentrations in soft tissues (~30 mmol/L for PCr in skeletal muscle [18]). Moreover, cortical bone is mainly made of hydroxyapatite crystals and collagen, with a low cell content [6] so that ATP and PCr concentrations in cortical bone are expected to be much smaller than in soft tissue. Therefore, the contribution of liquid-state molecules to the31P signal of bone voxels is likely to be negligible as compared to the contribution of hydroxyapatite. This statement is supported by our experimental results: as illustrated by Figs. 3b, c, no significant 31P signal is detected in soft tissues on ZTE images of the rat head. This holds true for skeletal muscle which has the high-est PCr and ATP contents among soft tissues [18] and is detected with a higher sensitivity than the skull due to the proximity of the muscle to the surface RF coil. This observation confirms earlier31P-MRI studies of the wrist bone in vivo [15], showing no detectable signal from skeletal muscle.
Quantitative measurement of bone mineral density
Our data demonstrate the ability to acquire in vivo images of skull hydroxyapatite using 31P-ZTE MRI. They do not demonstrate that31P signal is quantitatively related to bone density. Such a demonstration would require the use of several bone samples with different densities and comparison with gold standard methods for bone density measurement, which was beyond the scope of this work. However, previous studies on bone samples have demonstrated that solid-state 31P-MRI is as good as or better than dual-energy X-ray absorptiometry in measuring bone mineral density by validation against chemical analysis [14]. Our approach relying on 31P-ZTE, it can therefore be considered to be quantitative for skull attenuation correction, as opposed to the currently available methods such as atlas-based, template-based, or segmentation-based methods [3].
Homogeneity of MRI transmit and receive profiles
One limitation of our study is the use of surface coils for MRI acquisitions, resulting in a decreasing sensitivity from the cranial vertex to the skull base. This detection bias can be observed by comparing31P-ZTE (Fig. 3c) and CT (Fig. 3d): part of the skull base
Fig. 418F-FDG PET reconstructed using three different attenuation corrections:CT-AC(a),NoBone-AC(b),
seen on CT is missing on 31P-ZTE (white arrow). This bias is even more pronounced for the rat jaw which is not detected. However, the31P coil is optimized for brain detec-tion so that cortical bone is properly taken into account when located in close contact to the brain. It must be noted that the excitation profile may also vary with the flip angle. However, the transmission power was calibrated in order to maximize the broad
peak of the 31P spectrum so that the effective flip angle was close to the Ernst angle of the bone, i.e., ~2°. At a low angle such as this one, the excitation profile is rather in-sensitive to the flip angle.
Another source of inhomogeneity of 31P signal is the frequency profile of the hard pulse used for excitation. A 15 μs hard pulse has a sinc-shape excitation profile for which the central lobe is ~130 kHz. Excitation can be considered to be reasonably homogeneous if all signals are located within the middle 35% of the profile (~45 kHz) where their intensity variation will be less than 5% of the maximum intensity. In practice, it means that 45/250 of the readout FOV will be properly excited, i.e., 16 mm. This value was adapted to our sample experiment (~8 mm largest dimension for the bone sample). For the in vivo experiment, the largest dimension of the skull is ~25 mm, for which the excitation profile cannot be considered to be homogeneous, leading to a signal decrease of 10–15% even when the skull is properly centered in the gradient coil.
Attenuation correction of18F-FDG PET images of the brain
Limitations in rodent
This work has several technical limitations mostly due to the small size of the rat brain (~25 mm) in which MRI and PET detection sensitivities are significantly lower than in humans and attenuation of γ-photons is also much smaller than in humans. Moreover, the use of surface RF coils leads to significant bias in 31P sensitivity throughout the skull. Given these limitations, this work cannot claim to quantify the performance of 31P-based attenuation correction. In particular, difference maps or correlation scores—which are standard tools to compare attenuation corrections in humans [3, 24]—are dominated by biases and measurement noise. Indeed, none of the currently available methods for skull AC have been quantitatively assessed in small animals. This study presents an original approach, demonstrating the ability to obtain 3D images of the skull using31P-ZTE MRI in vivo and presents an implementation for attenuation correction of brain18F-FDG PET.
Conclusions
This work brings theoretical and experimental arguments justifying the implementation and assessment of 31P-ZTE-based attenuation correction on human PET-MRI systems. The 31P approach should prove more straightforward and robust on a clinical imaging system. The first advantage of a human system will be the suppression of31P-ZTE sensi-tivity in homogeneities. MRI of the human brain is performed with homogeneous volume RF coils, which are rarely used in rodent for geometrical reasons. Another advantage will be the suppression of the separate calibration experiment on bone sample, which is a major source of inaccuracy. The geometry of human RF coils will make it possible to insert a bone sample of known μ inside the 31P coil so that31P signal can be directly converted intoμ31Pby comparing the signal of the skull with the signal of the sample in the same image. Finally, implementation on a hybrid PET-MRI system will improve the correction accuracy over our experimental setup by suppressing bias associated with registration errors. Implementation on a human hybrid PET-MRI system will make it possible to carefully compare the31P-based method with currently available methods.
Abbreviations
CT:Computed tomography; FDG: Fluorodeoxyglucose; MRI: Magnetic resonance imaging; NMR: Nuclear magnetic resonance; PET: Positron emission tomography; RF: Radiofrequency; ZTE: Zero echo time
Acknowledgements
We thank Boucherie Chaussepied et l'Avallonnaise (Paris, France) for providing the bovine cortical bone used in this study, Dr. Catriona Wimberley for careful reading of the manuscript, and Dr. Frédérique Frouin for Dice index calculation.
Author’s contributions
VL contributed to the study design, MRI acquisitions (bone sample), and manuscript writing. SJ contributed to the PET/CT acquisitions, PET/CT reconstruction, image registration and quantification, and manuscript correction. YF contributed to the PET/CT acquisitions, PET/CT reconstruction, and image registration and quantification. BT contributed to the animal handling and MRI acquisitions (rodent). GP contributed to the animal handling. EJ contributed to the animal handling and PET/CT acquisitions. JV contributed to the MRI sequence development, MRI acquisitions, and manuscript correction. All authors read and approved the final manuscript.
Competing interests
The authors declare that they have no competing interests.
Ethics approval
The protocol was approved by the Committee on the Ethics of Animal Experiments of the Commissariat à l’Energie Atomique.
Publisher’s Note
Author details
1
Commissariat à l’Energie Atomique et aux Energies Alternatives (CEA), Direction de la Recherche Fondamentale (DRF), Institut d’Imagerie Biomedicale (I2BM), MIRCen, Fontenay-aux-Roses, France.2Centre National de la Recherche Scientifique (CNRS), Neurodegenerative Diseases Laboratory, Université Paris-Sud, Université Paris-Saclay, UMR 9199 Fontenay-aux-Roses, France.3Commissariat à l’Energie Atomique et aux Energies Alternatives (CEA), Direction de la Recherche Fondamentale (DRF), Institut d’Imagerie Biomedicale (I2BM), SHFJ, Orsay, France.4Inserm/CEA/Université Paris Sud, Université Paris-Saclay, UMR 1023—CNRS ERL 9218, IMIV, Orsay, France.
Received: 16 November 2016 Accepted: 20 April 2017
References
1. Samarin A, Burger C, Wollenweber SD, Crook DW, Burger IA, Schmid DT, et al. PET/MR imaging of bone lesions—implications for PET quantification from imperfect attenuation correction. Eur J Nucl Med Mol Imaging. 2012;39:1154–60.
2. Wagenknecht G, Kaiser H-J, Mottaghy FM, Herzog H. MRI for attenuation correction in PET: methods and challenges. Magn Reson Mater Phys Biol Med. 2013;26:99–113.
3. Cabello J, Lukas M, Rota Kops E, Ribeiro A, Shah NJ, Yakushev I, et al. Comparison between MRI-based attenuation correction methods for brain PET in dementia patients. Eur J Nucl Med Mol Imaging. 2016;43:2190–200. 4. Dickson JC, O’Meara C, Barnes A. A comparison of CT- and MR-based attenuation correction in neurological PET.
Eur J Nucl Med Mol Imaging. 2014;41:1176–89.
5. Sekine T, ter Voert EEGW, Warnock G, Buck A, Huellner M, Veit-Haibach P, et al. Clinical evaluation of zero-echo-time attenuation correction for brain 18 F-FDG PET/MRI: comparison with atlas attenuation correction. J Nucl Med. 2016;57:1927–32.
6. Bourne GH, editor. Biochemistry and physiology of bone. 2nd ed. New York: Acad. Press; 1972.
7. Buchli R, Martin E, Boesiger P. Comparison of calibration strategies for the in vivo determination of absolute metabolite concentrations in the human brain by 31P MRS. NMR Biomed. 1994;7:225–30.
8. Anumula S, Magland J, Wehrli SL, Zhang H, Ong H, Song HK, et al. Measurement of phosphorus content in normal and osteomalacic rabbit bone by solid-state 3D radial imaging. Magn Reson Med. 2006;56:946–52. 9. Anumula S, Magland J, Wehrli SL, Ong H, Song HK, Wehrli FW. Multi-modality study of the compositional and
mechanical implications of hypomineralization in a rabbit model of osteomalacia. Bone. 2008;42:405–13. 10. Cao H, Nazarian A, Ackerman JL, Snyder BD, Rosenberg AE, Nazarian RM, et al. Quantitative 31P NMR spectroscopy
and 1H MRI measurements of bone mineral and matrix density differentiate metabolic bone diseases in rat models. Bone. 2010;46:1582–90.
11. Anumula S, Wehrli SL, Magland J, Wright AC, Wehrli FW. Ultra-short echo-time MRI detects changes in bone mineralization and water content in OVX rat bone in response to alendronate treatment. Bone. 2010;46:1391–9. 12. Seifert AC, Li C, Rajapakse CS, Bashoor-Zadeh M, Bhagat YA, Wright AC, et al. Bone mineral 31P and matrix-bound
water densities measured by solid-state 31P and 1H MRI. NMR Biomed. 2014;27:739–48.
13. Seifert AC, Wehrli FW. Solid-state quantitative 1H and 31P MRI of cortical bone in humans. Curr Osteoporos Rep. 2016;14:77–86.
14. Wu Y, Ackerman JL, Chesler DA, Li J, Neer RM, Wang J, et al. Evaluation of bone mineral density using three-dimensional solid state phosphorus-31 NMR projection imaging. Calcif Tissue Int. 1998;62:512–8.
15. Wu Y, Reese TG, Cao H, Hrovat MI, Toddes SP, Lemdiasov RA, et al. Bone mineral imaged in vivo by 31P solid state MRI of human wrists. J Magn Reson Imaging. 2011;34:623–33.
16. Burger C, Goerres G, Schoenes S, Buck A, Lonn A, von Schulthess G. PET attenuation coefficients from CT images: experimental evaluation of the transformation of CT into PET 511-keV attenuation coefficients. Eur J Nucl Med Mol Imaging. 2002;29:922–7.
17. Bogner W, Chmelik M, Schmid AI, Moser E, Trattnig S, Gruber S. Assessment of31P relaxation times in the human calf muscle: A comparison between 3 T and 7 T in vivo. Magn Reson Med. 2009;62:574–82.
18. Kemp GJ, Meyerspeer M, Moser E. Absolute quantification of phosphorus metabolite concentrations in human musclein vivo by 31P MRS: a quantitative review. NMR Biomed. 2007;20:555–65.
19. Alvarez RE, Macovski A. Energy-selective reconstructions in X-ray computerized tomography. Phys Med Biol. 1976; 21:733–44.
20. Rey C, Combes C, Drouet C, Glimcher MJ. Bone mineral: update on chemical composition and structure. Osteoporos Int. 2009;20:1013–21.
21. Roufosse AH, Aue WP, Roberts JE, Glimcher MJ, Griffin RG. Investigation of the mineral phases of bone by solid-state phosphorus-31 magic angle sample spinning nuclear magnetic resonance. Biochemistry (Mosc). 1984;23: 6115–20.
22. Biltz RM, Pellegrino ED. The nature of bone carbonate. Clin Orthop. 1977;129:279–92.
23. Rey C, Collins B, Goehl T, Dickson IR, Glimcher MJ. The carbonate environment in bone mineral: a resolution-enhanced Fourier transform infrared spectroscopy study. Calcif Tissue Int. 1989;45:157–64.