Other uses, including reproduction and distribution, or selling or
licensing copies, or posting to personal, institutional or third party
websites are prohibited.
In most cases authors are permitted to post their version of the
article (e.g. in Word or Tex form) to their personal website or
institutional repository. Authors requiring further information
regarding Elsevier’s archiving and manuscript policies are
encouraged to visit:
Effect of timing of a deficit-irrigation allocation on corn evapotranspiration,
yield, water use efficiency and dry mass
J.O. Payero
a,*
, D.D. Tarkalson
b, S. Irmak
c, D. Davison
d, J.L. Petersen
daQueensland Primary Industries and Fisheries, Department of Employment, Economic Development and Innovation, 203 Tor Street, Toowoomba, Queensland 4350, Australia b
USDA-ARS NW Irrigation and Soils Research Lab, 3793 North 3600 East, Kimberly, ID 83341, USA
c
Department of Biological Systems Engineering, University of Nebraska-Lincoln, 241 L.W. Chase Hall, Lincoln, NE 68583-0726, USA
d
University of Nebraska-Lincoln, West Central Research and Extension Center, 461 West University Drive, North Platte, NE 69101, USA
1. Introduction
Availability of irrigation water is decreasing in many areas of the USA Great Plains for a variety of reasons, including drought
and water regulations (McGuire, 2004; McGuire and Fischer, 1999; Lingle and Franti, 1998). The limited supplies particularly affect field corn (Zea mays L.) due to its relative high water requirements and because it covers more area than any other irrigated crop in the region (Norwood, 2000). Determining crop yield response to irrigation is important for crop selection, economic analysis, and for practicing effective irrigation manage-ment strategies. If water is limited, it is important to know how to time irrigations to optimize yields, water use efficiency and, ultimately, profits.
Farmers with limited water often have to choose among options such as: fully irrigating a portion of the field area, deficit-irrigating Agricultural Water Management 96 (2009) 1387–1397
A R T I C L E I N F O
Article history:
Received 12 May 2008 Accepted 17 March 2009 Available online 10 June 2009
Keywords:
Water use efficiency Corn dry mass Harvest index
Subsurface drip irrigation (SDI) Soil water modeling
Yield response factor (ky)
A B S T R A C T
Water regulations have decreased irrigation water supplies in Nebraska and some other areas of the USA Great Plains. When available water is not enough to meet crop water requirements during the entire growing cycle, it becomes critical to know the proper irrigation timing that would maximize yields and profits. This study evaluated the effect of timing of a deficit-irrigation allocation (150 mm) on crop evapotranspiration (ETc), yield, water use efficiency (WUE = yield/ETc), irrigation water use efficiency (IWUE = yield/irrigation), and dry mass (DM) of corn (Zea mays L.) irrigated with subsurface drip irrigation in the semiarid climate of North Platte, NE. During 2005 and 2006, a total of sixteen irrigation treatments (eight each year) were evaluated, which received different percentages of the water allocation during July, August, and September. During both years, all treatments resulted in no crop stress during the vegetative period and stress during the reproductive stages, which affected ETc, DM, yield, WUE and IWUE. Among treatments, ETc varied by 7.2 and 18.8%; yield by 17 and 33%; WUE by 12 and 22%, and IWUE by 18 and 33% in 2005 and 2006, respectively. Yield and WUE both increased linearly with ETc and with ETc/ETp (ETp = seasonal ETc with no water stress), and WUE increased linearly with yield. The yield response factor (ky) averaged 1.50 over the two seasons. Irrigation timing affected the DM of the plant, grain, and cob, but not that of the stover. It also affected the percent of DM partitioned to the grain (harvest index), which increased linearly with ETc and averaged 56.2% over the two seasons, but did not affect the percent allocated to the cob or stover. Irrigation applied in July had the highest positive coefficient of determination (R2) with yield. This high positive correlation decreased
considerably for irrigation applied in August, and became negative for irrigation applied in September. The best positive correlation between the soil water deficit factor (Ks) and yield occurred during weeks 12–14 from crop emergence, during the ‘‘milk’’ and ‘‘dough’’ growth stages. Yield was poorly correlated to stress during weeks 15 and 16, and the correlation became negative after week 17. Dividing the 150 mm allocation about evenly among July, August and September was a good strategy resulting in the highest yields in 2005, but not in 2006. Applying a larger proportion of the allocation in July was a good strategy during both years, and the opposite resulted when applying a large proportion of the allocation in September. The different results obtained between years indicate that flexible irrigation scheduling techniques should be adopted, rather than relying on fixed timing strategies.
ß2009 Elsevier B.V. All rights reserved.
* Corresponding author at: Queensland Primary Industries and Fisheries, Department of Employment, Economic Development and Innovation, Principal Research Scientist-Irrigated Farming Systems, 203 Tor Street, PO Box 102, Toowoomba, Queensland 4350, Australia. Tel.: +61 7 4688 1513;
fax: +61 7 4688 1197.
E-mail addresses:[email protected],[email protected]
(J.O. Payero).
Contents lists available atScienceDirect
Agricultural Water Management
j o u r n a l h o m e p a g e : w w w . e l s e v i e r . c o m / l o c a t e / a g w a t
a larger crop area, changing to crops that require less water, or investing in more efficient irrigation systems. Determining the best option is not an easy task, since it could require complex economic analysis to maximize economic returns (English et al., 2002; Martin et al., 1989). This analysis depends on a variety of economic and biophysical factors, among which the expected crop yield is one of the most important inputs. Although for a given region, crop yields with full irrigation are relatively stable and, therefore, relatively easy to estimate, yield under dryland and deficit irrigation can vary considerably, particularly in arid and semiarid climates. Crop yield under deficit irrigation depends on the magnitude and timing of the total crop available water, which includes effective rain, available soil water at planting and effective irrigation.
Water stress can affect growth, development, and physiological processes of corn plants, which can reduce biomass and, ultimately, grain yield due to a reduction in the number of kernel per ear or the kernel weight (Traore et al., 2000; Jama and Ottman, 1993; Gavloski et al., 1992; NeSmith and Ritchie, 1992; Newell and Wilhelm, 1987; Dwyer and Stewart, 1984, 1985; Havaux and Lannoye, 1983; Herrero and Johnson, 1981; Jurgens et al., 1978; McPherson and Boyer, 1977; Vincent and Woolley, 1972; Downey, 1971; Barnes and Woolley, 1969; Denmead and Shaw, 1960; Bryant et al., 1992; Claassen and Shaw, 1970).
Several studies have shown significant effect of stress timing on corn yield (Jama and Ottman, 1993; NeSmith and Ritchie, 1992; Bryant et al., 1992; Jurgens et al., 1978; Downey, 1971; Claassen and Shaw, 1970; Barnes and Woolley, 1969; Denmead and Shaw, 1960; Robins and Domingo, 1953). Several studies have developed mathematical models to quantify this effect (Meyer et al., 1993a,b; Doorenbos and Kassam, 1979; Nairizi and Rydzewski, 1977; Jensen, 1968). Other studies, however, have suggested that corn yield is just a linear function of seasonal evapotranspiration (ET) or transpiration (T) (Gilley et al., 1980; Payero et al., 2006b; Klocke et al., 2004; Stone, 2003; Schneekloth et al., 1991; Barrett and Skogerboe, 1978; Hanks et al., 1976; Hanks, 1974; Robins and Domingo, 1953). These studies suggest that if grain yield is linearly related to ET, then the effect of water stress on yield will depend on the magnitude in which stress affects seasonal ET. Some of the results of the studies evaluating the effect of stress timing on corn yield, however, have been confounded by the fact that, in many cases, the applied irrigation treatments varied in both timing and seasonal irrigation depth.
In Nebraska, research on deficit irrigation has previously focused on sprinkler and surface systems, which are the predominant systems in the state (Hergert et al., 1993; Payero et al., 2005, 2006a,b; Klocke et al., 2004; Schneekloth et al., 1991, 2006; Gilley et al., 1980). Several of these studies have evaluated the potential impact of reducing water allocation to as much as 150 mm with sprinkler and surface irrigation, but have mainly focused on irrigating during the reproductive stage, either just prior to tassel or during silking (Hergert et al., 1993; Klocke et al., 2004; Payero et al., 2005). The selection of 150 mm dates back to the early 1980s when irrigation districts in southwest Nebraska were considering establishing allocations of 150–200 mm per year (Hergert et al., 1993).
Interest on subsurface drip irrigation (SDI) to irrigate corn and other row crops in Nebraska is growing, and so is the expectation that establishment of water allocations will spread among Natural Resource Districts (NRDs). It could be anticipated that the magnitude of the water allocations in some NRDs could get as low as those considered in the 1980s. Several SDI studies have been conducted in other states (Ayars et al., 1999; Camp, 1998; Caldwell et al., 1994; Howell et al., 1997; Lamm et al., 1995; Lamm and Trooien, 2003). However, local information from Nebraska on the response of corn growth, yield and other crop–water dynamics with SDI is very limited, especially dealing with the effect of
irrigation timing of limited water allocations. The objective of this study was to evaluate the effect of timing of a deficient irrigation allocation (150 mm) applied with SDI on evapotranspiration, water use efficiency, and dry mass production of corn in the semiarid climate of west central Nebraska. This information is vital for helping local farmers minimize the negative impacts of potential establishment of deficient water allocations. The working hypothesis for this study was that treatments resulting in longer and more severe stress during the reproductive stages would have lower seasonal crop evapotranspiration and consequently, lower yield and dry mass production.
2. Materials and methods
2.1. Site description
Field experiments were conducted in 2005 and 2006 at the University of Nebraska-Lincoln, West Central Research and Extension Center, in North Platte, NE (41.18N 100.88W, 861 m above sea level). The climate at North Platte is semiarid, with average annual precipitation and reference evapotranspiration of approximately 508 and 1403 mm, respectively. On average, about 80% of the annual precipitation occurs during the growing season, which extends from late-April to mid-October (USDA, 1978). The experimental site has a Cozad silt loam soil (fine-silty, mixed, mesicFluventic Haplustoll), which is nearly flat, deep, well-drained and has average water contents at field capacity and permanent wilting point of 0.35 and 0.09 m3m3, respectively.
2.2. Experimental design and irrigation management
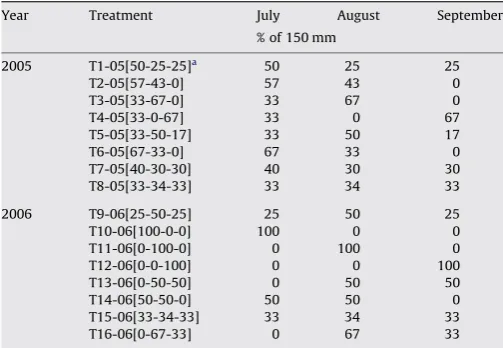
Sixteen irrigation treatments were evaluated over the two years (eight each year), using a randomized complete block design with four replications. A fixed seasonal irrigation allocation of 150 mm was assigned to each treatment, applying the percentages listed in Table 1during July, August and September. When establishing the irrigation treatments, it was recognized that stress timing and stress severity could both have an impact on crop production. However, it is usually impractical to evaluate the large number of potential combinations of stress timing and severity. Therefore, since the experimental setup allowed application of a maximum of eight irrigation treatments each season, different treatments were established each season, rather than repeating the same
treat-Table 1
Irrigation with 150 mm water and its percentage application during July, August, and September in the different treatments during the 2005 and 2006 growing seasons at North Platte, NE.
Year Treatment July August September
% of 150 mm
2005 T1-05[50-25-25]a
50 25 25
T2-05[57-43-0] 57 43 0
T3-05[33-67-0] 33 67 0
T4-05[33-0-67] 33 0 67
T5-05[33-50-17] 33 50 17
T6-05[67-33-0] 67 33 0
T7-05[40-30-30] 40 30 30
T8-05[33-34-33] 33 34 33
2006 T9-06[25-50-25] 25 50 25
T10-06[100-0-0] 100 0 0
T11-06[0-100-0] 0 100 0
T12-06[0-0-100] 0 0 100
T13-06[0-50-50] 0 50 50
T14-06[50-50-0] 50 50 0
T15-06[33-34-33] 33 34 33
T16-06[0-67-33] 0 67 33
a
ments over the two years. This strategy allowed evaluation of sixteen possible combinations of stress timing and severity during the two years.
Each experimental plot (9 m37 m) had twelve corn rows planted at 0.76 m spacing and an average density of 7.6 seeds per m2.
Plots were irrigated with a SDI system, with all components of the system supplied by the same manufacturer (Netafim USA, Fresno, CA). The system was installed before planting in 2005, following a surface-irrigated soybean crop grown in 2004. The SDI laterals were installed every other row (1.52 m apart) at a depth of 0.4 m from the soil surface. The laterals (model PC 1613 F) had an inside diameter of 1.6 cm and pressure-compensating emitters spaced every 46 cm. Each emitter had a nominal flow rate of 0.98 L h1at a pressure of
69 kPa. The water pumped from the Ogallala Aquifer was filtered using a 15-cm diameter screen filter (model 8060F-MN) with a 150-mesh screen (0.105 mm opening diameter). Water flowed through a manifold instrumented with flowmeters, electric/manual valves, pressure regulators, and air vents on each supply line. Irrigations were controlled manually in 2005, but an automatic controller (model NMC-64) was used in 2006. The system had chemigation equipment installed in the mainline for applying fertilizer, acid and chlorine; and a flushing valve at the downstream end of each plot. All treatments requiring irrigation during a given month were irrigated simultaneously until their allocations ran out. Irrigations were usually applied two to three times a week with typical application depths of about 13–25 mm d1.
2.3. Cultural practices
The corn hybrid Kaystar KX-8615Bt, with a comparative relative maturity of 112 days, was planted on 18 and 11 May and matured on 23 and 20 September in 2005 and 2006, respectively. Each year, 110 kg ha1of the fertilizer 10-34-0 was applied at planting. An
additional 108 and 213 kg ha1of nitrogen (N) was injected as urea
ammonium nitrate with the irrigation water on 15 and 5 July in 2005 and 2006, respectively. Lower N rates applied in 2005 were due to N credit from the previous soybean crop. A herbicide mixture (Lumax1
+ Banvel1
+ Atrazine 90 DF + crop oil) was applied when the crop was at the 4-leaf stage. The insecticide Force1
3G was applied at planting to control the Western corn rootworm (Diabrotica virgifera LeConte) and the European corn borer [Ostrinia nubilalis(Hu¨bner)].
2.4. Yield and dry mass measurement
Crop grain yield was measured by harvesting the center three rows of each plot using a plot combine with a three-row corn head. The combine had a Harvest Data System (model HM-400, Juniper Systems, Inc., Logan, Utah), which measured total grain mass and water content. Grain yield was determined on dry-mass (0% water content) and on wet-mass basis (15.5% standard water content).
Plant dry mass (DM) and its partitioning into grain, stover and cob was determined by hand-harvested eight plants from each plot. The plants were cut at ground level, the ears were removed, and the stover was chopped using a tractor-operated plant chopper. Subsamples of the chopped stover were taken to determine their water content. The ears were air-dried to a moisture content of about 15–16% and hand-shelled. The DM of the plant, grain, cob, and stover was determined by oven-drying samples at 708C.
2.5. Soil water balance and crop evapotranspiration
A computer model was developed and used to estimate daily evapotranspiration under water-limiting conditions (ETc), the ETc with no water stress (ETp), and the soil water balance in the crop root zone for each treatment, using the procedures described in
FAO-56 (Allen et al., 1998) and (ASCE-EWRI, 2005). Inputs to the model included daily weather variables, rainfall, irrigation dates and amounts, water content in the soil profile at crop emergence, and crop- and site-specific inputs such as planting date, maturity date, soil parameters, maximum rooting depth. Robinson and Hubbard (1990),Swan et al. (1990), andBryant et al. (1992)have used similar models. The performance of the model had previously been evaluated at the experimental site in a separate study over two seasons (Payero et al., 2008). The evaluation showed that the estimated soil water followed the 1:1 line when compared with neutron probe measurements during both seasons, withR2of 0.90 and 0.85 and root mean squared errors (RMSE) of 0.018 and 0.019 m3m3, for the first and second season, respectively.
ETc was calculated as:
ETc¼ ðKs KcbþKeÞETo (1)
where Ks = soil water deficit factor (unitless), Kcb = basal crop coefficient (unitless), Ke = soil water evaporation factor (unitless), and ETo = grass-reference ET (mm d1). Ke accounts for the sharp
increases in soil evaporation when the soil surface is wet, following rain or irrigation, and models soil surface drying rate. Values given in Tables 11 and 17 of FAO-56 for Kimberly, Idaho (Kc_ini = 0.15, Kc_mid = 1.15, and Kc_end = 0.15) were used to calculate daily Kcb values. Ks represents the effect of water stress on crop transpira-tion and was calculated as:
Ks¼ TAWDr
TAWRAW¼
TAWDr
ð1pÞTAW (2)
where TAW = total available soil water in the root zone (mm), RAW = readily available soil water in the root zone (mm), Dr = soil water depletion in the root zone (mm),p= fraction of TAW that the crop can extract without suffering water stress. Ks = 1.0 for DrRAW, and linearly decreases to Ks = 0 at permanent wilting point. Therefore, when Ks = 1.0 the crop is not water-stressed and Eq.(1)becomes ETc = ETp = (Kcb + Ke) ETo. For corn,p= 0.55 was taken from Table 22 in FAO-56. TAW and RAW were calculated as:
TAW¼ ð
ufc
upwp
Þzr (3)RAW¼ pðTAWÞ (4)
where
u
fc= soil water content at field capacity (m3m3),u
pwp= soilwater content at permanent wilting point (m3m3), and z r= root
zone depth (mm).
Daily ETo was calculated from weather data using the standardized Penman-Monteith method (ASCE-EWRI, 2005) as:
ETo¼0:408
D
ðRnGÞ þg
ðCn=ðTþ273ÞÞU2ðeseaÞD
þg
ð1þCdU2Þ(5)
where
D
= slope of saturation vapor pressure versus air tempera-ture curve (kPa8C1), Rn= calculated net radiation at the crop
surface (MJ m2d1),G= heat flux at the soil surface (MJ m2d1),
T= mean daily air temperature at 1.5–2.5 m height (8C),U2= mean
daily wind speed at 2 m height (m s1), e
s= saturation vapor
pressure (kPa), ea= actual vapor pressure (kPa), esea= vapor
pressure deficit (kPa),
g
= psychrometric constant (kPa8C1),Cn= 9008C mm s3Mg1d1, andCd= 0.34 s m1.
Daily values for Rn, es, and ea were calculated using the
equations (albedo,
a
= 0.23) given byAllen et al. (1998)and ASCE-EWRI (2005). Measured air relative humidity (RH), maximum temperature (Tmax), and minimum temperature (Tmin) were usedto calculate dailyea andes, and the Stefan-Boltzmann constant
(
s
= 4.901109MJ K4m2d1) was used to calculate netoutgoing longwave radiation (Rnl). Values for specific heat at
constant temperature (cp= 1.013103MJ kg18C1), and latent
heat of vaporization (
l
= 2.45 MJ kg1) followed FAO-56 andEWRI (2005). The psychrometric constant (
g
) was computed as a function of atmospheric pressure (P),l
, cp, and the ratio ofmolecular weight of water vapor to dry air (e= 0.622). P was calculated as a function of station elevation and a value of daily G= 0 MJ m2d1was assumed. Since wind speed was measured at
a height of 3 m, it was converted to the standard 2-m height as (Allen et al., 1998):
U2¼Uz
4:87
lnð67:8z5:42Þ (6)
whereUz= measured wind speed (m s1) at heightz, andz= height
of wind measurement above the ground surface (m). Values of canopy height (h= 0.12 m) for clipped grass and daily surface resistance (rs= 70 s m1) were used.
2.6. Weather data and soil water measurements
Daily weather data from the North Platte electronic weather station, which is part of the High Plains Regional Climate Center (HPRCC) network, were used as input to the computer model. Data included RH,Tmax,Tmin,Uz, rainfall, and solar radiation (Rs).
In 2005, the initial soil water contents close to crop emergence were obtained from gravimetric samples taken on 7 June from twelve randomly selected sites across the field at average depths of 0.1, 0.2, 0.4, 0.6, and 0.9 m (data were reported inPayero et al., 2008). The initial soil water contents deeper in the profile (to 1.8 m) were estimated from neutron probe measurements taken on 7 July from a concurrent study conducted in adjacent plots that had been subjected to the same conditions (Payero et al., 2008).
In 2006, neutron probe measurements were taken on 14 June at 0.3-m depth increments to 1.8 m. An average soil bulk density of 1.36 g cm3
was used to convert water contents to a volumetric basis. The neutron probe had previously been calibrated to determine volumetric water content for this site. The soil water profiles at crop emergence were estimated with the model by iteratively changing the initial water contents until the model estimates matched the field measurements.
2.7. Water use efficiency and statistical analyses
Water use efficiency (WUE, kg m3) and irrigation water use
efficiency (IWUE, kg m3
), on wet-mass and dry-mass basis were
calculated as:
WUE¼ Y
ETc (7)
IWUE¼Y
I (8)
where Y= yield (g m2), ETc = seasonal crop evapotranspiration
(mm),I= seasonal irrigation (mm).
Analysis of variance (ANOVA) and separation of means by the Duncan’s new multiple range test were conducted using the SAS1
System for Windows1
statistical software (SAS Institute, Inc., Cary, NC, USA). Since treatments differed among years, year was not taken as a factor for the ANOVA analyses. Regression and correlation analyses were conducted with Microsoft Excel1 and SigmaPlot1
9.0 (Systat Software, Inc., Point Richmond, CA, USA).
3. Results and discussion
3.1. Weather conditions
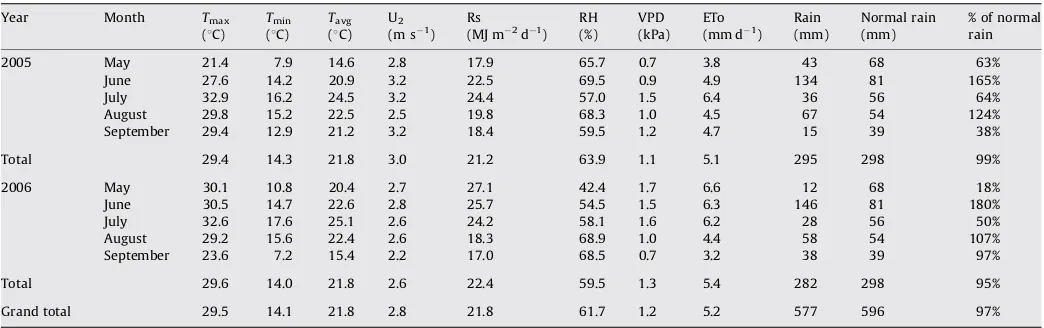
Table 2shows the magnitude of weather variables at North Platte during the 2005 and 2006 growing seasons (from emergence to physiological maturity; May–September). It also shows the long-term average (or ‘‘normal’’) rainfall pattern for the area during the period of 1982–2006. Both seasons had similar total in-season rainfall and distribution pattern. How-ever, while total in-season rainfall for both seasons was very close to normal, rainfall distribution was not. During both years, rainfall was less than normal in May, July and September and, above normal during June and August. Rainfall in July was only about half of normal, which is critical because at this time the crop was starting the reproductive stages and was also reaching its peak crop water demand. The average air temperature during the growing season was the same during both years, with the highest average monthly temperatures occurring in July. In 2006, temperatures were warmer in May, June, and July; and cooler in August and September, compared with 2005. Weather conditions resulted in similar (within 0.3 mm d1) daily average
ETo for both years.
Table 2
Average weather conditions, rainfall, and grass-reference evapotranspiration during the 2005 and 2006 corn growing seasons at North Platte, NE.
Year Month Tmax
(8C)
Tmin
(8C)
Tavg
(8C) U2
(m s1
) Rs (MJ m2
d1
) RH (%)
VPD (kPa)
ETo (mm d1
) Rain (mm)
Normal rain (mm)
% of normal rain
2005 May 21.4 7.9 14.6 2.8 17.9 65.7 0.7 3.8 43 68 63%
June 27.6 14.2 20.9 3.2 22.5 69.5 0.9 4.9 134 81 165%
July 32.9 16.2 24.5 3.2 24.4 57.0 1.5 6.4 36 56 64%
August 29.8 15.2 22.5 2.5 19.8 68.3 1.0 4.5 67 54 124%
September 29.4 12.9 21.2 3.2 18.4 59.5 1.2 4.7 15 39 38%
Total 29.4 14.3 21.8 3.0 21.2 63.9 1.1 5.1 295 298 99%
2006 May 30.1 10.8 20.4 2.7 27.1 42.4 1.7 6.6 12 68 18%
June 30.5 14.7 22.6 2.8 25.7 54.5 1.5 6.3 146 81 180%
July 32.6 17.6 25.1 2.6 24.2 58.1 1.6 6.2 28 56 50%
August 29.2 15.6 22.4 2.6 18.3 68.9 1.0 4.4 58 54 107%
September 23.6 7.2 15.4 2.2 17.0 68.5 0.7 3.2 38 39 97%
Total 29.6 14.0 21.8 2.6 22.4 59.5 1.3 5.4 282 298 95%
Grand total 29.5 14.1 21.8 2.8 21.8 61.7 1.2 5.2 577 596 97%
Tmax= maximum air temperature,Tmin= minimum air temperature,Tavg= average air temperature,U2= wind speed at 2 m height, Rs = solar radiation, RH = relative
humidity, VPD = vapor pressure deficit, ETo = grass-reference evapotranspiration. Only data from corn emergence to maturity were included.
‘‘Normal’’ rain indicates the average during the period of 1982–2006.
3.2. Soil water and crop water stress
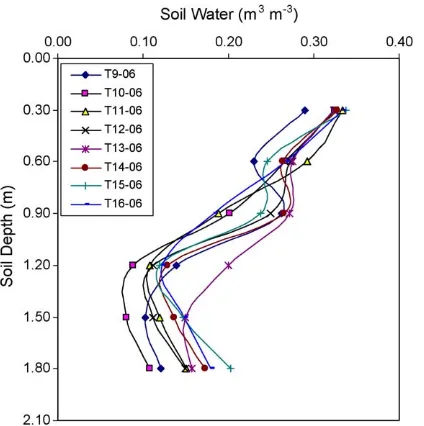
Since in 2004 the soybean was fully irrigated, there was more stored soil water at crop emergence in 2005 than in 2006. Soil water measurements in early June of 2005 confirmed that the soil profile was full to a depth of at least 1 m. The high initial soil water combined with above-normal rain in June provided sufficient water for crop growth during the first half of the 2005 growing season. In 2006, there was considerable soil water depletion in the subsoil at the start of the season, with considerable differences among treatments (Fig. 1). On average, the soil profile was only about 65% full to a depth of 1.8 m. The considerable subsoil depletions and the observed differences among treatments were due to the irrigation treatments applied in 2005 and to little water recharge during the off-season and in May. However, similar to 2005, rain was abundant in June (Table 2), providing enough soil water for crop development for much of the first half of the season.
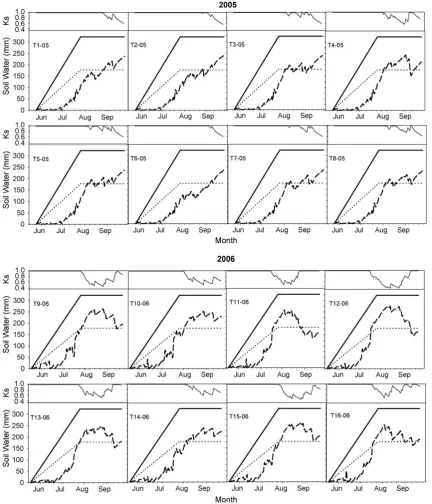
Fig. 2shows daily TAW, RAW, Dr, and Ks for each treatment during both seasons. Values of Ks<1.0 or Dr>RAW indicate crop water stress. In 2005, all treatments experienced water stress at some point during the season, but there was no stress during the first half of the season. Stress started in early August in some of the treatments. In 2006, all treatments were also stressed at some point during the season. All treatments also had adequate soil water and no stress occurred early in the season, but plants experienced stress starting in mid-July for treatments with no irrigation in July. Stress started earlier and was more severed in 2006 due to less soil water at crop emergence compared with 2005. Also, some of the treatments in 2006 had no irrigation in July. In both years, treatments that received a larger percentage of the water in July and August had the least stress and those receiving a larger percentage of the water in September had the most stress. Table 3shows the dates and corn growth stages for each week from crop emergence to physiological maturity. During both seasons, the crop was stressed during the reproductive stages, but no stress occurred during the vegetative stages. Water stress started in early August, during the R2 (blister) stage in 2005, and in mid-July, during the R1 (silk) stage in 2006. The reproductive stages have been shown to be the most sensitive to water stress (Doorenbos and Kassam, 1979).
3.3. Crop evapotranspiration
Table 4shows the seasonal ETc and ETc/ETp for each treatment. The ETc/ETp ratio is a measure of how well the water available to the crop (timing and amount) is able to meet crop ETp requirements. The calculated seasonal ETp was similar for both seasons (663 mm). All irrigation treatments were water-stressed, which reduced ETc compared with ETp during both seasons. However, on average, treatments in 2006 were more severely stressed than in 2005.
In 2005, seasonal ETc varied by 7.2% among treatments. Treatment T4-05[33-0-67], with the numbers in brackets repre-senting the percents of 150 mm allocation applied in July, August, and September, respectively, had the lowest ETc and T6-05[67-33-0] had the highest. ETc/ETp ranged from 0.89 to 0.96, averaging 0.94 for all treatments. However, except for T4-05[33-0-67] and T1-05[50-25-25], that had the lowest ETc/ETp, there was little difference in ETc and ETc/ETp among all the other treatments, which all have ETc/ETp0.94.
In 2006, seasonal ETc varied by 18.8% among treatments. Treatment T12-06[0-0-100] had the lowest ETc and treatment T14-06[50-50-0] had the highest ETc, followed by treatment T10-06 [100-0-0]. ETc/ETp ranged from 0.76 to 0.94, corre-sponding to those same treatments, averaging 0.85 for all treatments.
These results indicate that irrigation timing can have a considerable effect on ETc and on what proportion of ETp can be met with a given water allocation. They also show that the seasonal ETc and the proportion of ETp that can be met with a given allocation and timing varies with season, depending on weather conditions (affecting ETo), in-season rainfall, and starting soil water.
3.4. Yield and water use efficiency
Table 4shows the grain yield, WUE and IWUE both on a wet-mass and dry-wet-mass basis. ANOVA results showed significant yield differences among treatments during both years. Separation of treatment means indicated more clear-cut differences among treatments in 2006 compared with 2005, which could be due to more available soil water at planting in 2005.
Fig. 1.Soil water content profiles for the different irrigation treatments measured on June 14, 2006.
Table 3
Week from crop emergence and corresponding dates and stages of growth (Hoeft et al., 2000) for corn at North Platte, NE, during 2005 and 2006.
Week 2005 2006
Start date Stage Start date Stage
1 23 May Ve (Emergence) 16 May Ve (emergence)
2 30 May 23 May
3 6 June V6 (6-leaf) 30 May V6 (6-leaf)
4 13 June 6 June
5 20 June 13 June
6 27 June V12 (12-leaf) 20 June V12 (12-leaf)
7 4 July 27 June
8 11 July V18 (18-leaf) 4 July V18 (18-leaf)
9 18 July R1 (Silk) 11 July R1 (Silk)
10 25 July 18 July
11 1 August R2 (Blister) 25 July R2 (Blister)
12 8 August R3 (Milk) 1 August R3 (Milk)
13 15 August R4 (Dough) 8 August R4 (Dough)
14 22 August 15 August
15 29 August R5 (Dent) 22 August R5 (Dent)
16 5 September 29 August
17 12 September 5 September
18 19 September R6 (Maturity) 12 September
19 19 September R6 (Maturity)
In 2005, irrigation timing resulted in significant differences in grain yields of as much as 17% among treatments. Treatment T4-05[33-0-67] had the lowest ETc and the lowest yield. However, yield for T4-05[33-0-67] was only significantly different from those of T2-05[57-43-0], T6-05[67-33-0] and T8-05[33-34-33]. Treatments T2-05[57-43-0] and T6-05[67-33-0] had the highest yields, but were not significantly different to those of treatments T7-05[40-30-30] and T8-05[33-34-33].
In 2006, because of starting the season with a drier soil, compared with 2005, irrigation timing resulted in larger differ-ences in yield among treatments of as much as 33%, and a more clear-cut separation among treatment means. Treatments
T9-06[25-50-25], T15-06[33-34-33], and T16-06[0-67-33] had the lowest yields, which were not significantly different from that of T13-06[0-50-50]. These treatments either applied the allocation divided about evenly between July, August and September, or between August and September with no irrigation in July. Treatments T10-06[100-0-0] and T14-06[50-50-0] had the highest yields.
Table 4
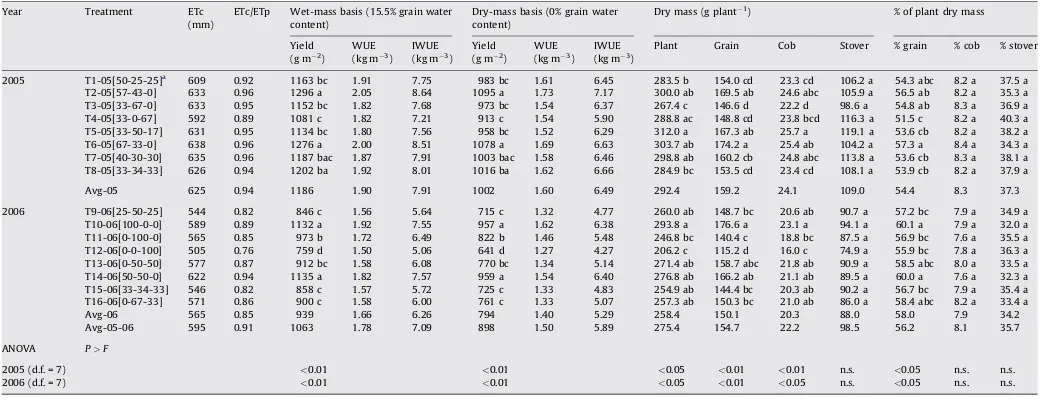
Corn yield, evapotranspiration, water use efficiency and above-ground dry mass production obtained with different irrigation treatments at North Platte, NE, during the 2005 and 2006 seasons.
Year Treatment ETc (mm)
ETc/ETp Wet-mass basis (15.5% grain water content)
Dry-mass basis (0% grain water content)
Dry mass (g plant1) % of plant dry mass
Yield (g m2)
WUE (kg m3)
IWUE (kg m3)
Yield (g m2)
WUE (kg m3)
IWUE (kg m3)
Plant Grain Cob Stover % grain % cob % stover
2005 T1-05[50-25-25]a 609 0.92 1163 bc 1.91 7.75 983 bc 1.61 6.45 283.5 b 154.0 cd 23.3 cd 106.2 a 54.3 abc 8.2 a 37.5 a
T2-05[57-43-0] 633 0.96 1296 a 2.05 8.64 1095 a 1.73 7.17 300.0 ab 169.5 ab 24.6 abc 105.9 a 56.5 ab 8.2 a 35.3 a T3-05[33-67-0] 633 0.95 1152 bc 1.82 7.68 973 bc 1.54 6.37 267.4 c 146.6 d 22.2 d 98.6 a 54.8 ab 8.3 a 36.9 a T4-05[33-0-67] 592 0.89 1081 c 1.82 7.21 913 c 1.54 5.90 288.8 ac 148.8 cd 23.8 bcd 116.3 a 51.5 c 8.2 a 40.3 a T5-05[33-50-17] 631 0.95 1134 bc 1.80 7.56 958 bc 1.52 6.29 312.0 a 167.3 ab 25.7 a 119.1 a 53.6 cb 8.2 a 38.2 a T6-05[67-33-0] 638 0.96 1276 a 2.00 8.51 1078 a 1.69 6.63 303.7 ab 174.2 a 25.4 ab 104.2 a 57.3 a 8.4 a 34.3 a T7-05[40-30-30] 635 0.96 1187 bac 1.87 7.91 1003 bac 1.58 6.46 298.8 ab 160.2 cb 24.8 abc 113.8 a 53.6 cb 8.3 a 38.1 a T8-05[33-34-33] 626 0.94 1202 ba 1.92 8.01 1016 ba 1.62 6.66 284.9 bc 153.5 cd 23.4 cd 108.1 a 53.9 cb 8.2 a 37.9 a
Avg-05 625 0.94 1186 1.90 7.91 1002 1.60 6.49 292.4 159.2 24.1 109.0 54.4 8.3 37.3
2006 T9-06[25-50-25] 544 0.82 846 c 1.56 5.64 715 c 1.32 4.77 260.0 ab 148.7 bc 20.6 ab 90.7 a 57.2 bc 7.9 a 34.9 a T10-06[100-0-0] 589 0.89 1132 a 1.92 7.55 957 a 1.62 6.38 293.8 a 176.6 a 23.1 a 94.1 a 60.1 a 7.9 a 32.0 a T11-06[0-100-0] 565 0.85 973 b 1.72 6.49 822 b 1.46 5.48 246.8 bc 140.4 c 18.8 bc 87.5 a 56.9 bc 7.6 a 35.5 a T12-06[0-0-100] 505 0.76 759 d 1.50 5.06 641 d 1.27 4.27 206.2 c 115.2 d 16.0 c 74.9 a 55.9 bc 7.8 a 36.3 a T13-06[0-50-50] 577 0.87 912 bc 1.58 6.08 770 bc 1.34 5.14 271.4 ab 158.7 abc 21.8 ab 90.9 a 58.5 abc 8.0 a 33.5 a T14-06[50-50-0] 622 0.94 1135 a 1.82 7.57 959 a 1.54 6.40 276.8 ab 166.2 ab 21.1 ab 89.5 a 60.0 a 7.6 a 32.3 a T15-06[33-34-33] 546 0.82 858 c 1.57 5.72 725 c 1.33 4.83 254.9 ab 144.4 bc 20.3 ab 90.2 a 56.7 bc 7.9 a 35.4 a T16-06[0-67-33] 571 0.86 900 c 1.58 6.00 761 c 1.33 5.07 257.3 ab 150.3 bc 21.0 ab 86.0 a 58.4 abc 8.2 a 33.4 a Avg-06 565 0.85 939 1.66 6.26 794 1.40 5.29 258.4 150.1 20.3 88.0 58.0 7.9 34.2 Avg-05-06 595 0.91 1063 1.78 7.09 898 1.50 5.89 275.4 154.7 22.2 98.5 56.2 8.1 35.7
ANOVA P>F
2005 (d.f. = 7) <0.01 <0.01 <0.05 <0.01 <0.01 n.s. <0.05 n.s. n.s. 2006 (d.f. = 7) <0.01 <0.01 <0.05 <0.01 <0.05 n.s. <0.05 n.s. n.s.
ETc = seasonal crop evapotranspiration; ETp = ETc with no water stress; ETp = 663 mm during both seasons. WUE = water use efficiency (yield/ETc); IWUE = irrigation water use efficiency (yield/irrigation).
ANOVA = analysis of variance; d.f. = degrees of freedom; treatment means with the same letters within a year had no significant (n.s.) differences at the 5% significance level.
aNumbers in brackets are percents of 150 mm allocation applied in July, August, and September, respectively.
J.O.
Payero
et
al.
/A
gricultural
Water
Management
96
(2009)
1387–1397
July and August, with no irrigation in September. Applying all the water in July, however, was not tested in 2005. Dividing the allocation about evenly among the three months was a good strategy in 2005, but not in 2006. Applying a larger proportion of the allocation in July was a good strategy during both seasons. Appling all or a large proportion of the allocation in September was not a good strategy and resulted in the lowest yields. The different results obtained between years indicate that flexible irrigation scheduling techniques should be adopted, rather than relying on pre-conceived timing strategies.
In 2005, irrigation timing also resulted in differences in WUE and IWUE (dry-mass basis) among treatments of as much as 12 and 18%, respectively. Larger differences of as much as 22 and 33% in WUE and IWUE, respectively, were observed in 2006. Combining data for 2005 and 2006, expressing yield and WUE on a dry-mass basis, and using the same units as in Eq. (7), resulted in the following relationships:
Y¼3:24ETc1032:1 ðR2
¼0:89Þ (9)
Y¼2152ETc ETp ðR
2
¼0:89Þ (10)
WUE¼0:001Yþ0:586 ðR2¼0:95Þ (11)
WUE¼0:0031ETc0:319 ðR2¼0:72Þ (12)
WUE¼2:397ETc
ETp0:688 ðR 2
¼0:72Þ (13)
Payero et al. (2006b)also reported increasing WUE with ETc/ ETp for a wider range of ETc/ETp values for corn under sprinkler irrigation at this site. One should note, however, that if the relationship between yield and ETc is linear, as indicated by Eq.(9), then the relationship between WUE and ETc or between WUE and ETc/ETp should, theoretically, be curvilinear instead of linear, if a wide enough range of ETc or ETc/ETp values is included (Payero et al., 2008). Therefore, the linear relationships reported here only apply within the range of ETc, ETc/ETp, yield, and WUE values obtained in this study and extrapolating beyond these limits may not provide accurate estimates.
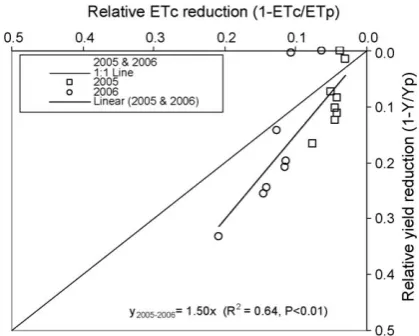
3.5. Yield response factor (ky) and dry mass production and partitioning
From the experimental data, the yield response factor (ky) to water stress (Doorenbos and Kassam, 1979) was obtained by plotting the relative yield reduction with respect to the relative ETc reduction for each treatment (Fig. 3). The potential corn yield (Yp) during each season was obtained from a companion study under full irrigation (Payero et al., 2008). The slope of the line inFig. 3represents ky, which averaged 1.50 over the two seasons. Since ky is sensitive to stress timing, the 1.50 value is representative of the situation encountered in this study in which stress occurred during the reproductive stage, with no stress occurring during the vegetative period. The average value of ky = 1.50 obtained in this study is the same as the value reported byDoorenbos and Kassam (1979)for stress during the flowering stage.Fig. 3also shows that two treatments each year resulted in practically no relative yield reduction. These treatments corresponded to T2-05[57-43-0] and T6-05[67-33-0] in 2005 and T10-06[100-0-T6-05[67-33-0] and T14-06[50-50-T6-05[67-33-0] in 2006. These treatments either received all of the water in July or divided the allocation between July and August, with no irrigation in September.
Table 4 shows the above-ground plant dry mass (DM)
production and partitioning into the grain, cob and stover.
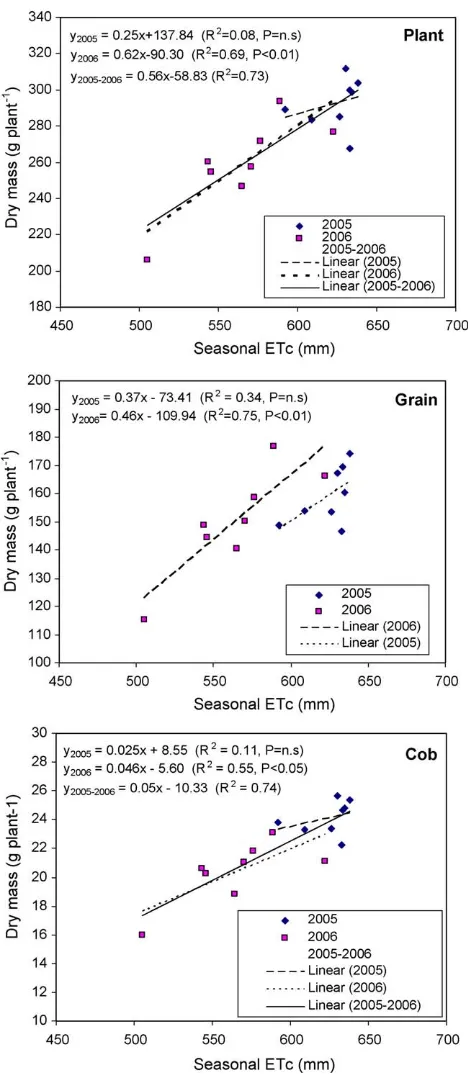
ANOVA results showed that within each season, irrigation timing significantly affected the DM of the plant, grain, and cob. However, it did not affect the DM of the stover, which could have been due to the lack of stress during the vegetative stages. The DM of the plant, grain, and cob all increased linearly with seasonal ETc in 2006 (Fig. 4). In 2005, however, due to the small range in seasonal ETc, the linear relationships were not significant (P>0.05).
Table 4 also shows the percent of the above-ground DM
partitioned into plant components (grain, cob, and stover). Most of the DM was partitioned into the grain, which averaged 56.2% over the two seasons. Irrigation timing only significantly affected the percent DM allocated to the grain during both seasons. The value of percent DM allocated to the grain is often represented as a fraction, instead of a percentage, and is usually referred to as harvest index (HI) (Farre´ and Faci, 2009; Stockle and Campbell, 1985). The percent DM allocated to the grain increased linearly with seasonal ETc, with different relationships resulting each season (Fig. 5). The values of percent DM allocated to the grain reported here represent deficit-irrigation conditions and were lower than the values that could be achieved with full irrigation.Payero et al. (2008)reported values as high as 61.8% for this site under full irrigation. Similar to the findings of this study, Farre´ and Faci (2009) also reported significant effect of deficit irrigation on HI, which ranged from 0.31 to 0.55 over two seasons.
3.6. Effect of irrigation and stress timing on yield
applied at all in July and August when the crop needed it the most.
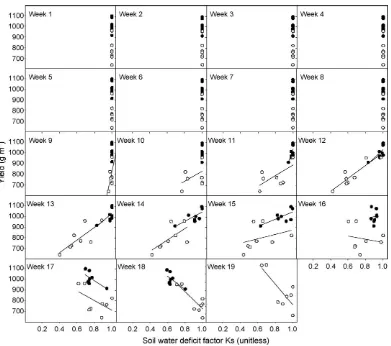
The effect of stress timing on final yield was also evaluated by plotting the average Ks values (a measure of water stress) against final grain yield for each week from crop emergence to physiological maturity (Fig. 7). Ks had no relationship with yield earlier in the season since there was no stress or only little stress from emergence to week 11. Therefore, the effect of water stress
during the vegetative stages could not be evaluated in this study. The best positive correlation between Ks and yield occurred during weeks 12–14 (early to mid-August), which coincided with the R3 (milk) and R4 (dough) growth stages (Table 3). The positive correlation was poor during weeks 15 and 16, and became negative from weeks 17 to 19. Irrigations after week 17 were not necessarily detrimental to crop development, but the negative effect was observed because these late irrigations were applied at the expense of stressing the crop earlier.
These findings suggest that under the conditions of this study, irrigations applied in July had the greatest positive effect on crop yield since they resulted in less stress in early to mid-August (weeks 12–14), during the critical reproductive growth stages. The linear relationship between yield and ETc obtained in this study, and in many others, also suggests that yield is reduced if the crop is stressed at any stage of growth. The effect of stress is more severe during the reproductive stages partially because ETc is usually the highest at that time and stress can reduce ETc more significantly than when ETc is small. Stress during the vegetative stages reduces total plant DM, which has been shown to be linearly related to yield (Payero et al., 2008; Howell et al., 1997), limiting the yield potential starting early in the growing season. Therefore, if water is limited, stress should be avoided early in the season and especially during the reproductive stages. Stress late in the season (from dent to maturity) is, therefore, the option that offers the least risk of significant yield reduction when water is limited.
Fig. 5.Relationships between corn seasonal evapotranspiration (ETc) and the percent of dry mass partitioned into grain obtained with different irrigation treatments during 2005 and 2006 at North Platte, NE.
Fig. 6.Correlation coefficients of corn grain yield (dry-mass basis) and irrigation applied (mm) during July, August and September, limited to a total seasonal irrigation of 150 mm, at North Platte, NE, during 2005 and 2006.
Fig. 4.Relationships between corn seasonal evapotranspiration (ETc) and the dry mass of the plant, grain and cob obtained with different irrigation treatments during 2005 and 2006 at North Platte, NE.P= n.s. means not significant at the 5% significance level.
4. Conclusions
The significant yield differences among treatments and the wide range of yields obtained in this study with a fixed water allocation indicate that proper timing of irrigation is critical for maximizing yield. The observed differences in yield resulted mainly from differences in crop ETc that translated into differences in plant DM production. The increase in plant DM resulting from more ETc was allocated into the production of grain and cob, rather than into stover. In this study, water applied in July had the most positive impact on yield. Results of this study also suggest that it is critical to time irrigations to minimize crop stress during weeks 12–14 from crop emergence, which coincided with the R3 (milk) and R4 (dough) growth stages.
Since proper irrigation timing can vary from year to year depending on in-season rainfall, weather conditions and stored soil water at planting, dividing the 150 mm allocation about evenly among the three months was a good strategy in 2005, but not in 2006. Applying a larger proportion of the allocation in July was a good strategy during both years. Applying all or a large proportion of the allocation in September resulted in the lowest yields. The different results obtained between years indicate that flexible irrigation scheduling techniques should be adopted, rather than relying on pre-conceived strategies. However, since most farmers in Nebraska rely on the ‘‘condition of crop’’ and the ‘‘feel of soil’’ to decide when to irrigate (USDA, 1999), these results can be used as a guide to improve their irrigation timing under water-limited situations, which can translate into water savings and/or higher yields.
Acknowledgements
Funding for this project was provided by the U.S. Department of the Interior, Bureau of Reclamation, and by the University of Nebraska-Lincoln. Names of commercial products are solely provided as information to the reader and do not imply an endorse-ment or recommendation by the authors or their organizations.
References
Allen, R.G., Pereira, L.S., Raes, D., Smith, M., 1998. Crop Evapotranspiration—Guide-lines for Computing Crop Water Requirements. Food and Agricultural Organi-zation of the United Nations (FAO), Rome, Italy (Irrigation and Drainage Paper No. 56).
ASCE-EWRI, 2005. The ASCE standardized reference evapotranspiration equation. R.G. Allen, I.A. Walter, R.L. Elliot, T.A. Howell, D. Itenfisu, M.E. Jensen, R.L. Snyder (Eds.). Environmental and Water Resources Institute (EWRI) of the American Society of Civil Engineers (ASCE) Standardization of Reference Evapotranspira-tion Task Committee Final Report, ASCE, Reston, VA, 213 pp.
Ayars, J.E., Phene, C.J., Hutmacher, R.B., Davis, K.R., Schoneman, R.A., Vail, S.S., Mead, R.M., 1999. Subsurface drip irrigation of row crops: a review of 15 years of research at the Water Management Research Laboratory. Agric. Water Manage. 42, 1–27.
Barnes, D.L., Woolley, D.G., 1969. Effect of moisture stress at different stages of growth. I. Comparison of single-eared and two-eared corn hybrids. Agron. J. 61, 788–790.
Barrett, J.W.H., Skogerboe, G.V., 1978. Effect of irrigation regime on maize yields. J. Irrig. Drain. Div. 104, 179–194.
Bryant, K.J., Benson, V.W., Kiniry, J.R., Williams, J.R., Lacewell, R.D., 1992. Simulating corn yield response to irrigation timings: validation of the Epic model. J. Prod. Agric. 5, 237–242.
Caldwell, D.S., Spurgeon, W.E., Manges, H.L., 1994. Frequency of irrigation for subsurface drip-irrigated corn. Trans. ASAE 31 (4), 1099–1103.
Camp, C.R., 1998. Subsurface drip irrigation: a review. Trans. ASAE 41 (5), 1353– 1367.
Claassen, M.M., Shaw, R.H., 1970. Water deficit effects on corn. II. Grain compo-nents. Agron. J. 62, 652–655.
Denmead, O.T., Shaw, R.H., 1960. The effects of soil moisture stress at different stages of growth on the development and yield of corn. Agron. J. 52, 272–274. Downey, L.A., 1971. Effect of gypsum and drought stress on maize (Zea maysL.). I.
Growth, light absorption and yield. Agron. J. 63, 569–572.
Doorenbos, J., Kassam, A.H., 1979. Yield response to water. FAO Irrigation and Drainage Paper No. 33, FAO, Rome, Italy, 193 pp.
Dwyer, L.M., Stewart, D.W., 1984. Indicators of water stress in corn (Zea maysL.). Can. J. Plant Sci. 64, 537–546.
Dwyer, L.M., Stewart, D.W., 1985. Water stress conditioning of corn (Zea mays) in the field and the greenhouse. Can. J. Bot. 63, 704–710.
English, M.J., Solomon, K.H., Hoffman, G.J., 2002. A paradigm shift in irrigation management. J. Irrig. Drain. Eng. 128, 267–277.
Farre´, I., Faci, J.-M., 2009. Deficit irrigation in maize for reducing agricultural water use in a Mediterrranean environment. Agric. Water Manage. 96, 383–394. Gavloski, J.E., Whitfield, G.H., Ellis, C.R., 1992. Effect of restricted watering on sap
flow and growth in corn (Zea maysL.). Can. J. Plant Sci. 72, 361–368. Gilley, J.R., Watts, D.G., Sullivan, C.Y., 1980. Management of irrigation agriculture
with a limited water and energy supply. Institute of Agriculture and Natural Resources, University of Nebraska-Lincoln, 168 pp.
Hanks, R.J., 1974. Model for predicting plant yield as influenced by water use. Agron. J. 66, 660–664.
Hanks, R.J., Keller, J., Rasmussen, V.P., Wilson, G.D., 1976. Line source sprinkler for continuous variable irrigation-crop production studies. Soil Sci. Soc. Am. J. 40, 426–429.
Havaux, M., Lannoye, R., 1983. Chlorophyll fluorescence induction: a sensitive indicator of water stress in maize plants. Irrig. Sci. 4, 147–151.
Hergert, G.W., Klocke, N.L., Petersen, J.L., Nordquist, P.T., Clark, R.T., Wicks, G.A., 1993. Cropping systems for stretching limited irrigation supplies. J. Prod. Agric. 6, 520–528.
Herrero, M.P., Johnson, R.R., 1981. Drought stress and its effects on maize repro-ductive systems. Crop Sci. 21, 105–110.
Hoeft, R.G., Nafziger, E.D., Johnson, R.R., Aldrich, S.R., 2000. Modern Corn and Soybean Production. MCSP Publications, Champaign, IL, USA, 353 pp. Howell, T.A., Schneider, A.D., Evett, S.R., 1997. Subsurface and surface
microirriga-tion of corn-Southern High Plains. Trans. ASAE 40, 635–641.
Jama, A.O., Ottman, M.J., 1993. Timing of the first irrigation in corn and water stress conditioning. Agron. J. 85, 1159–1164.
Jensen, M.E., 1968. Water consumption by agricultural plants. In: Kozlowski, T.T. (Ed.), Water Deficits and Plant Growth. Academic Press, New York, pp. 1–22. Jurgens, S.K., Johnson, R.R., Boyer, J.S., 1978. Dry matter production and
transloca-tion in maize subjected to drought during grain fill. Agron. J. 70, 678–682. Klocke, N.L., Schneekloth, J.P., Melvin, S., Clark, R.T., Payero, J.O., 2004. Field scale
limited irrigation scenarios for water policy strategies. Appl. Eng. Agric. 20, 623–631.
Lamm, F.R., Manges, H.L., Stone, L.R., Khan, A.H., Rogers, D.H., 1995. Water require-ment of subsurface drip-irrigated corn in Northwest Kansas. Trans. ASAE 38 (2), 441–448.
Lamm, F.R., Trooien, T.P., 2003. Subsurface drip irrigation for corn production: a review of 10 years of research in Kansas. Irrig. Sci. 22, 195–200.
Lingle, G.R., Franti, T.G., 1998. What is the ‘‘Cooperative Agreement’’ for Endangered Species habitat along the Central Platte River? NebFact NF98-375. University of Nebraska-Lincoln Cooperative Extension Publication, 5 pp.http://www.ianrpubs. unl.edu/wildlife/nf375.htm
Martin, D.L., Brocklin, J.V., Wilmes, G., 1989. Operating rules for deficit irrigation management. Trans. ASAE 32, 1207–1215.
McGuire, V.L., Fischer, B.C., 1999. Water-level Changes, 1980 to 1997, and Saturated Thickness, 1996–97, in the High Plains Aquifer. Fact Sheet 124–199. U.S. Geological Survey, Lincoln.
McGuire, V.L., 2004. Water-level Changes in the High Plains Aquifer, Predevelop-ment to 2002, 1980 to 2002, and 2001 to 2002. Fact Sheet 2004–3026. U.S. Geological Survey, Lincoln.
McPherson, H.G., Boyer, J.S., 1977. Regulation of grain yield by photosynthesis in maize subjected to a water deficiency. Agron. J. 69, 714–718.
Meyer, S.J., Hubbard, K.G., Wilhite, D.A., 1993a. A crop-specific drought index for corn. I. Model development and validation. Agron. J. 85, 388–395.
Meyer, S.J., Hubbard, K.G., Wilhite, D.A., 1993b. A crop-specific drought index for corn. II. Application in drought monitoring and assessment. Agron. J. 85, 396– 399.
Nairizi, S., Rydzewski, J.R., 1977. Effects of dated soil moisture stress on crop yields. Exp. Agric. 13, 51–59.
NeSmith, D.S., Ritchie, J.T., 1992. Short- and long-term responses of corn to pre-anthesis soil water deficit. Agron. J. 84, 107–113.
Newell, R.L., Wilhelm, W.W., 1987. Conservation tillage and irrigation effects on corn root development. Agron. J. 79, 160–165.
Norwood, C.A., 2000. Water use and yield of limited-irrigated and dryland corn. Soil Sci. Soc. Am. J. 64, 365–370.
Payero, J.O., Melvin, S.R., Irmak, S., 2005. Response of soybean to deficit irrigation in the semi-arid environment of west-central Nebraska. Trans. ASAE 48, 2189– 2203.
Payero, J.O., Klocke, N.L., Schneekloth, J.P., Davison, D.R., 2006a. Comparison of irrigation strategies for surface-irrigated corn in West Central Nebraska. Irrig. Sci. 24, 257–265.
Payero, J.O., Melvin, S.R., Irmak, S., Tarkalson, D., 2006b. Yield response of corn to deficit irrigation in a semiarid climate. Agric. Water Manage. 84, 101– 112.
Payero, J.O., Tarkalson, D.D., Irmak, S., Davison, D., Petersen, J.L., 2008. Effect of irrigation amounts applied with subsurface drip irrigation on corn evapotran-spiration, yield, water use efficiency, and dry matter production in a semiarid climate. Agric. Water Manage. 95, 895–908.
Robinson, J.M., Hubbard, K.G., 1990. Soil water assessment model for several crops in the High Plains. Agron. J. 82, 1141–1148.
Robins, J.S., Domingo, C.E., 1953. Some effects of severe soil moisture deficit at specific growth stages in corn. Agron. J. 45, 618–621.
Schneekloth, J.P., Klocke, N.L., Hergert, G.W., Martin, D.L., Clark, R.T., 1991. Crop rotations with full and limited irrigation and dryland management. Trans. ASAE 34, 2372–2380.
Schneekloth, J., Klocke, N.L., Davison, D.R., Payero, J.O., 2006. Furrow irrigation management with limited water. Appl. Eng. Agric. 22, 391–398.
Stockle, C., Campbell, G., 1985. A simulation model for predicting effect of water stress on yield: an example using corn. Advances in Irrigation, vol. 3. Academic Press, Inc., pp. 283–311.
Stone, L.R., 2003. Crop water use requirements and water use efficiencies. In: Proceedings of the 15th Annual Central Plains Irrigation Conference and Expo-sition, February 4–5, Colby, Kansas, pp. 127–133.
Swan, J.B., Staricka, J.A., Shaffer, M.J., Paulson, W.H., Peterson, A.E., 1990. Corn yield response to water stress, heat units, and management: model development and calibration. Soil Sci. Soc. Am. J. 54, 209–216.
Traore, S.B., Carlson, R.E., Pilcher, C.D., Rice, M.E., 2000. Bt and non-Bt maize growth and development as affected by temperature and drought stress. Agron. J. 92, 1027–1035.
USDA, 1999. 1997 Census of Agriculture: Farm and Ranch Irrigation Survey (1998), Volume 3, Special Studies, Part 1, National Agricultural Statistics Service, Washington, DC, USA.
USDA, 1978. Soil survey of Lincoln County, Nebraska. A Publication of the U.S. Department of Agriculture Soil Conservation Service, in cooperation with University of Nebraska Conservation and Survey Division.
Vincent, G.B., Woolley, D.G., 1972. Effect of moisture stress at different stages of growth. II. Cytoplasmic male-sterile corn. Agron. J. 64, 599–602.